| Param | Original file | Final file |
|---|---|---|
| Filename | modeM0/AS1A05_069T05_9000002420_16385cztM0_level2.evt | modeM0/AS1A05_069T05_9000002420_16385cztM0_level2_quad_clean.evt |
| Size (bytes) | 531,956,160 | 70,827,840 |
| Size | 507.3 MB | 67.5 MB |
| Events in quadrant A | 3,468,428 | 437,350 |
| Events in quadrant B | 3,882,391 | 452,113 |
| Events in quadrant C | 3,335,123 | 421,354 |
| Events in quadrant D | 4,986,521 | 382,901 |
| Mode M9 | |||
|---|---|---|---|
| Quadrant | BADHDUFLAG | Total packets | Discarded packets |
| A | 0 | 19 | 0 |
| B | 0 | 19 | 0 |
| C | 0 | 19 | 0 |
| D | 0 | 20 | 0 |
| Mode SS | |||
|---|---|---|---|
| Quadrant | BADHDUFLAG | Total packets | Discarded packets |
| A | 0 | 132 | 0 |
| B | 0 | 132 | 0 |
| C | 0 | 132 | 0 |
| D | 0 | 132 | 0 |
| Mode M0 | |||
|---|---|---|---|
| Quadrant | BADHDUFLAG | Total packets | Discarded packets |
| A | 0 | 14158 | 3 |
| B | 0 | 15552 | 2 |
| C | 0 | 13720 | 2 |
| D | 0 | 19078 | 2 |
| Quadrant | Total seconds | Saturated seconds | Saturation percentage |
|---|---|---|---|
| A | 6458 | 60 | 0.929080% |
| B | 6458 | 112 | 1.734283% |
| C | 6458 | 58 | 0.898111% |
| D | 6458 | 344 | 5.326727% |
Noise dominated data is calculated using 1-second bins in cleaned event files. If a bin has >2000 counts, and if more than 50% of those come from <1% of pixels, then it is considered to be noise-dominated and hence unusable.
| Quadrant | # 1 sec bins | Bins with >0 counts | Bins with >2000 counts | High rate bins dominated by noise | Noise dominated (total time) | Noise dominated (detector-on time) | Marked lightcurve |
|---|---|---|---|---|---|---|---|
| A | 7819 | 6460 | 18 | 18 | 0.23% | 0.28% | 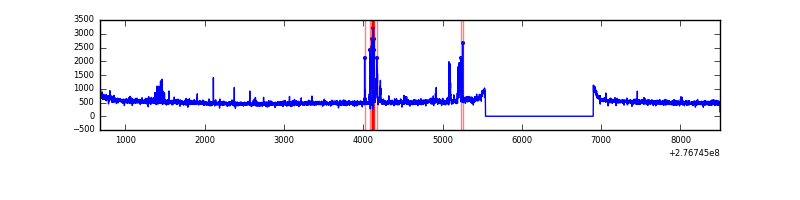 |
| B | 7819 | 6460 | 30 | 30 | 0.38% | 0.46% | 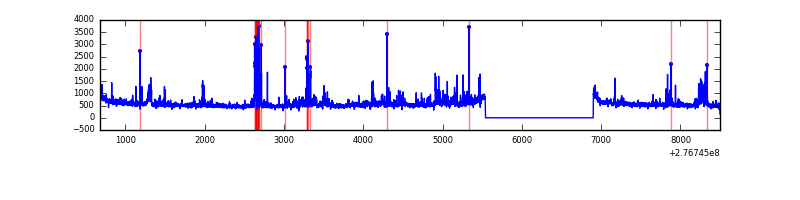 |
| C | 7819 | 6460 | 0 | 0 | 0.00% | 0.00% | 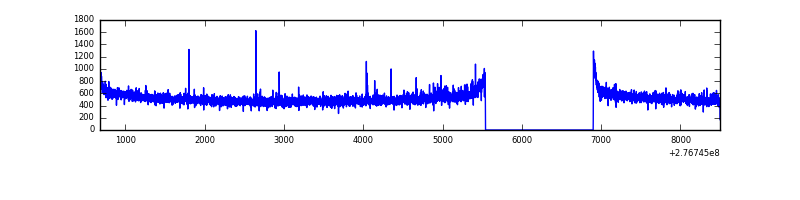 |
| D | 7819 | 6460 | 278 | 278 | 3.56% | 4.30% | 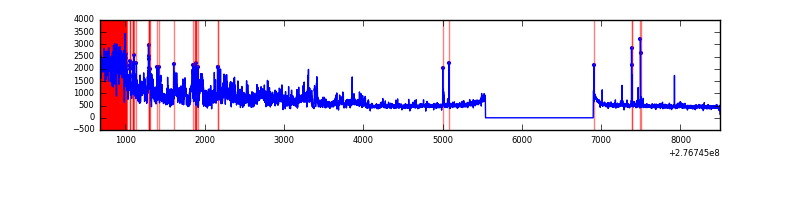 |
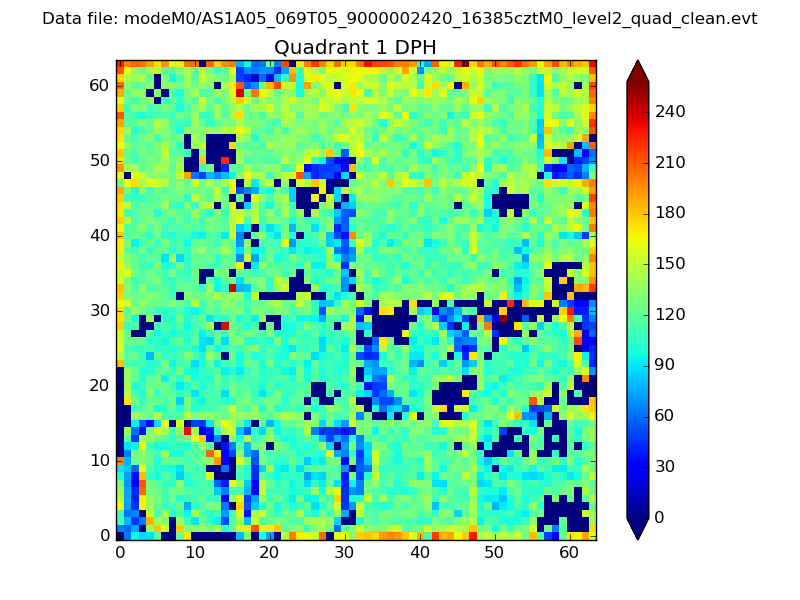
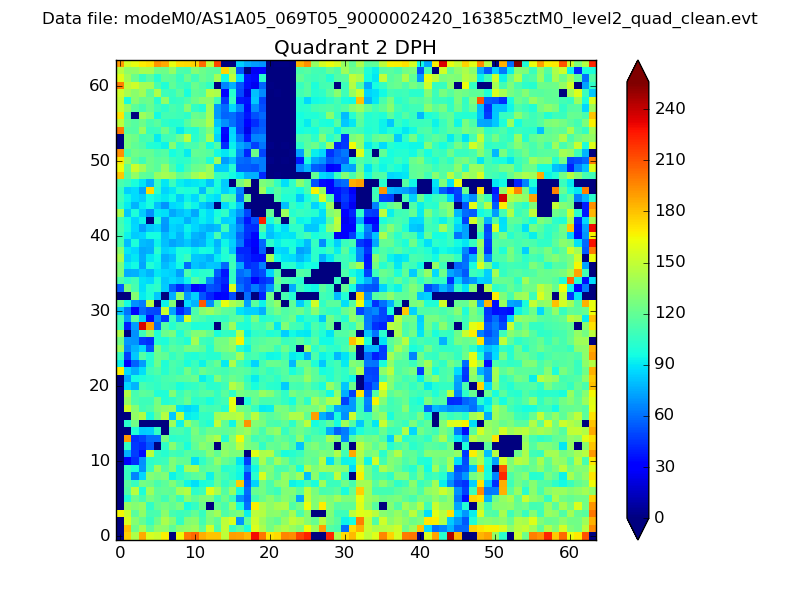
Top three noisy pixels from each quadrant. If the there are fewer than three noisy pixels in the level2.evt file, extra rows are filled as -1
| Pixel properties | Quadrant properties | ||||||
|---|---|---|---|---|---|---|---|
| Quadrant | DetID | PixID | Counts | Sigma | Mean | Median | Sigma |
| A | 15 | 174 | 176631 | 1038.48 | 845 | 828 | 169.3 |
| A | 9 | 143 | 22547 | 128.3 | 845 | 828 | 169.3 |
| A | 15 | 223 | 18949 | 107.04 | 845 | 828 | 169.3 |
| B | 10 | 16 | 186444 | 1169.67 | 855 | 837 | 158.7 |
| B | 15 | 35 | 164786 | 1033.19 | 855 | 837 | 158.7 |
| B | 0 | 189 | 61171 | 380.22 | 855 | 837 | 158.7 |
| C | 14 | 238 | 127197 | 673.32 | 809 | 815 | 187.7 |
| C | 3 | 233 | 49092 | 257.2 | 809 | 815 | 187.7 |
| C | 13 | 61 | 5888 | 27.03 | 809 | 815 | 187.7 |
| D | 2 | 122 | 1884335 | 9812.81 | 788 | 767 | 191.9 |
| D | 12 | 218 | 77729 | 400.95 | 788 | 767 | 191.9 |
| D | 2 | 234 | 24025 | 121.17 | 788 | 767 | 191.9 |
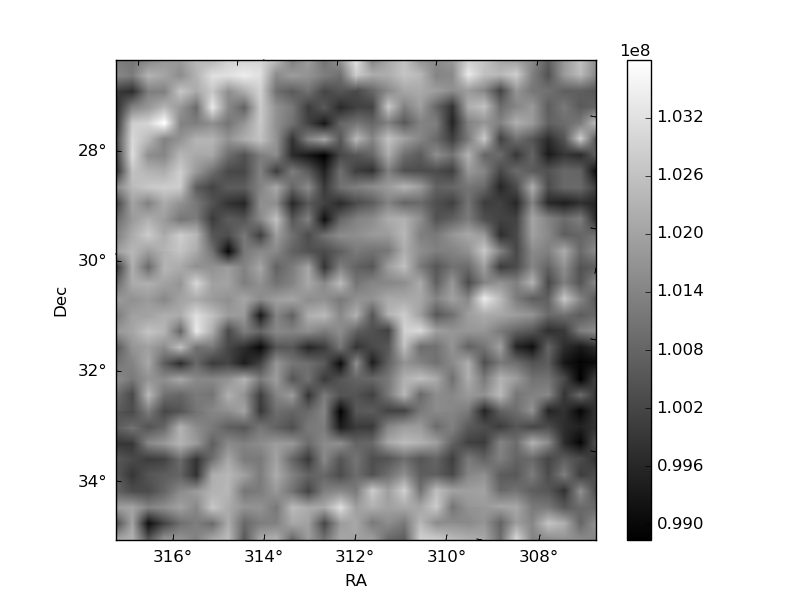
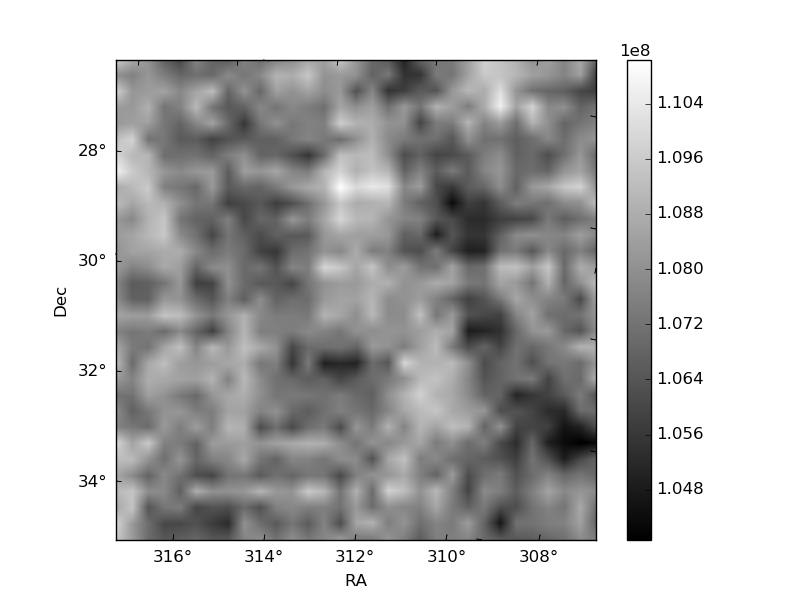
Histogram calculated using DETX and DETY for each event in the final _common_clean file
| Quadrant A | 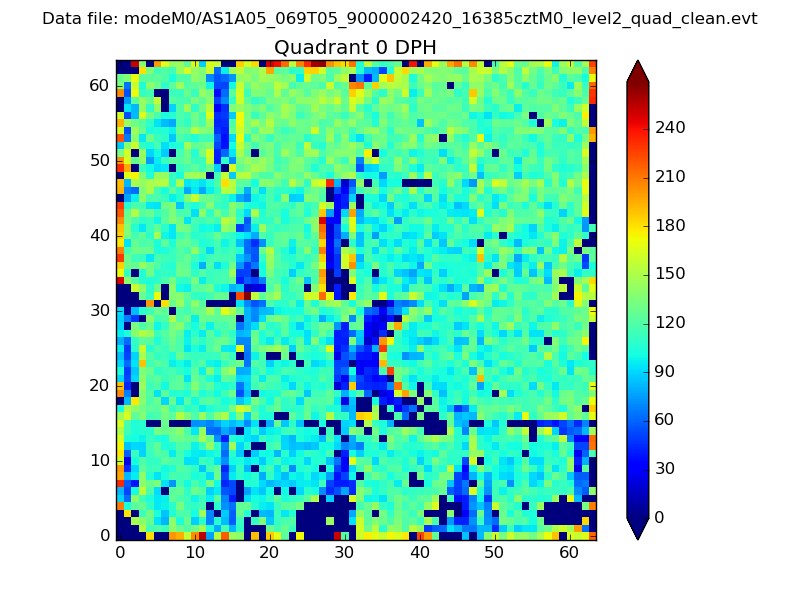 |
 |
Quadrant B |
|---|---|---|---|
| Quadrant D | 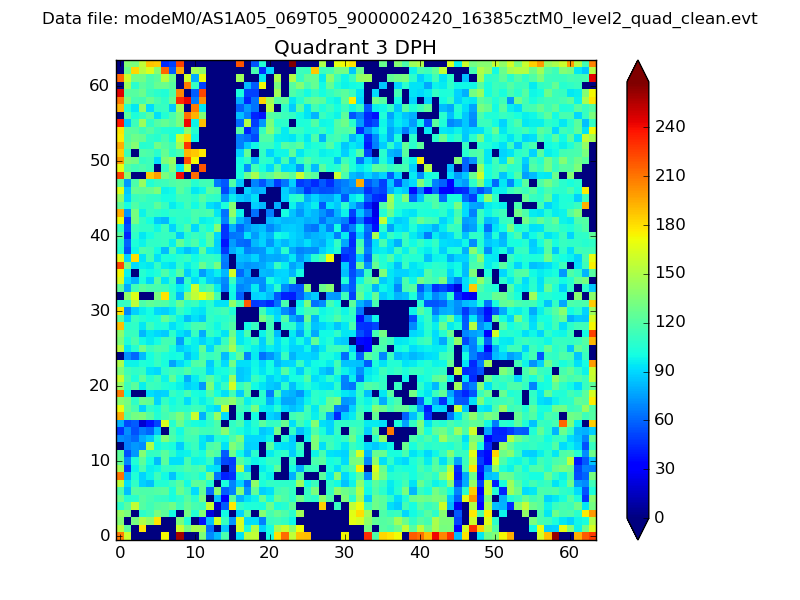 |
 |
Quadrant C |
| Plot type | Count rate plots | Images |
|---|---|---|
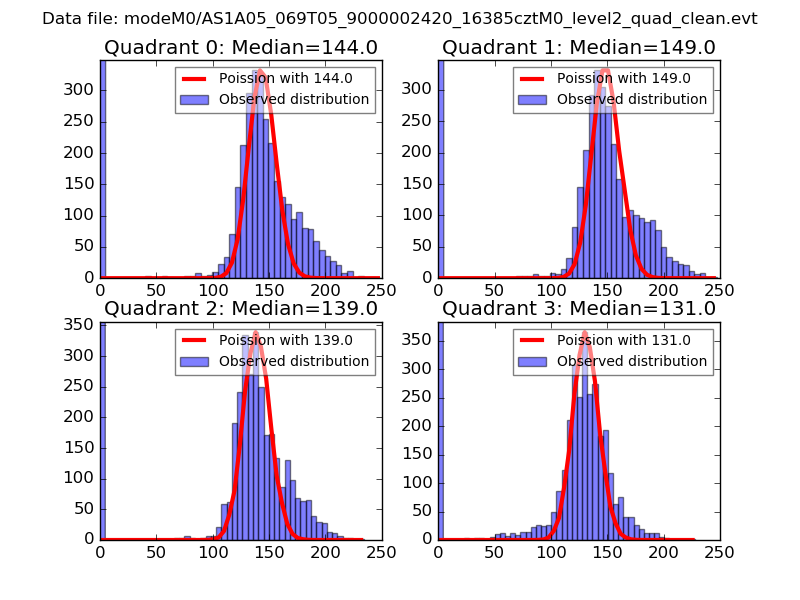
| Comparison with Poisson distribution Blue bars denote a histogram of data divided into 1 sec bins. Red curve is a Poisson curve with rate = median count rate of data. |
 |
 |
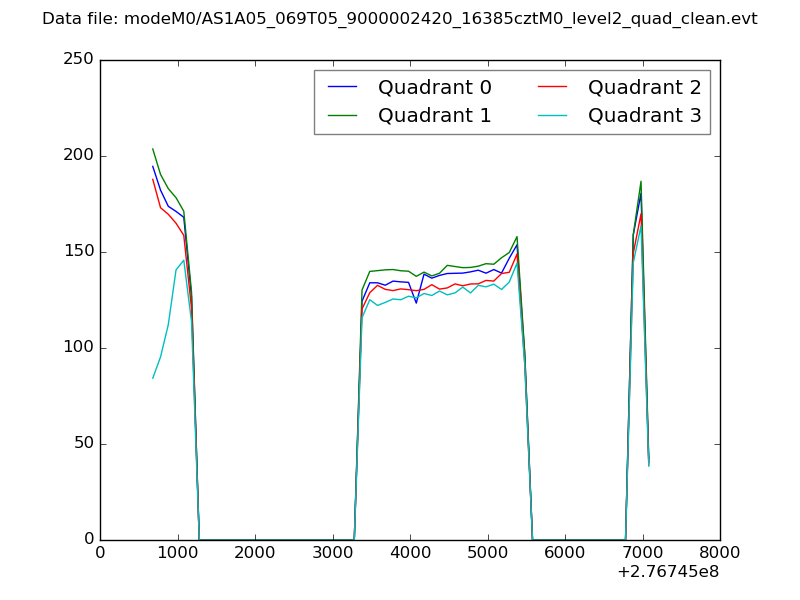
| Quadrant-wise count rates Data is divided into 100 sec bins |
 |
|
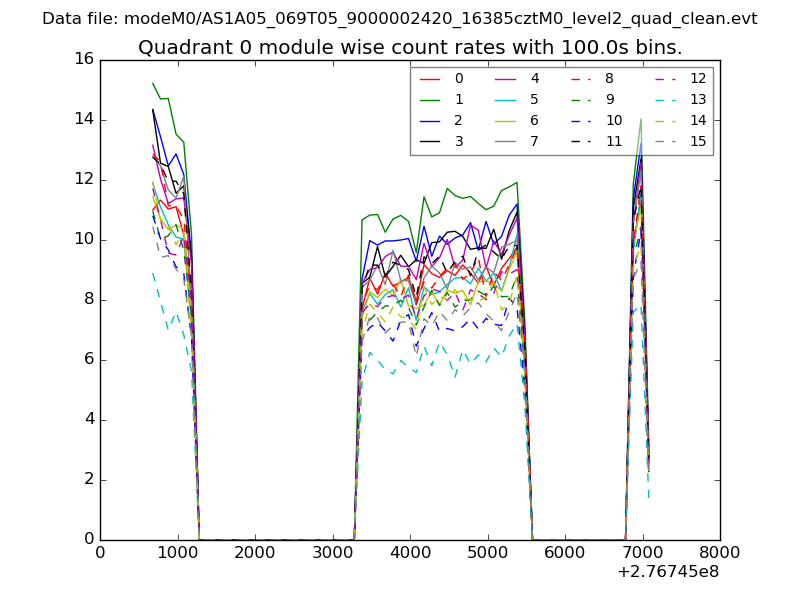
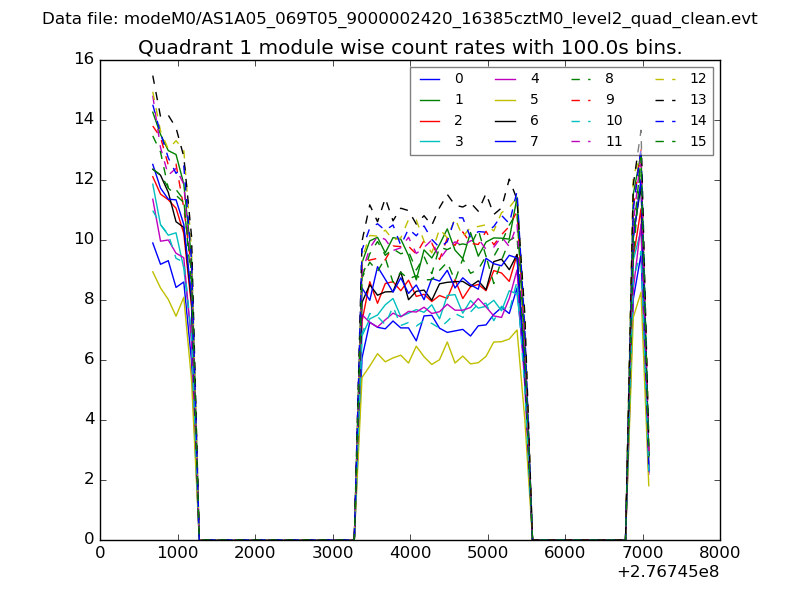
| Module-wise count rates for Quadrant A Data is divided into 100 sec bins |
 |
 |
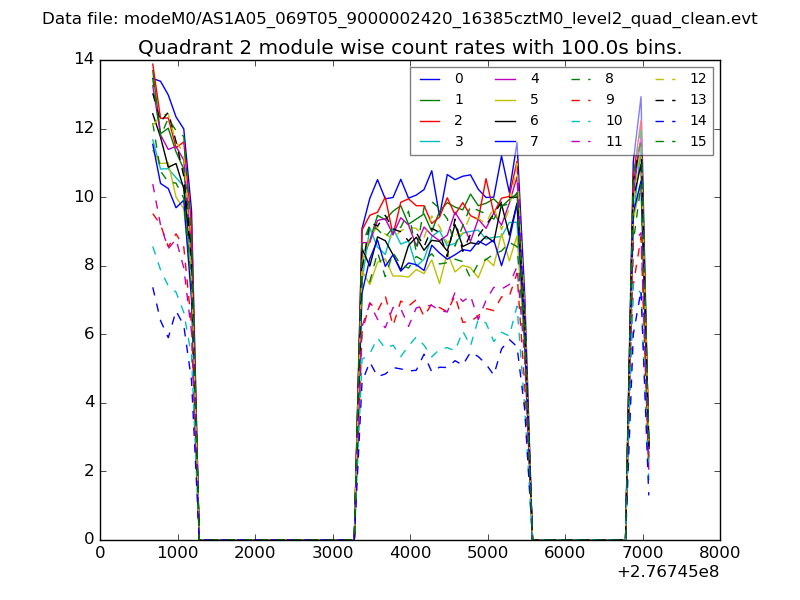
| Module-wise count rates for Quadrant B Data is divided into 100 sec bins |
 |
 |
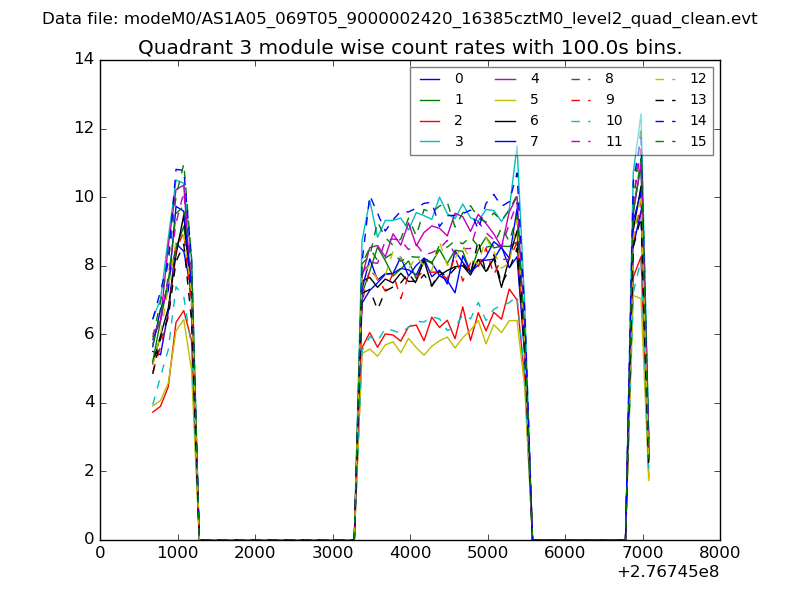
| Module-wise count rates for Quadrant C Data is divided into 100 sec bins |
 |
 |
| Module-wise count rates for Quadrant D Data is divided into 100 sec bins |
 |
 |
| Parameter | Plot |
|---|---|
| CZT HV Monitor | 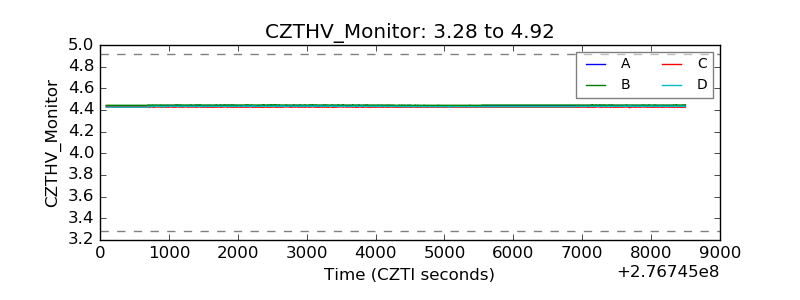 |
| D_VDD | 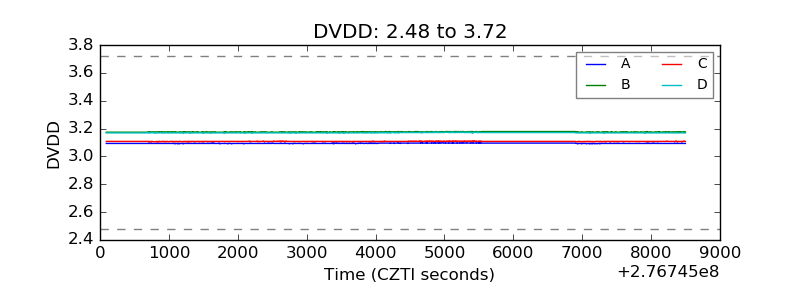 |
| Temperature 1 | 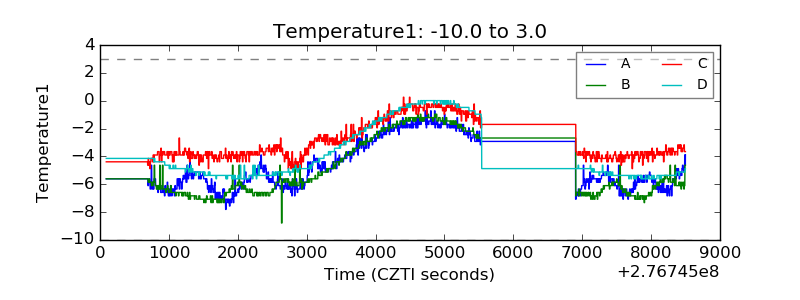 |
| Veto HV Monitor | 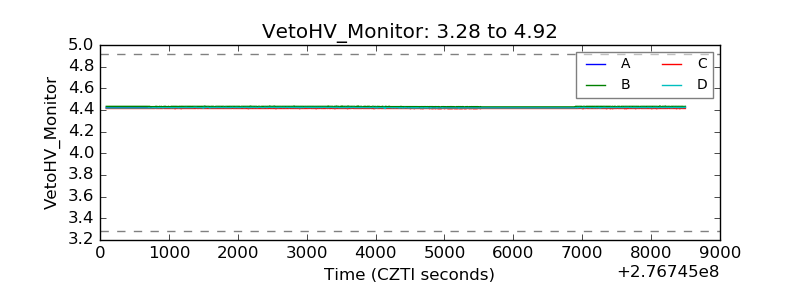 |
| Veto LLD | 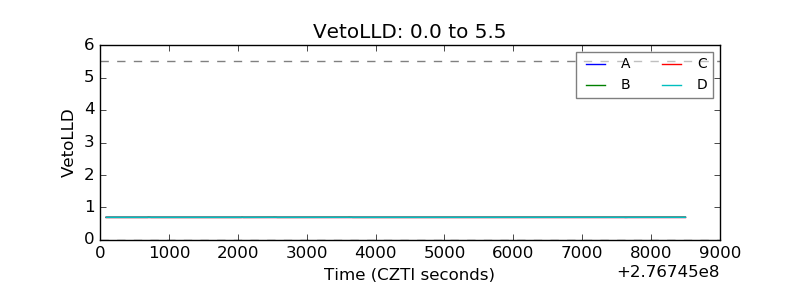 |
| Alpha Counter | 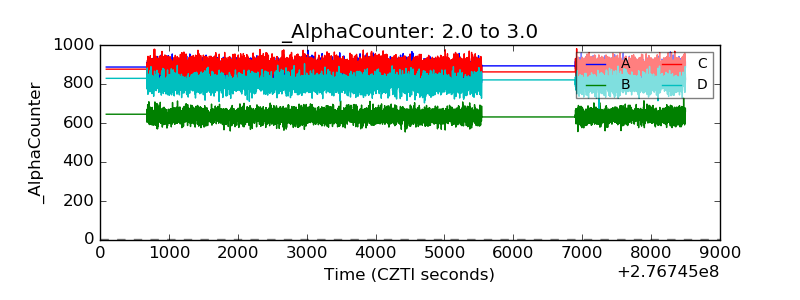 |
| _CPM_Rate | 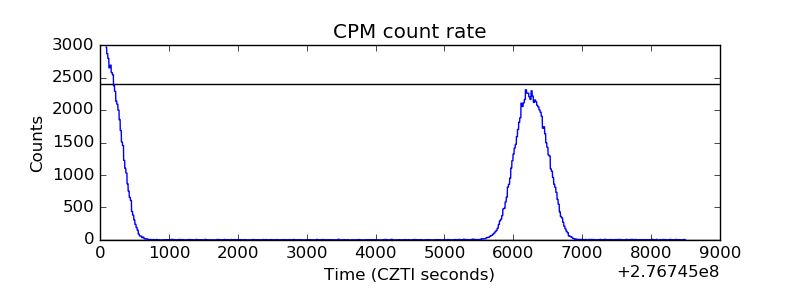 |
| CZT Counter | 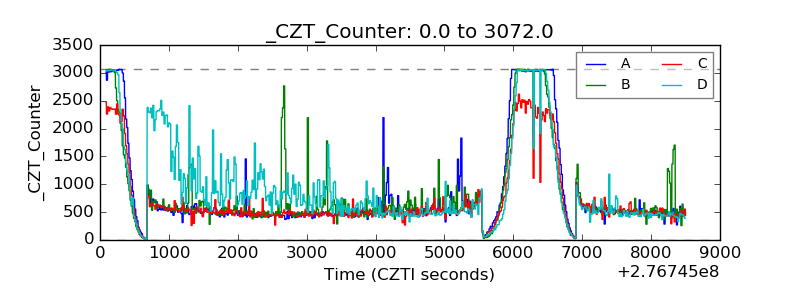 |
| +2.5 Volts monitor |  |
| +5 Volts monitor |  |
| _ROLL_ROT | 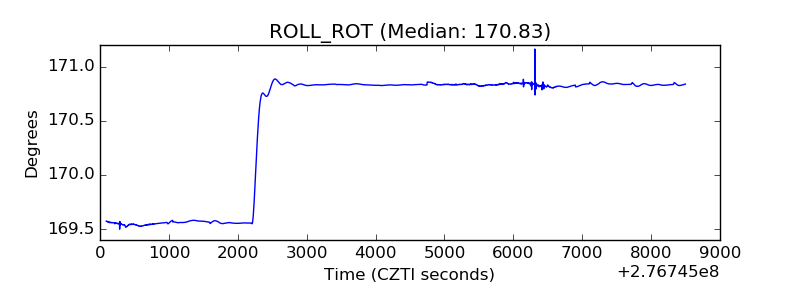 |
| _Roll_DEC | 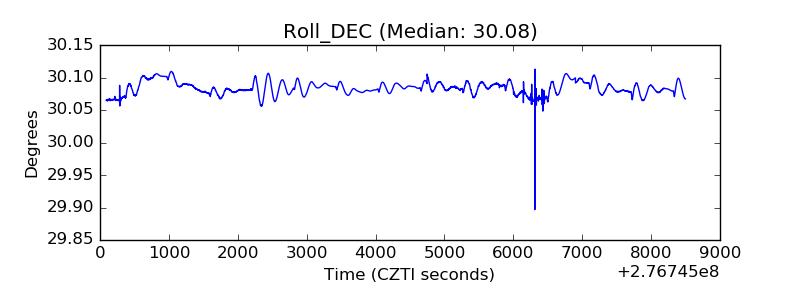 |
| _Roll_RA | 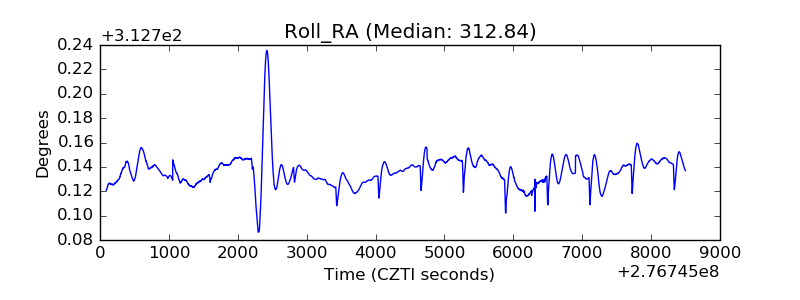 |
| Veto Counter | 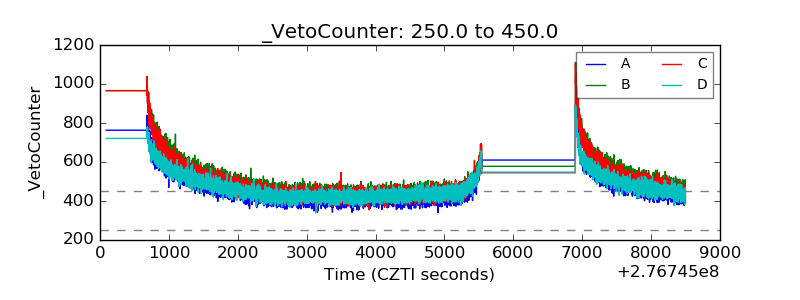 |