| Param | Original file | Final file |
|---|---|---|
| Filename | modeM0/AS1A05_069T05_9000002420_16386cztM0_level2.evt | modeM0/AS1A05_069T05_9000002420_16386cztM0_level2_quad_clean.evt |
| Size (bytes) | 467,772,480 | 65,989,440 |
| Size | 446.1 MB | 62.9 MB |
| Events in quadrant A | 3,248,694 | 399,714 |
| Events in quadrant B | 3,699,972 | 408,487 |
| Events in quadrant C | 3,214,399 | 383,263 |
| Events in quadrant D | 3,575,155 | 366,194 |
| Mode M9 | |||
|---|---|---|---|
| Quadrant | BADHDUFLAG | Total packets | Discarded packets |
| A | 0 | 20 | 0 |
| B | 0 | 20 | 0 |
| C | 0 | 20 | 0 |
| D | 0 | 21 | 0 |
| Mode SS | |||
|---|---|---|---|
| Quadrant | BADHDUFLAG | Total packets | Discarded packets |
| A | 0 | 128 | 0 |
| B | 0 | 128 | 0 |
| C | 0 | 128 | 0 |
| D | 0 | 128 | 0 |
| Mode M0 | |||
|---|---|---|---|
| Quadrant | BADHDUFLAG | Total packets | Discarded packets |
| A | 0 | 13294 | 3 |
| B | 0 | 14820 | 2 |
| C | 0 | 13249 | 2 |
| D | 0 | 14791 | 2 |
| Quadrant | Total seconds | Saturated seconds | Saturation percentage |
|---|---|---|---|
| A | 6309 | 50 | 0.792519% |
| B | 6309 | 102 | 1.616738% |
| C | 6309 | 63 | 0.998573% |
| D | 6309 | 93 | 1.474085% |
Noise dominated data is calculated using 1-second bins in cleaned event files. If a bin has >2000 counts, and if more than 50% of those come from <1% of pixels, then it is considered to be noise-dominated and hence unusable.
| Quadrant | # 1 sec bins | Bins with >0 counts | Bins with >2000 counts | High rate bins dominated by noise | Noise dominated (total time) | Noise dominated (detector-on time) | Marked lightcurve |
|---|---|---|---|---|---|---|---|
| A | 7640 | 6311 | 1 | 1 | 0.01% | 0.02% | 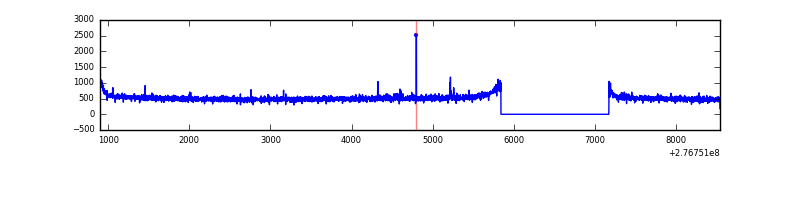 |
| B | 7640 | 6311 | 7 | 7 | 0.09% | 0.11% | 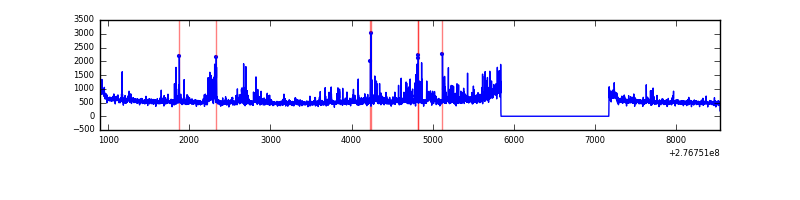 |
| C | 7640 | 6311 | 0 | 0 | 0.00% | 0.00% | 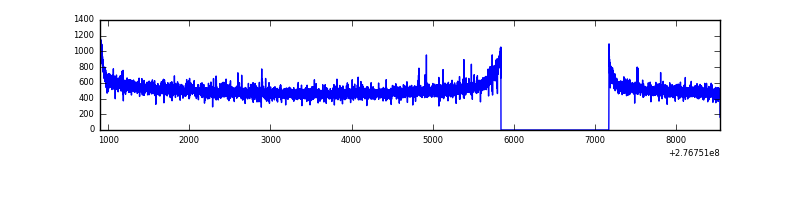 |
| D | 7640 | 6311 | 66 | 66 | 0.86% | 1.05% | 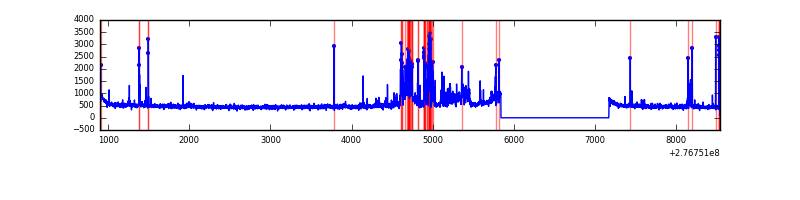 |
Top three noisy pixels from each quadrant. If the there are fewer than three noisy pixels in the level2.evt file, extra rows are filled as -1
| Pixel properties | Quadrant properties | ||||||
|---|---|---|---|---|---|---|---|
| Quadrant | DetID | PixID | Counts | Sigma | Mean | Median | Sigma |
| A | 15 | 223 | 43068 | 260.0 | 821 | 805 | 162.6 |
| A | 15 | 239 | 17642 | 103.58 | 821 | 805 | 162.6 |
| A | 9 | 143 | 17156 | 100.59 | 821 | 805 | 162.6 |
| B | 15 | 35 | 174995 | 1117.83 | 827 | 808 | 155.8 |
| B | 0 | 189 | 101891 | 648.69 | 827 | 808 | 155.8 |
| B | 0 | 244 | 49353 | 311.53 | 827 | 808 | 155.8 |
| C | 14 | 238 | 121830 | 669.45 | 780 | 786 | 180.8 |
| C | 3 | 233 | 43787 | 237.82 | 780 | 786 | 180.8 |
| C | 10 | 169 | 5854 | 28.03 | 780 | 786 | 180.8 |
| D | 10 | 70 | 315867 | 1645.32 | 783 | 760 | 191.5 |
| D | 2 | 122 | 205842 | 1070.82 | 783 | 760 | 191.5 |
| D | 12 | 218 | 57543 | 296.49 | 783 | 760 | 191.5 |
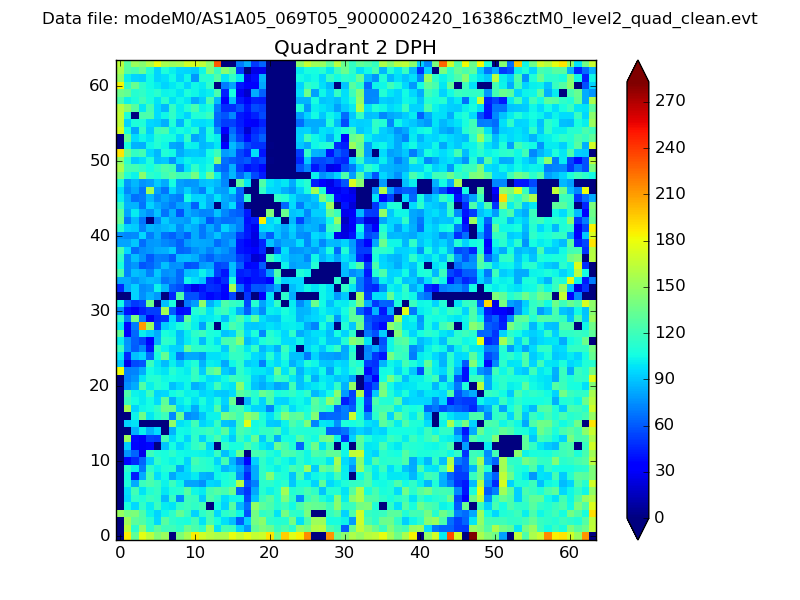
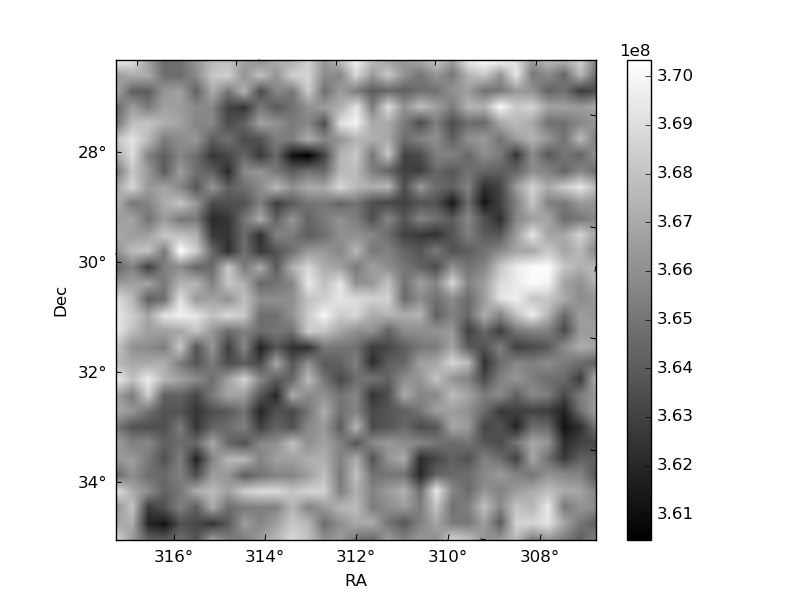
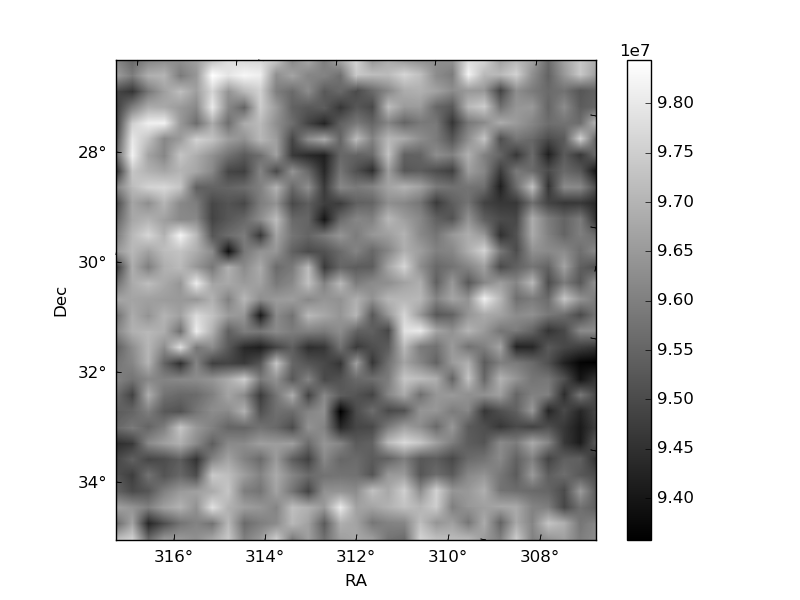
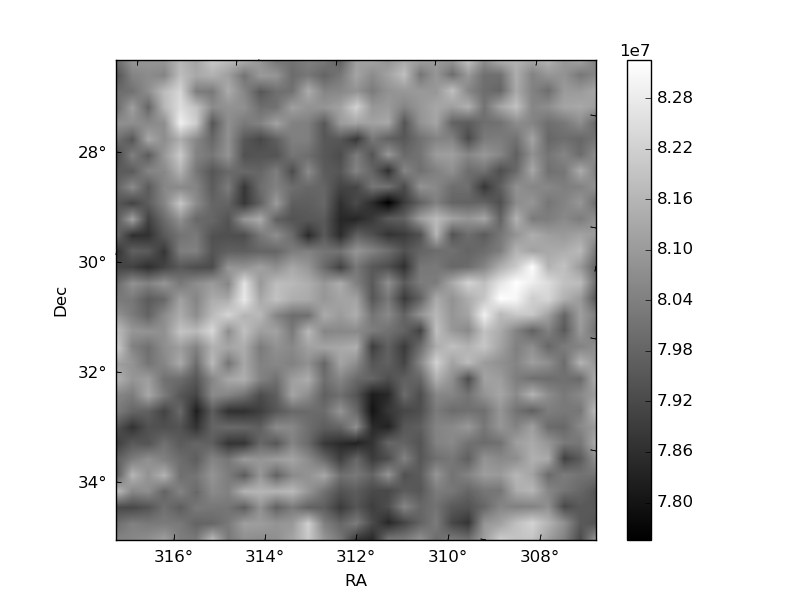
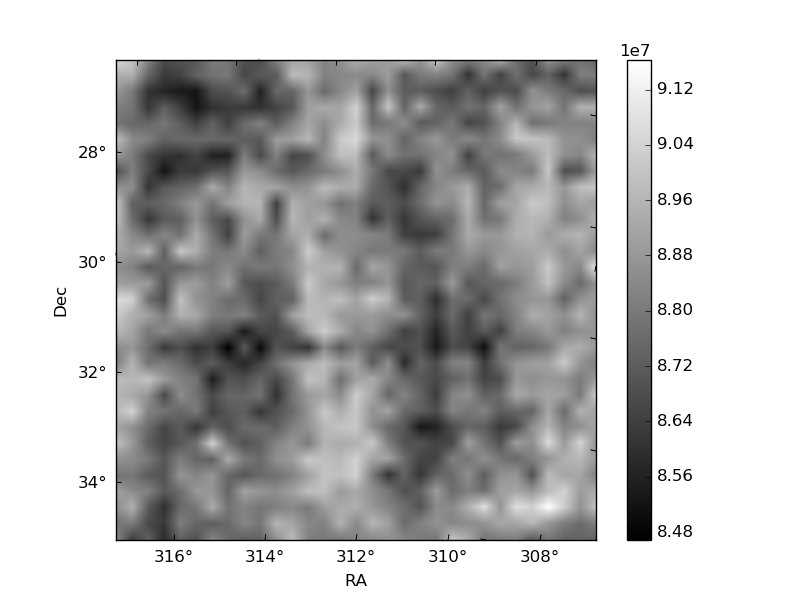
Histogram calculated using DETX and DETY for each event in the final _common_clean file
| Quadrant A | 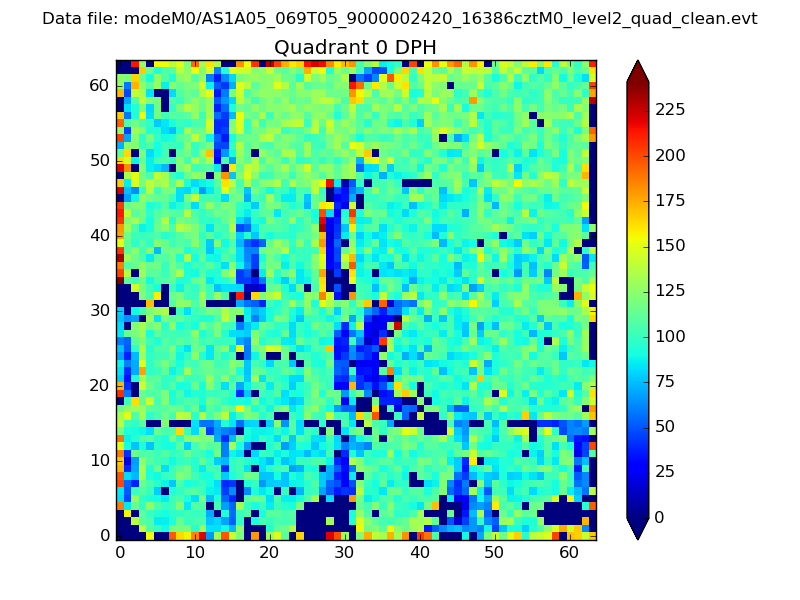 |
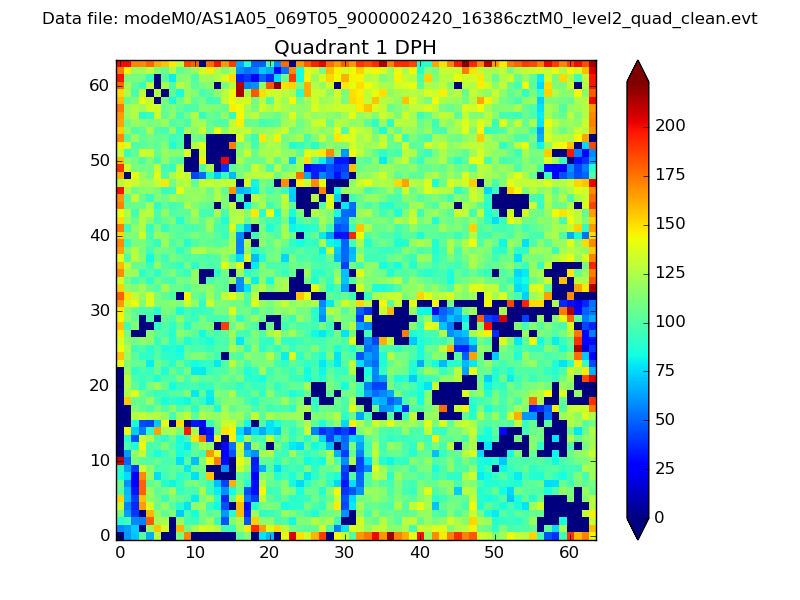 |
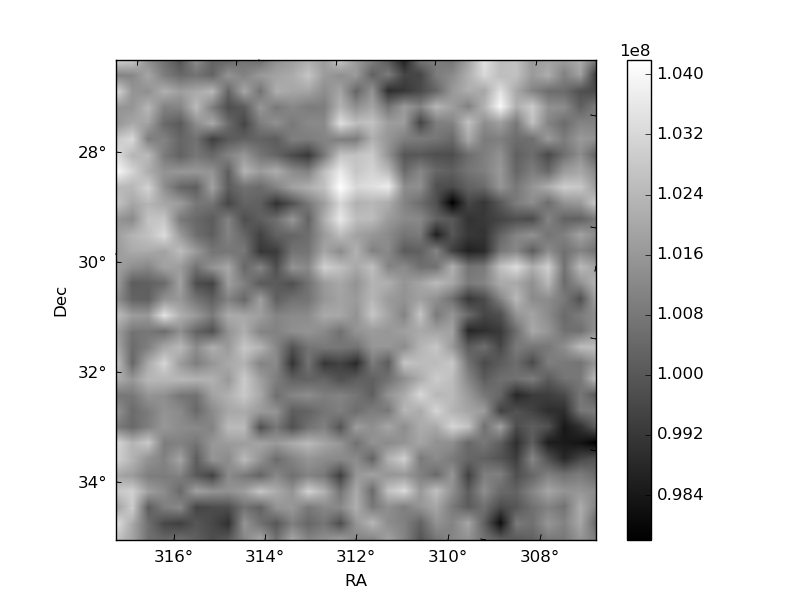
Quadrant B |
|---|---|---|---|
| Quadrant D | 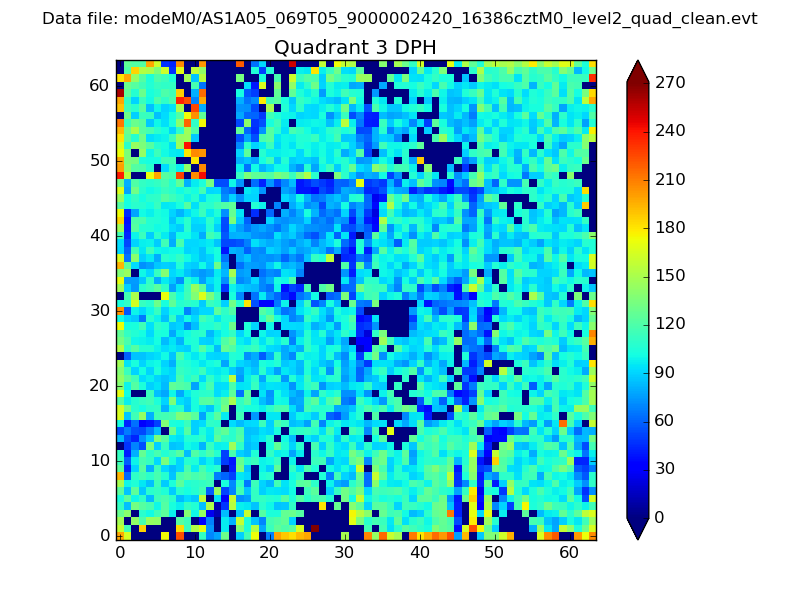 |
 |
Quadrant C |
| Plot type | Count rate plots | Images |
|---|---|---|
| Comparison with Poisson distribution Blue bars denote a histogram of data divided into 1 sec bins. Red curve is a Poisson curve with rate = median count rate of data. |
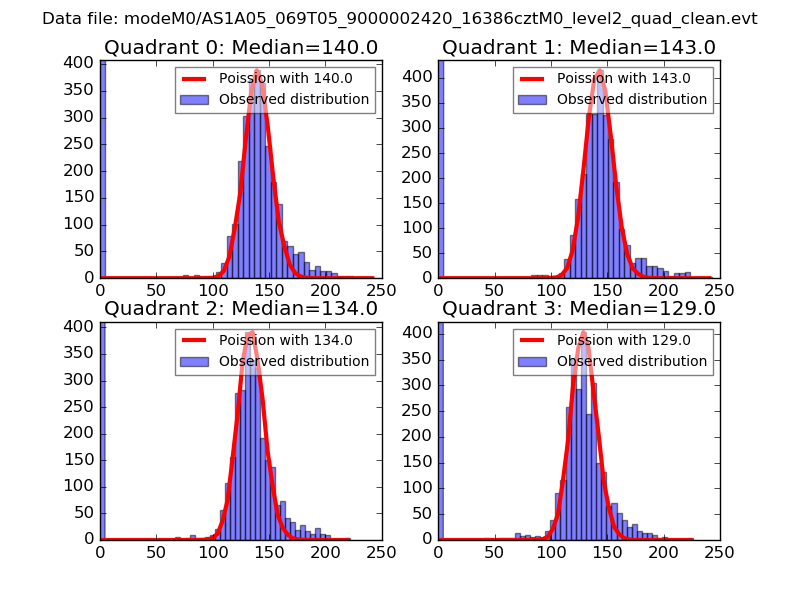 |
 |
| Quadrant-wise count rates Data is divided into 100 sec bins |
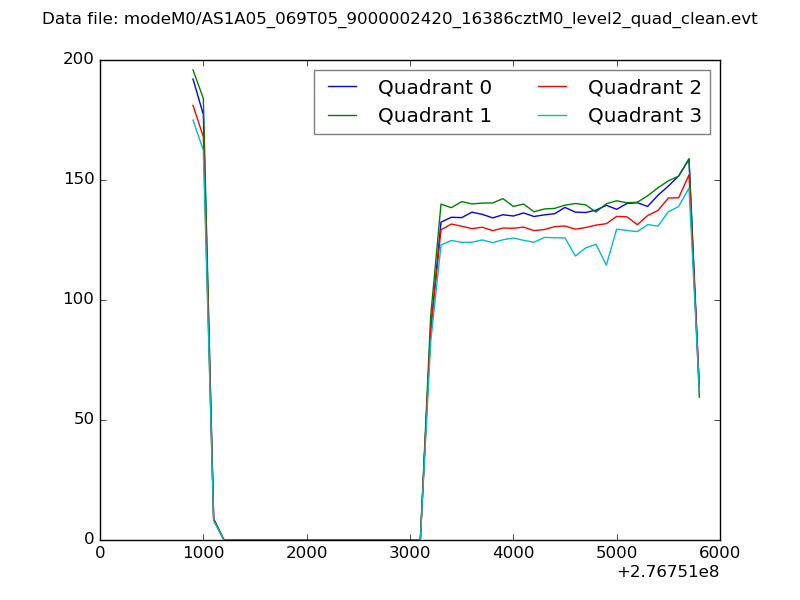 |
|
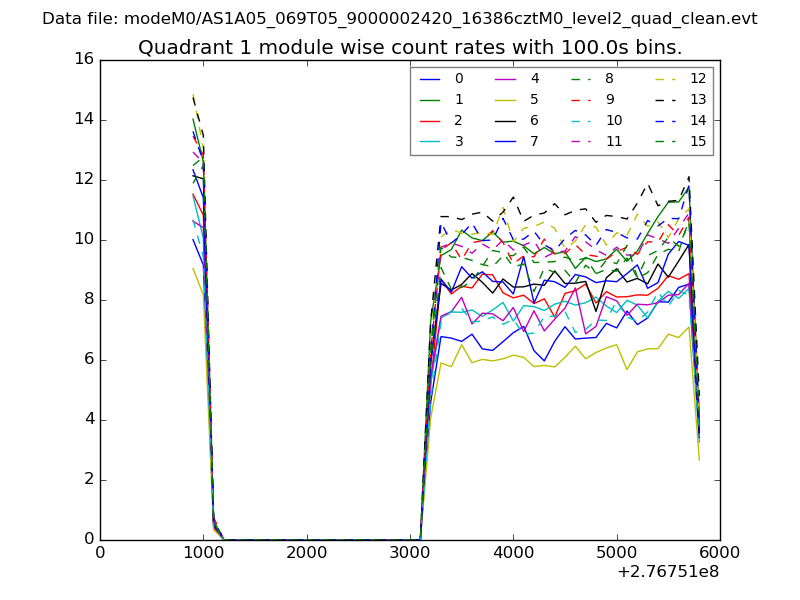
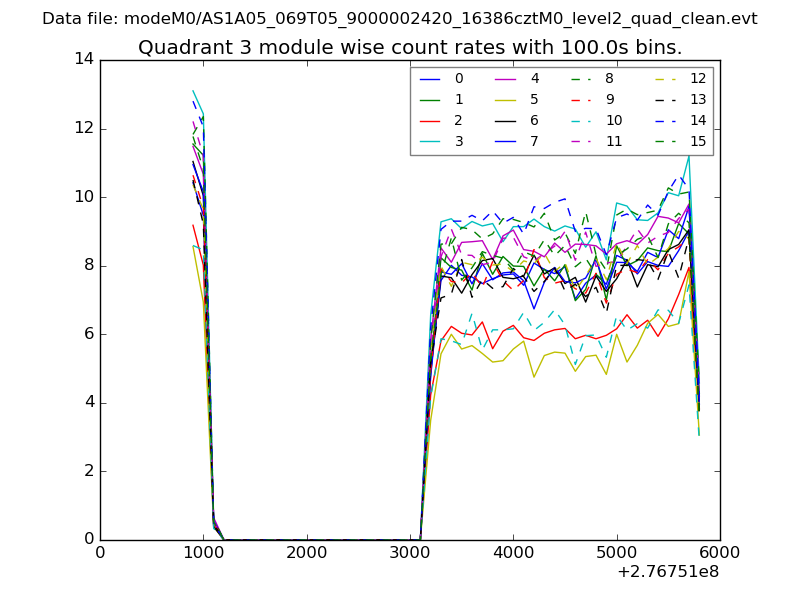
| Module-wise count rates for Quadrant A Data is divided into 100 sec bins |
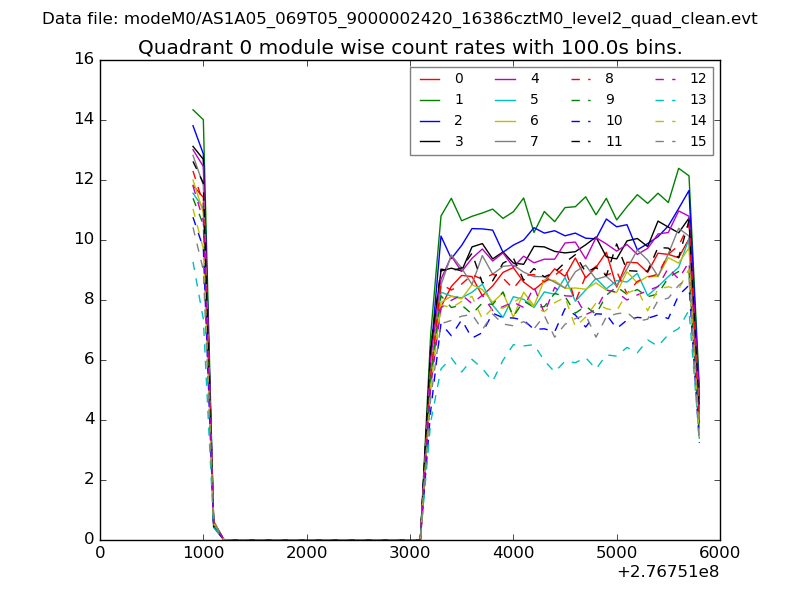 |
 |
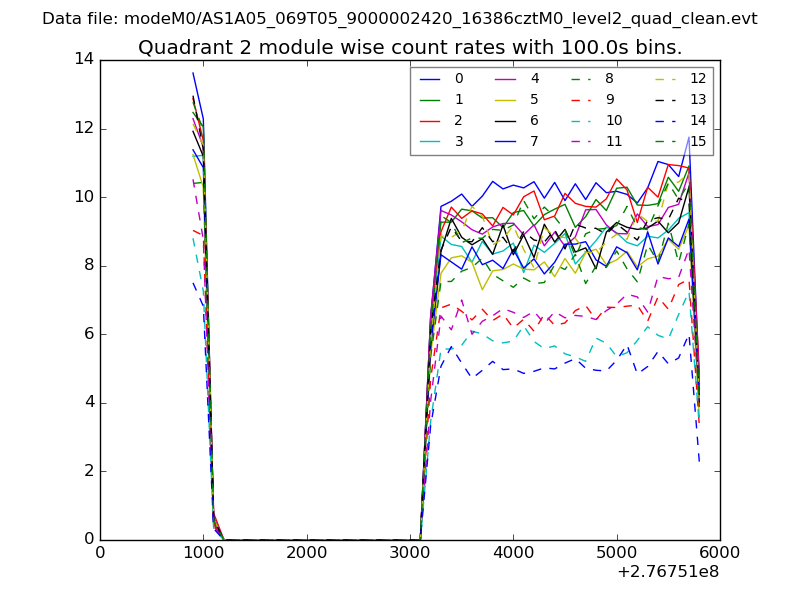
| Module-wise count rates for Quadrant B Data is divided into 100 sec bins |
 |
 |
| Module-wise count rates for Quadrant C Data is divided into 100 sec bins |
 |
 |
| Module-wise count rates for Quadrant D Data is divided into 100 sec bins |
 |
 |
| Parameter | Plot |
|---|---|
| CZT HV Monitor | 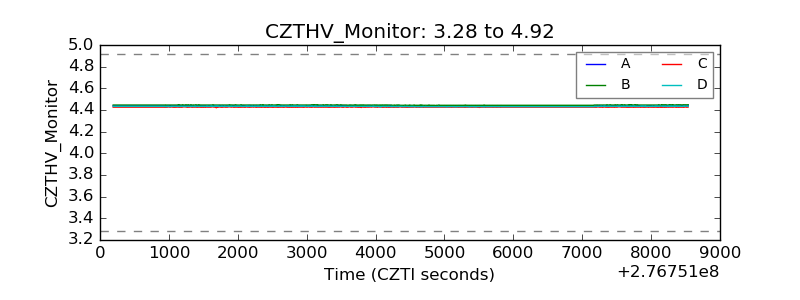 |
| D_VDD |  |
| Temperature 1 | 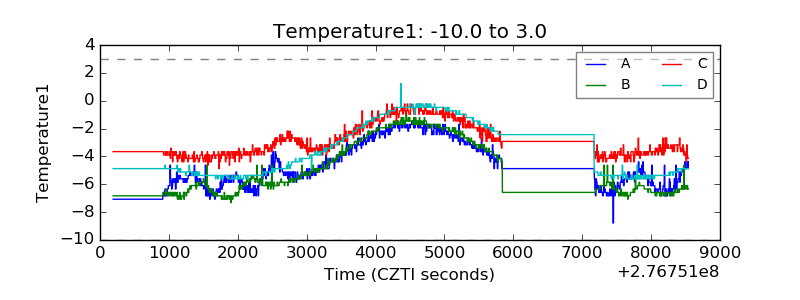 |
| Veto HV Monitor | 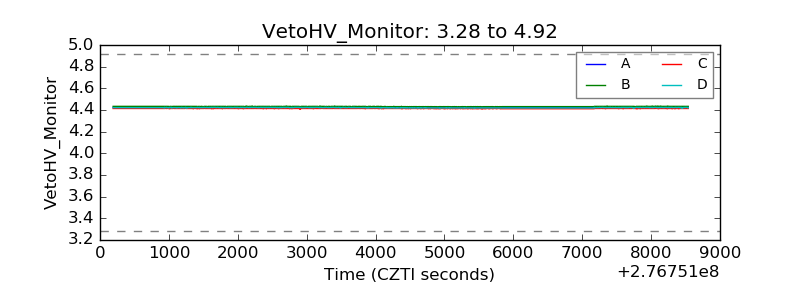 |
| Veto LLD | 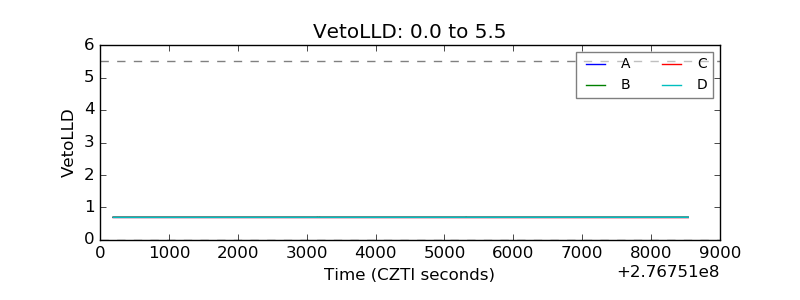 |
| Alpha Counter | 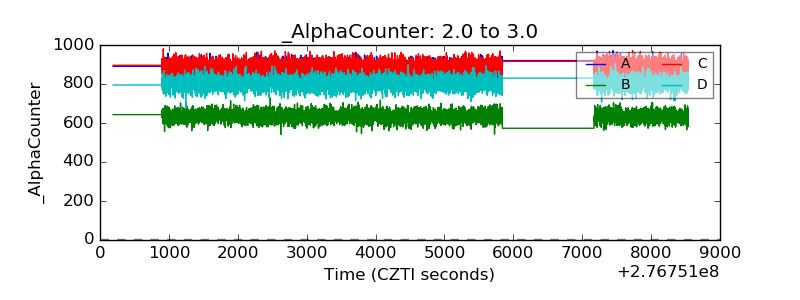 |
| _CPM_Rate | 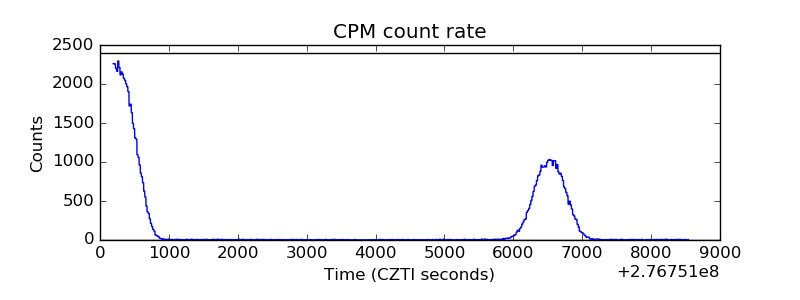 |
| CZT Counter | 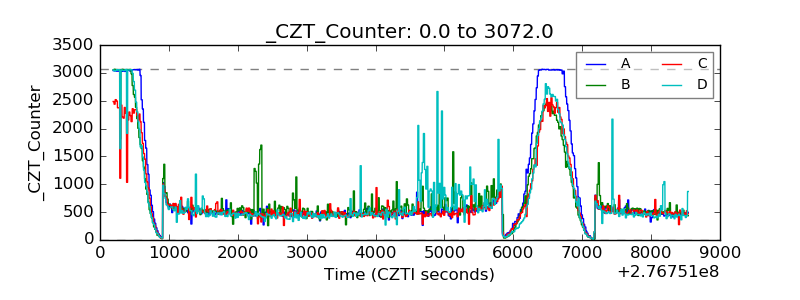 |
| +2.5 Volts monitor | 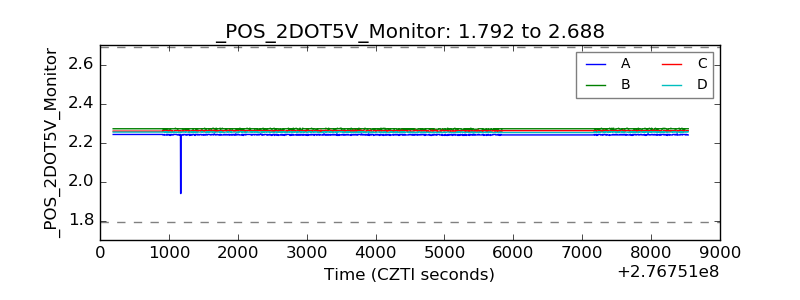 |
| +5 Volts monitor |  |
| _ROLL_ROT | 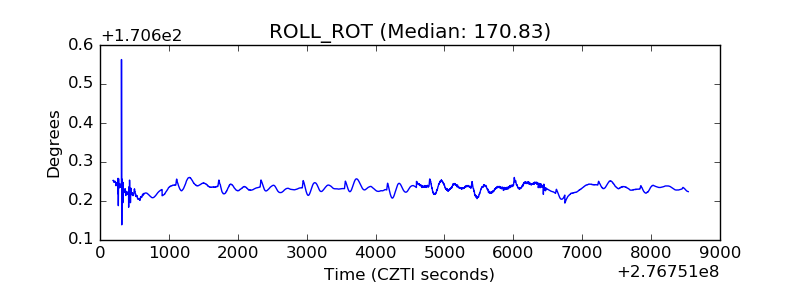 |
| _Roll_DEC | 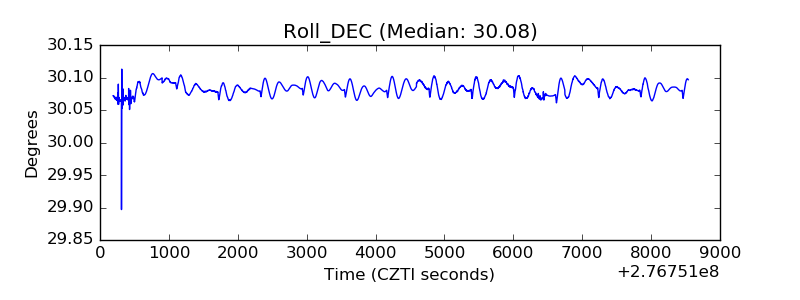 |
| _Roll_RA | 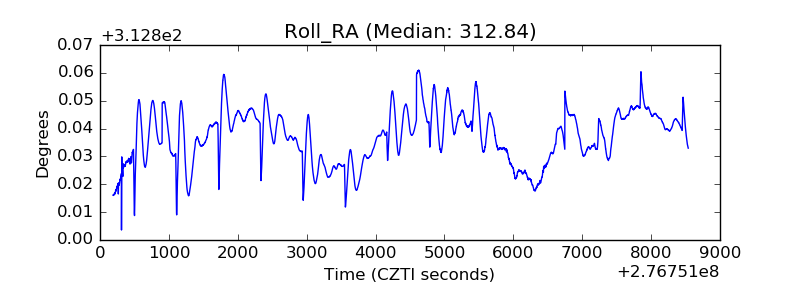 |
| Veto Counter | 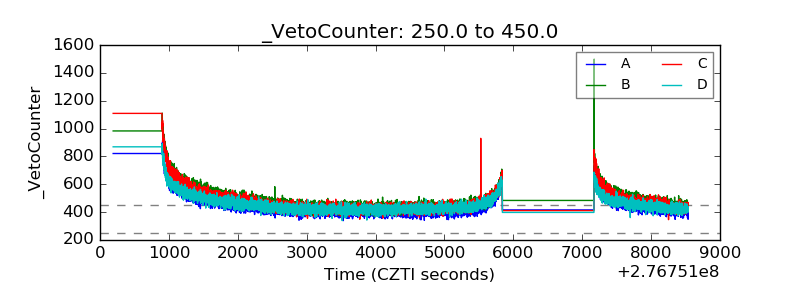 |