| Param | Original file | Final file |
|---|---|---|
| Filename | modeM0/AS1A05_069T05_9000002420_16388cztM0_level2.evt | modeM0/AS1A05_069T05_9000002420_16388cztM0_level2_quad_clean.evt |
| Size (bytes) | 584,723,520 | 100,278,720 |
| Size | 557.6 MB | 95.6 MB |
| Events in quadrant A | 4,096,127 | 631,859 |
| Events in quadrant B | 4,722,581 | 642,801 |
| Events in quadrant C | 3,985,736 | 611,625 |
| Events in quadrant D | 4,362,340 | 595,505 |
| Mode M9 | |||
|---|---|---|---|
| Quadrant | BADHDUFLAG | Total packets | Discarded packets |
| A | 0 | 16 | 0 |
| B | 0 | 16 | 0 |
| C | 0 | 16 | 0 |
| D | 0 | 16 | 0 |
| Mode SS | |||
|---|---|---|---|
| Quadrant | BADHDUFLAG | Total packets | Discarded packets |
| A | 0 | 166 | 0 |
| B | 0 | 166 | 0 |
| C | 0 | 166 | 0 |
| D | 0 | 166 | 0 |
| Mode M0 | |||
|---|---|---|---|
| Quadrant | BADHDUFLAG | Total packets | Discarded packets |
| A | 0 | 17147 | 3 |
| B | 0 | 19015 | 2 |
| C | 0 | 16753 | 2 |
| D | 0 | 18296 | 2 |
| Quadrant | Total seconds | Saturated seconds | Saturation percentage |
|---|---|---|---|
| A | 7983 | 238 | 2.981335% |
| B | 7983 | 318 | 3.983465% |
| C | 7983 | 230 | 2.881122% |
| D | 7983 | 242 | 3.031442% |
Noise dominated data is calculated using 1-second bins in cleaned event files. If a bin has >2000 counts, and if more than 50% of those come from <1% of pixels, then it is considered to be noise-dominated and hence unusable.
| Quadrant | # 1 sec bins | Bins with >0 counts | Bins with >2000 counts | High rate bins dominated by noise | Noise dominated (total time) | Noise dominated (detector-on time) | Marked lightcurve |
|---|---|---|---|---|---|---|---|
| A | 9559 | 7985 | 6 | 6 | 0.06% | 0.08% | 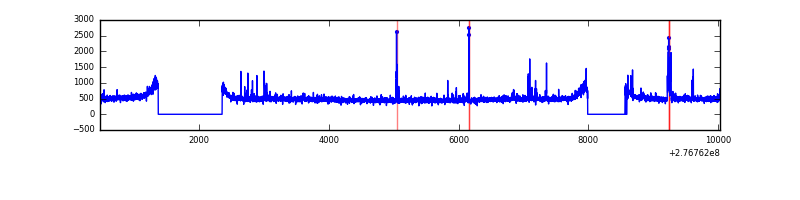 |
| B | 9559 | 7985 | 24 | 24 | 0.25% | 0.30% |  |
| C | 9559 | 7986 | 0 | 0 | 0.00% | 0.00% | 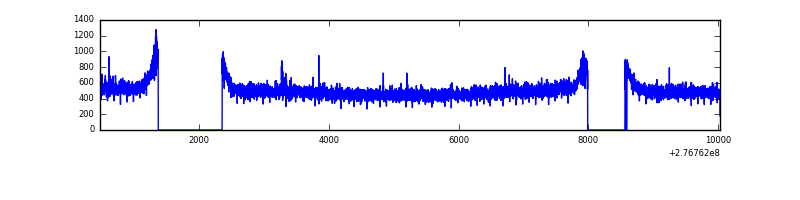 |
| D | 9559 | 7985 | 68 | 68 | 0.71% | 0.85% | 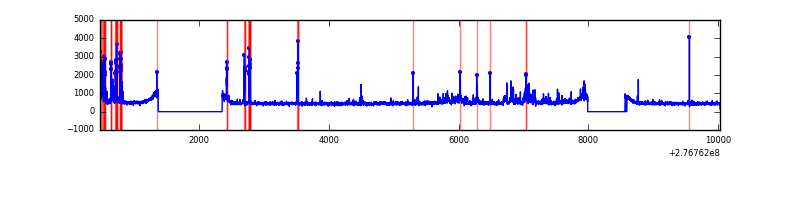 |
Top three noisy pixels from each quadrant. If the there are fewer than three noisy pixels in the level2.evt file, extra rows are filled as -1
| Pixel properties | Quadrant properties | ||||||
|---|---|---|---|---|---|---|---|
| Quadrant | DetID | PixID | Counts | Sigma | Mean | Median | Sigma |
| A | 15 | 174 | 105881 | 513.77 | 1004 | 980 | 204.2 |
| A | 9 | 143 | 72686 | 351.19 | 1004 | 980 | 204.2 |
| A | 15 | 223 | 39817 | 190.21 | 1004 | 980 | 204.2 |
| B | 15 | 35 | 293480 | 1506.64 | 1007 | 981 | 194.1 |
| B | 4 | 173 | 107921 | 550.84 | 1007 | 981 | 194.1 |
| B | 0 | 189 | 97954 | 499.5 | 1007 | 981 | 194.1 |
| C | 14 | 238 | 146627 | 643.71 | 962 | 968 | 226.3 |
| C | 3 | 233 | 67857 | 295.6 | 962 | 968 | 226.3 |
| C | 8 | 128 | 12267 | 49.93 | 962 | 968 | 226.3 |
| D | 10 | 70 | 374998 | 1576.76 | 970 | 941 | 237.2 |
| D | 2 | 122 | 216453 | 908.45 | 970 | 941 | 237.2 |
| D | 12 | 218 | 56561 | 234.45 | 970 | 941 | 237.2 |
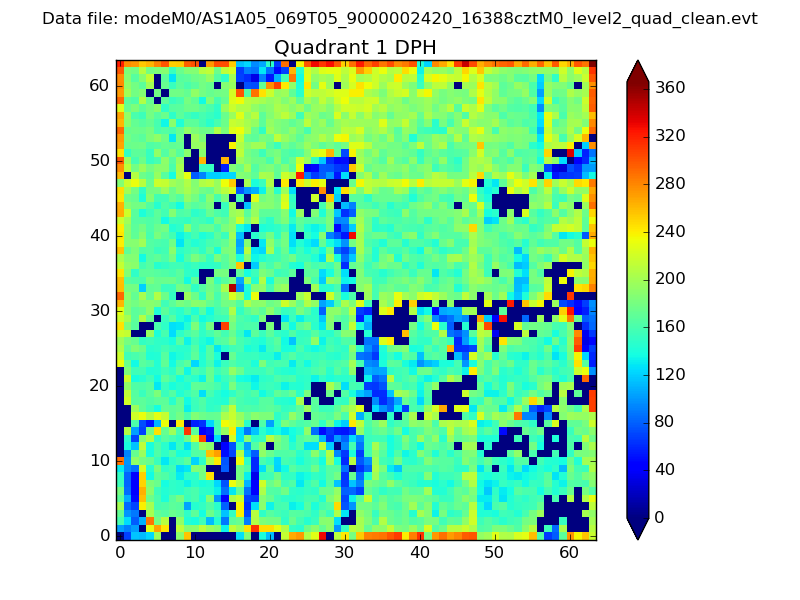
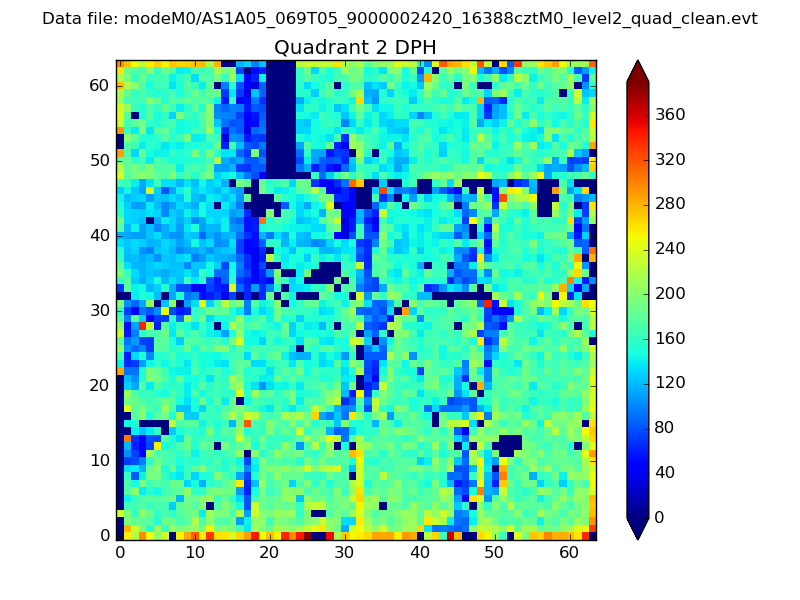
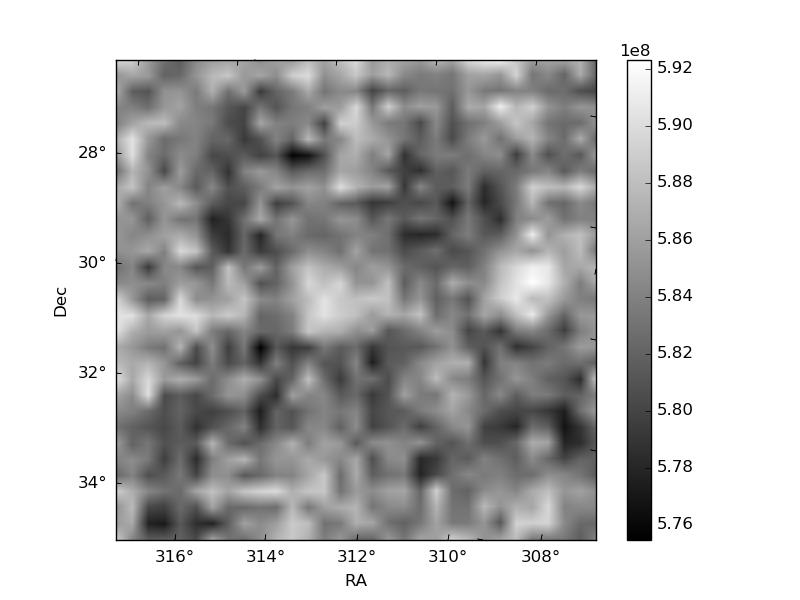
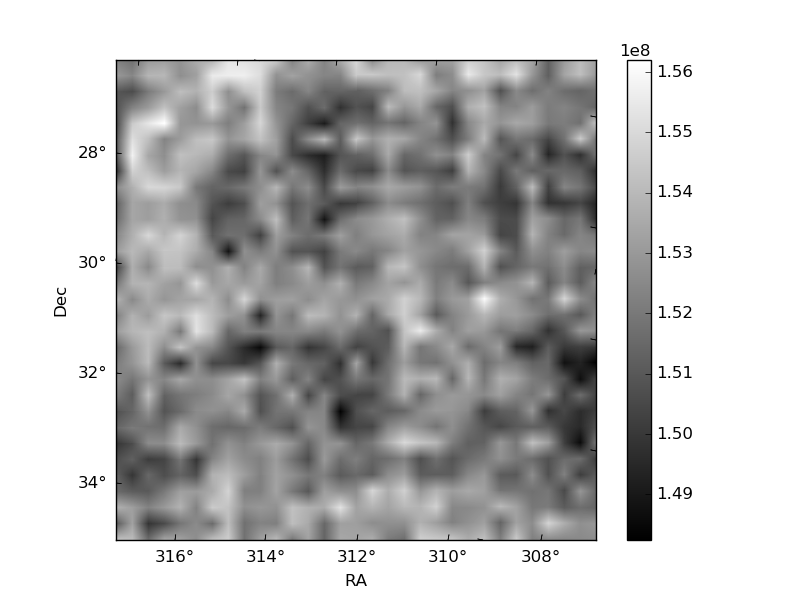
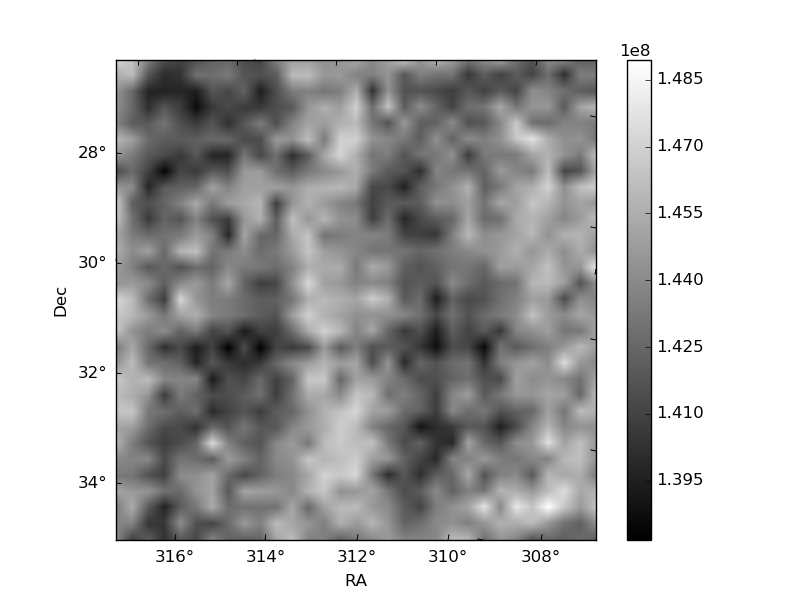
Histogram calculated using DETX and DETY for each event in the final _common_clean file
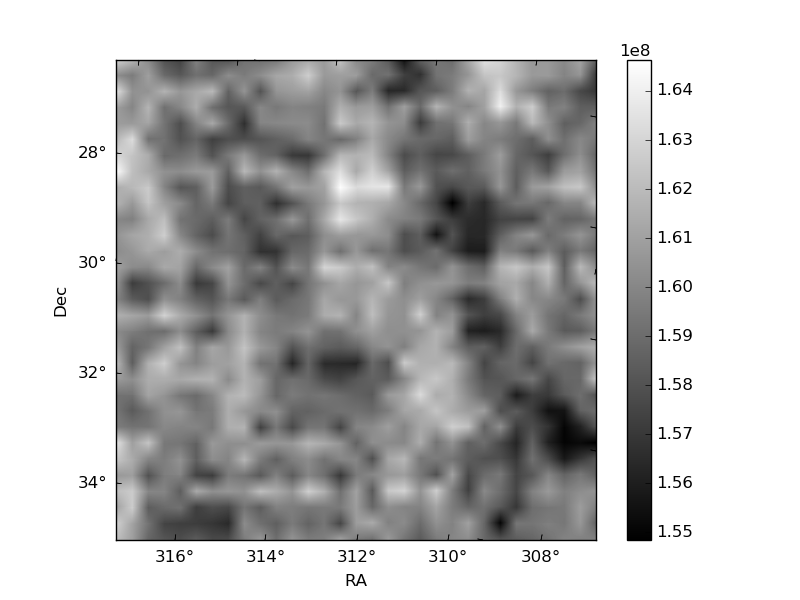
| Quadrant A | 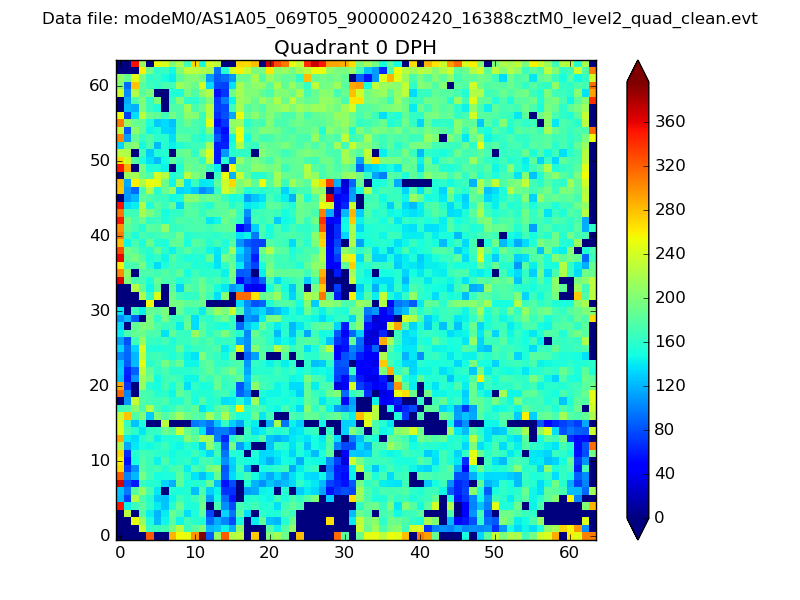 |
 |
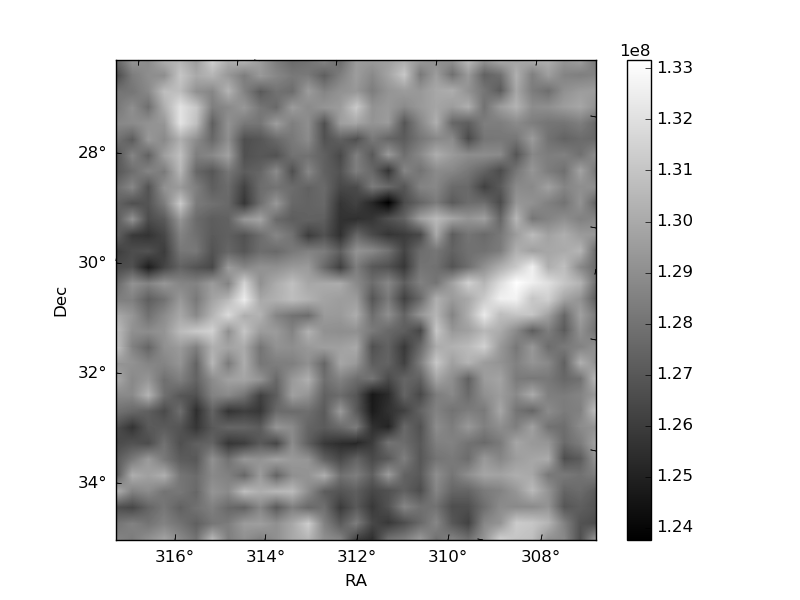
Quadrant B |
|---|---|---|---|
| Quadrant D | 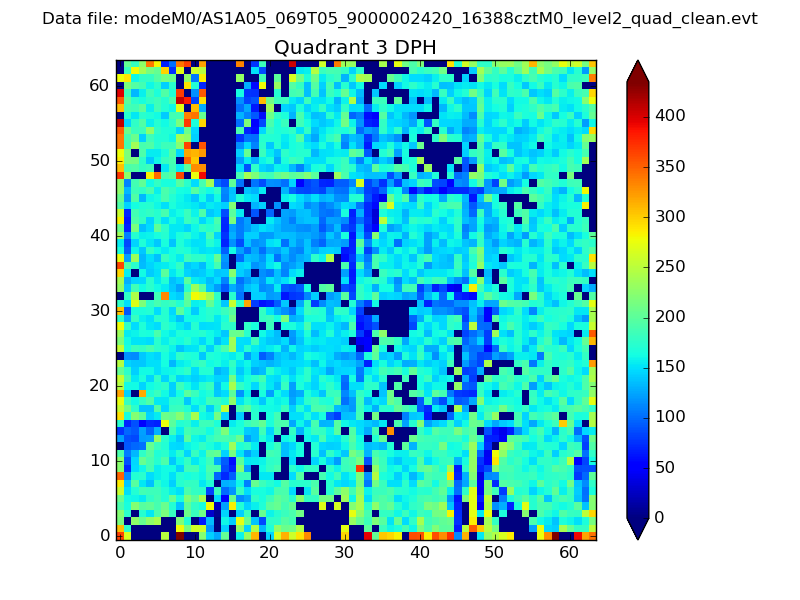 |
 |
Quadrant C |
| Plot type | Count rate plots | Images |
|---|---|---|
| Comparison with Poisson distribution Blue bars denote a histogram of data divided into 1 sec bins. Red curve is a Poisson curve with rate = median count rate of data. |
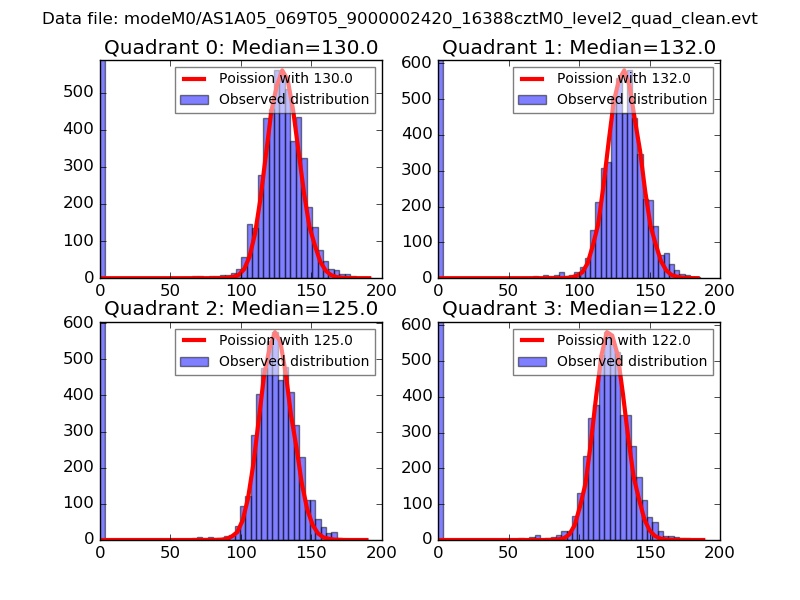 |
 |
| Quadrant-wise count rates Data is divided into 100 sec bins |
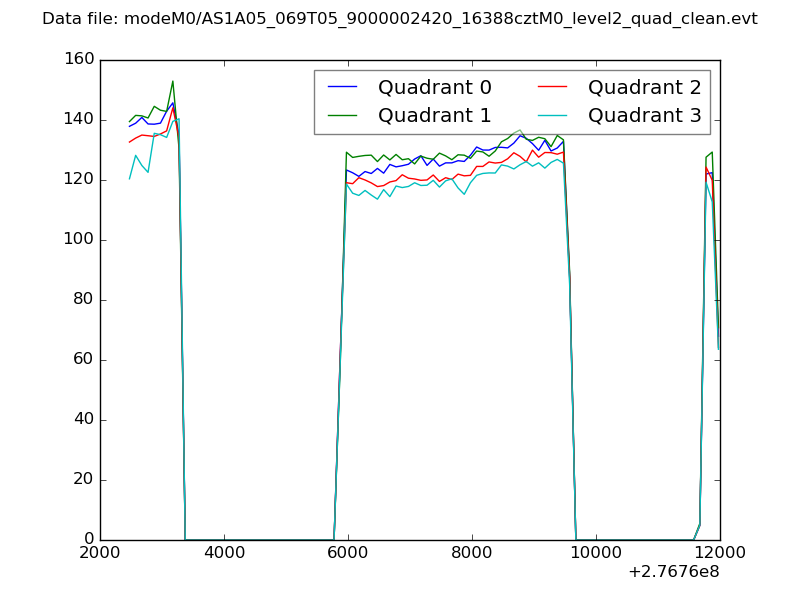 |
|
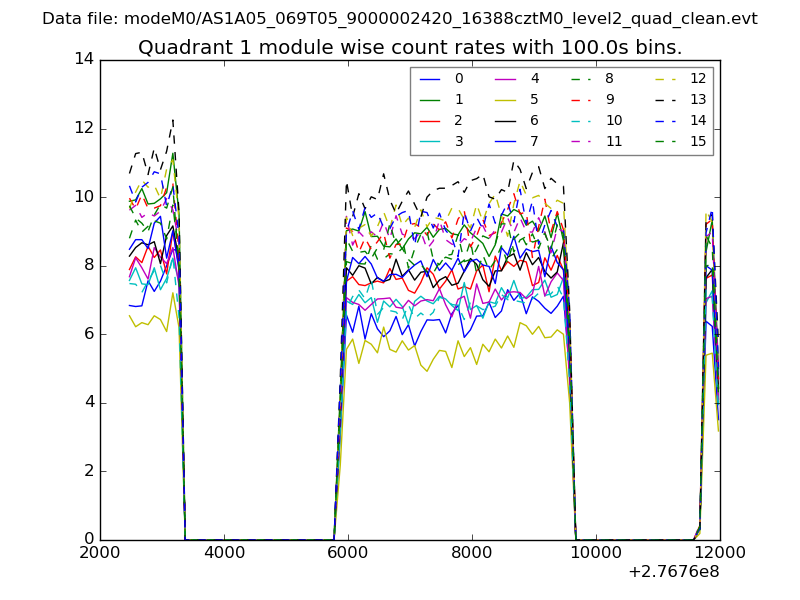
| Module-wise count rates for Quadrant A Data is divided into 100 sec bins |
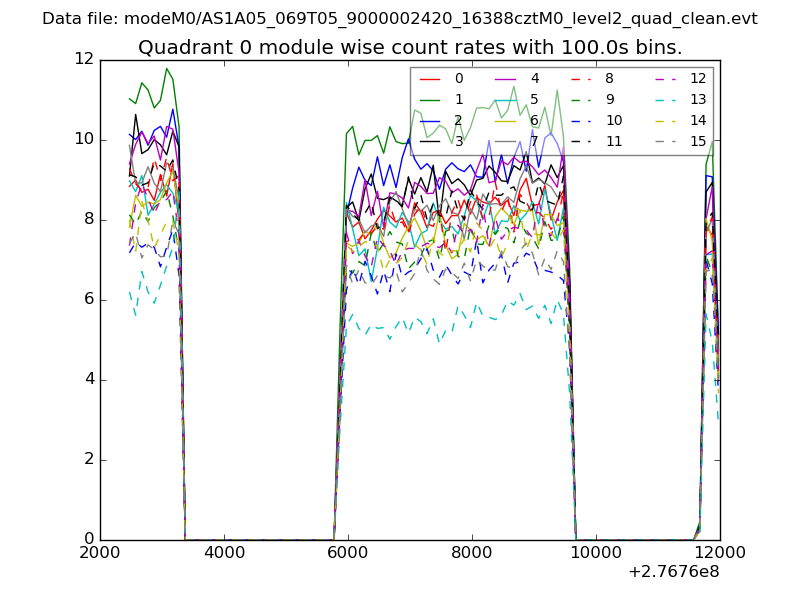 |
 |
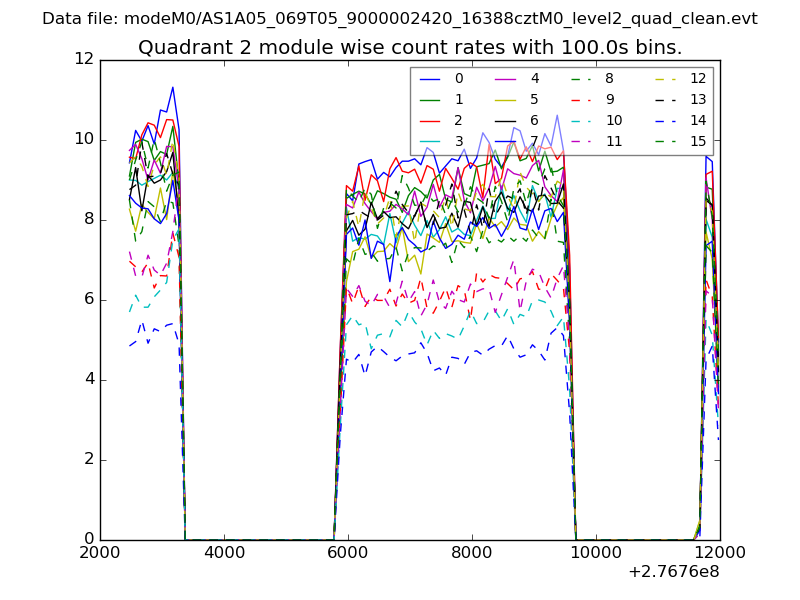
| Module-wise count rates for Quadrant B Data is divided into 100 sec bins |
 |
 |
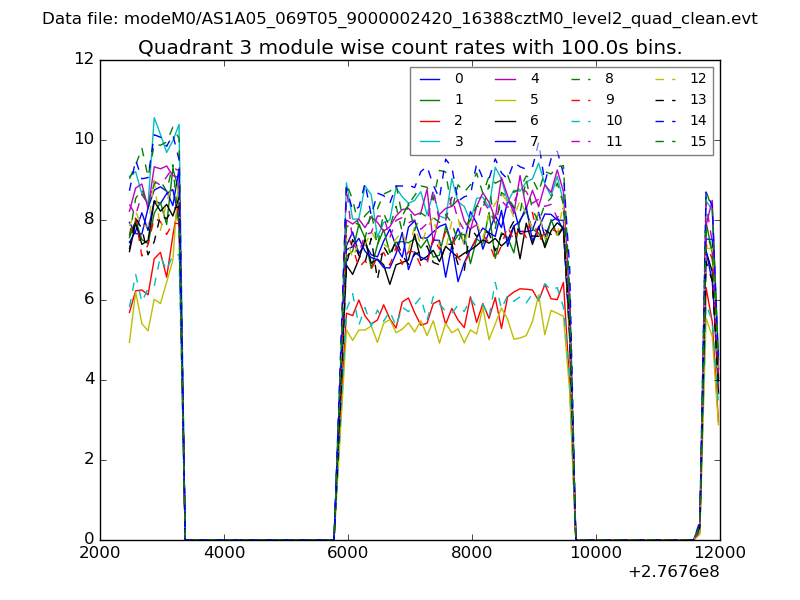
| Module-wise count rates for Quadrant C Data is divided into 100 sec bins |
 |
 |
| Module-wise count rates for Quadrant D Data is divided into 100 sec bins |
 |
 |
| Parameter | Plot |
|---|---|
| CZT HV Monitor | 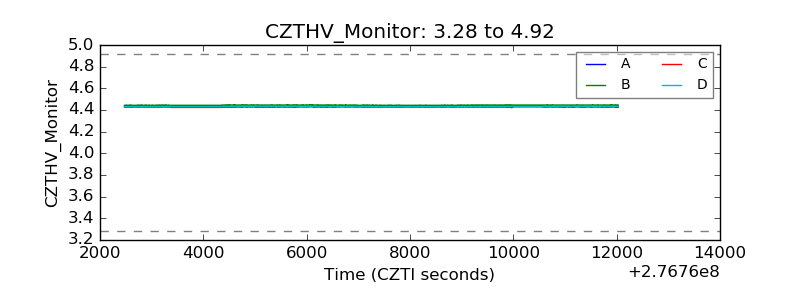 |
| D_VDD | 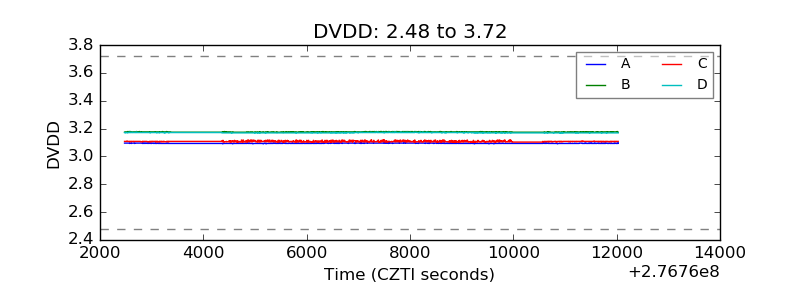 |
| Temperature 1 | 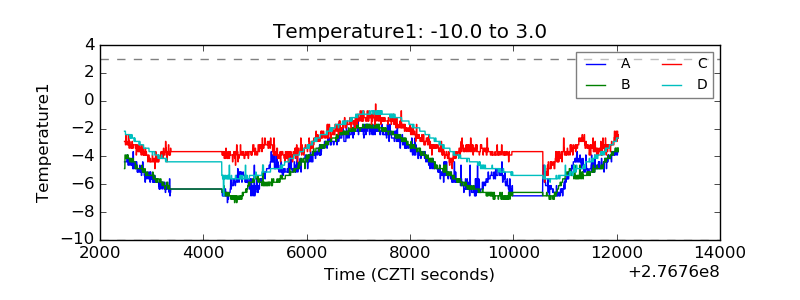 |
| Veto HV Monitor | 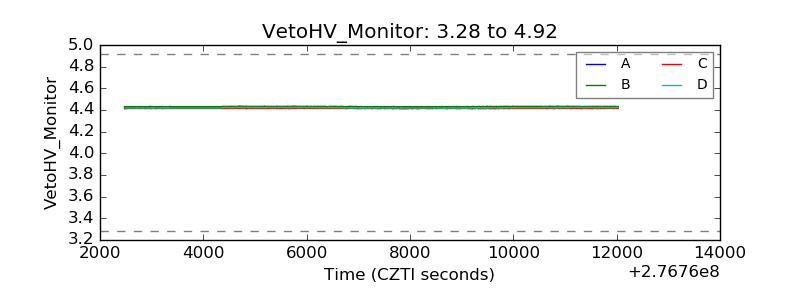 |
| Veto LLD | 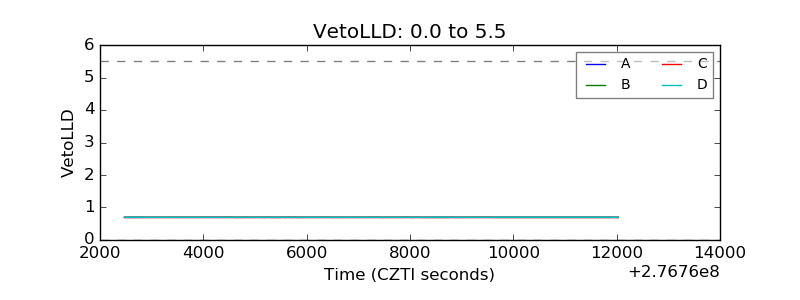 |
| Alpha Counter | 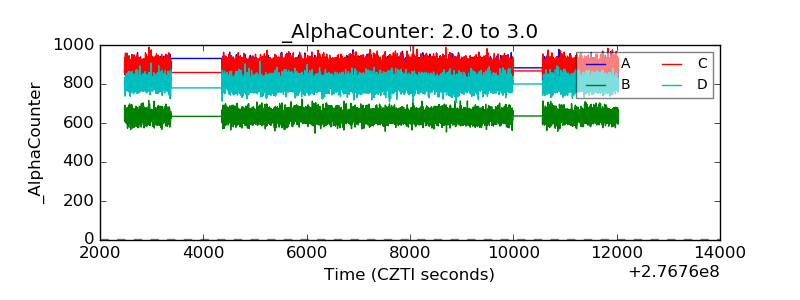 |
| _CPM_Rate | 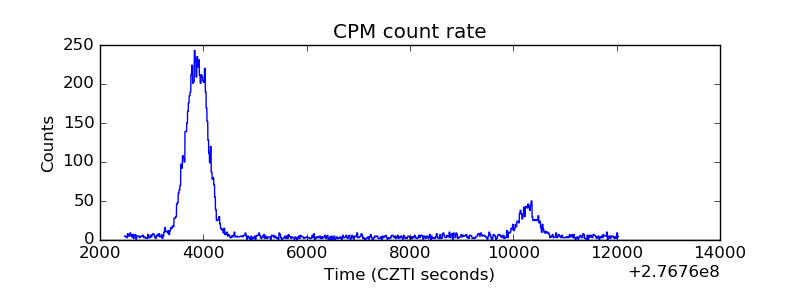 |
| CZT Counter | 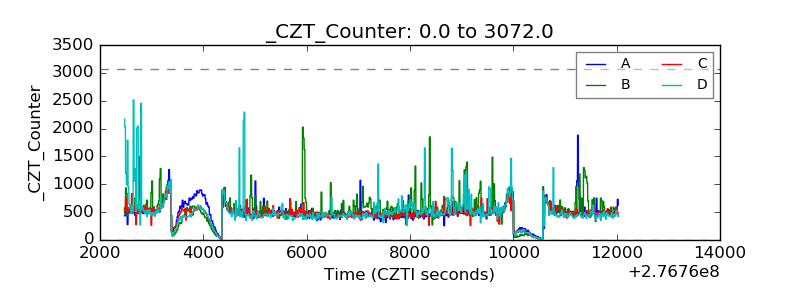 |
| +2.5 Volts monitor |  |
| +5 Volts monitor |  |
| _ROLL_ROT | 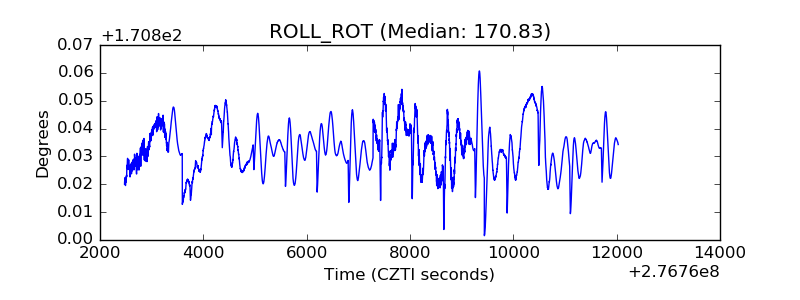 |
| _Roll_DEC |  |
| _Roll_RA | 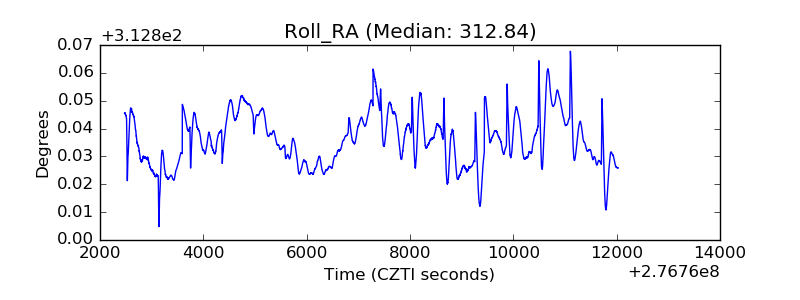 |
| Veto Counter | 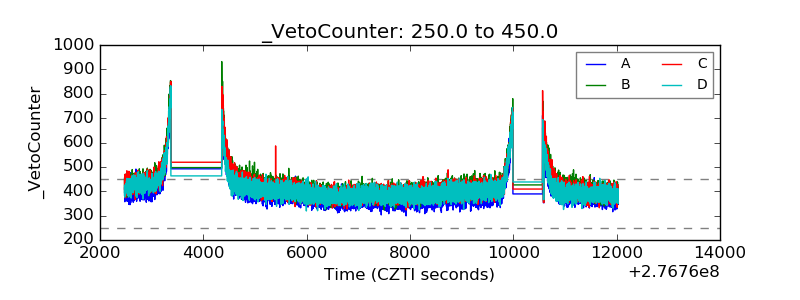 |