| Param | Original file | Final file |
|---|---|---|
| Filename | modeM0/AS1A05_069T05_9000002420_16390cztM0_level2.evt | modeM0/AS1A05_069T05_9000002420_16390cztM0_level2_quad_clean.evt |
| Size (bytes) | 509,088,960 | 95,342,400 |
| Size | 485.5 MB | 90.9 MB |
| Events in quadrant A | 3,635,684 | 607,060 |
| Events in quadrant B | 3,939,131 | 616,136 |
| Events in quadrant C | 3,579,131 | 586,657 |
| Events in quadrant D | 3,769,956 | 571,373 |
| Mode M9 | |||
|---|---|---|---|
| Quadrant | BADHDUFLAG | Total packets | Discarded packets |
| A | 0 | 1 | 0 |
| B | 0 | 1 | 0 |
| C | 0 | 1 | 0 |
| D | 0 | 1 | 0 |
| Mode SS | |||
|---|---|---|---|
| Quadrant | BADHDUFLAG | Total packets | Discarded packets |
| A | 0 | 148 | 0 |
| B | 0 | 148 | 0 |
| C | 0 | 148 | 0 |
| D | 0 | 148 | 0 |
| Mode M0 | |||
|---|---|---|---|
| Quadrant | BADHDUFLAG | Total packets | Discarded packets |
| A | 0 | 15497 | 2 |
| B | 0 | 16130 | 1 |
| C | 0 | 15137 | 1 |
| D | 0 | 16137 | 1 |
| Quadrant | Total seconds | Saturated seconds | Saturation percentage |
|---|---|---|---|
| A | 7269 | 223 | 3.067822% |
| B | 7269 | 243 | 3.342963% |
| C | 7269 | 216 | 2.971523% |
| D | 7269 | 207 | 2.847709% |
Noise dominated data is calculated using 1-second bins in cleaned event files. If a bin has >2000 counts, and if more than 50% of those come from <1% of pixels, then it is considered to be noise-dominated and hence unusable.
| Quadrant | # 1 sec bins | Bins with >0 counts | Bins with >2000 counts | High rate bins dominated by noise | Noise dominated (total time) | Noise dominated (detector-on time) | Marked lightcurve |
|---|---|---|---|---|---|---|---|
| A | 7385 | 7271 | 3 | 3 | 0.04% | 0.04% |  |
| B | 7385 | 7271 | 19 | 19 | 0.26% | 0.26% | 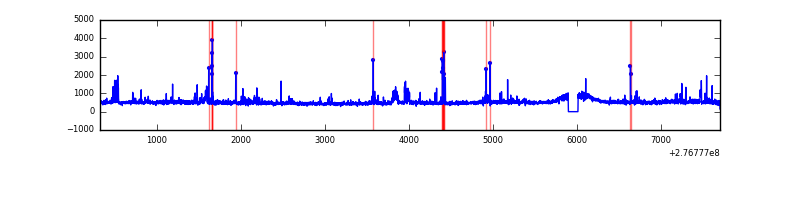 |
| C | 7385 | 7271 | 0 | 0 | 0.00% | 0.00% | 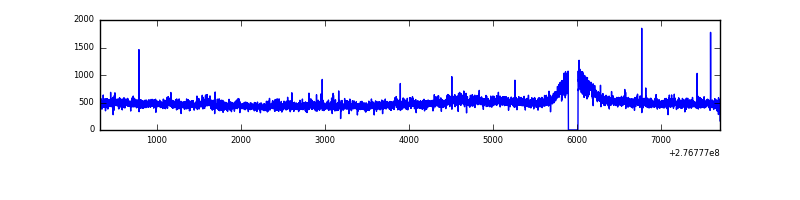 |
| D | 7385 | 7271 | 36 | 36 | 0.49% | 0.50% | 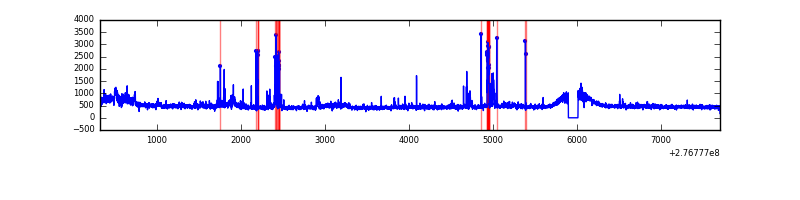 |
Top three noisy pixels from each quadrant. If the there are fewer than three noisy pixels in the level2.evt file, extra rows are filled as -1
| Pixel properties | Quadrant properties | ||||||
|---|---|---|---|---|---|---|---|
| Quadrant | DetID | PixID | Counts | Sigma | Mean | Median | Sigma |
| A | 15 | 174 | 96720 | 528.41 | 887 | 867 | 181.4 |
| A | 9 | 143 | 67204 | 365.7 | 887 | 867 | 181.4 |
| A | 15 | 223 | 47836 | 258.93 | 887 | 867 | 181.4 |
| B | 15 | 35 | 115156 | 659.5 | 886 | 862 | 173.3 |
| B | 4 | 48 | 69479 | 395.93 | 886 | 862 | 173.3 |
| B | 0 | 198 | 63100 | 359.13 | 886 | 862 | 173.3 |
| C | 14 | 238 | 129456 | 644.9 | 849 | 855 | 199.4 |
| C | 3 | 233 | 115540 | 575.11 | 849 | 855 | 199.4 |
| C | 10 | 169 | 12691 | 59.35 | 849 | 855 | 199.4 |
| D | 2 | 122 | 258929 | 1214.37 | 862 | 835 | 212.5 |
| D | 12 | 218 | 198404 | 929.59 | 862 | 835 | 212.5 |
| D | 2 | 234 | 30732 | 140.67 | 862 | 835 | 212.5 |
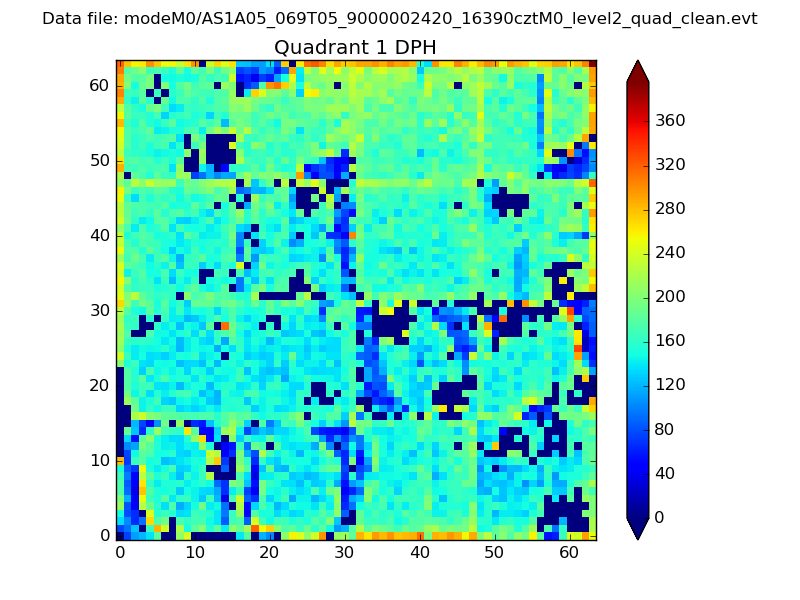
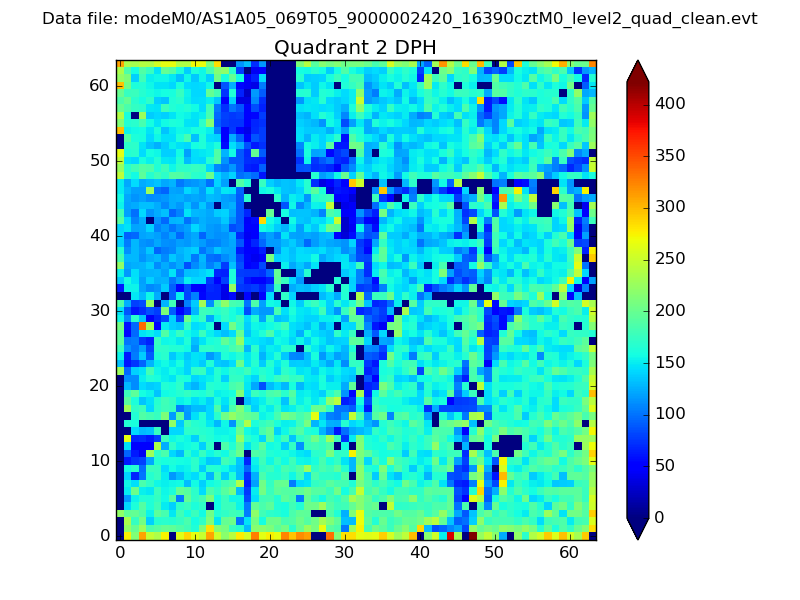
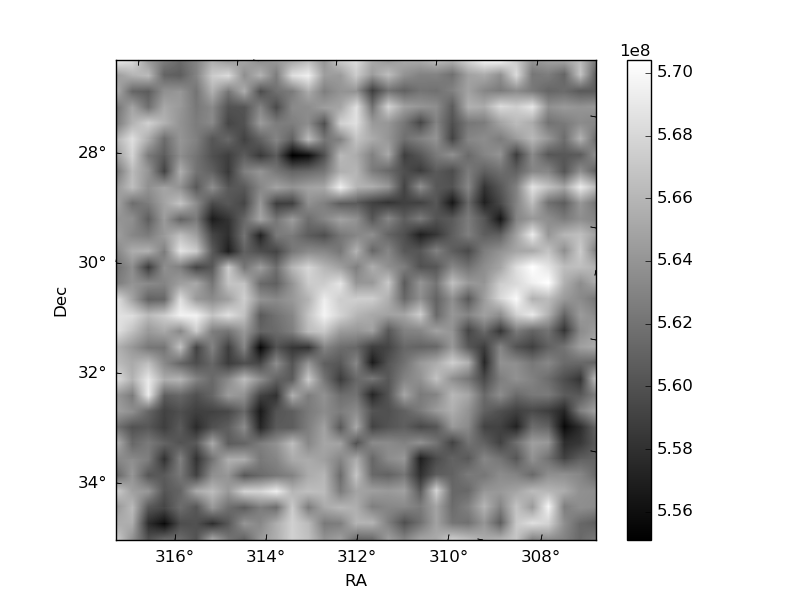
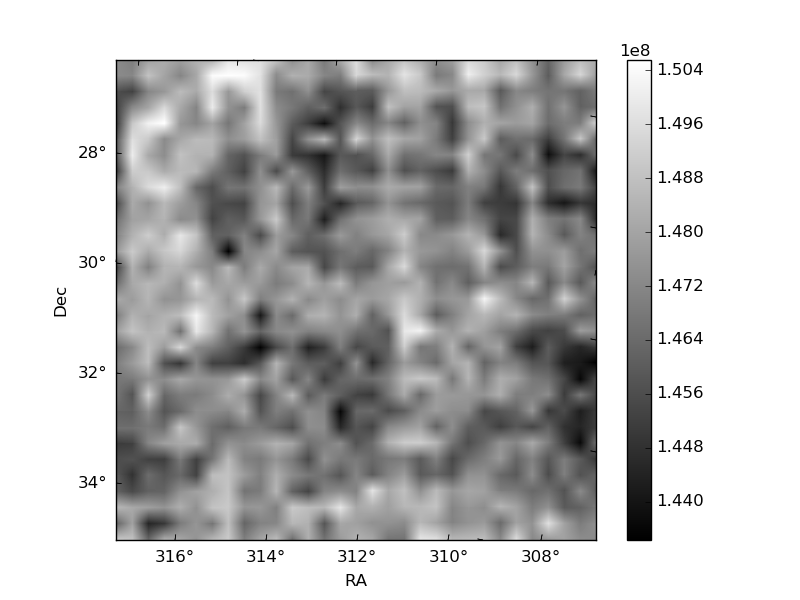
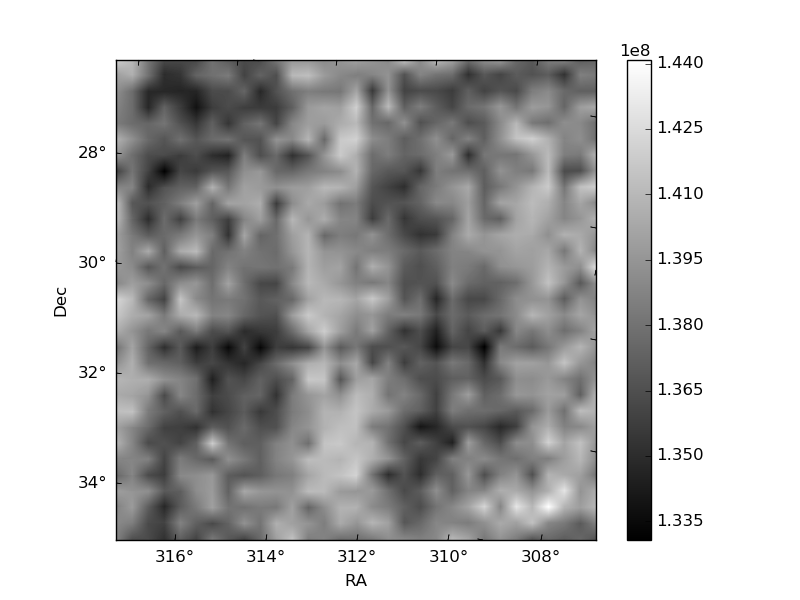
Histogram calculated using DETX and DETY for each event in the final _common_clean file
| Quadrant A | 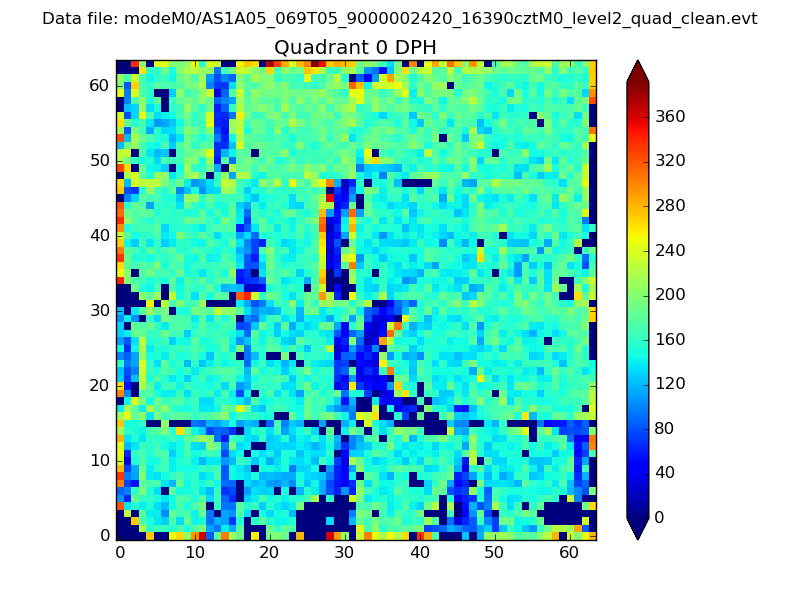 |
 |
Quadrant B |
|---|---|---|---|
| Quadrant D | 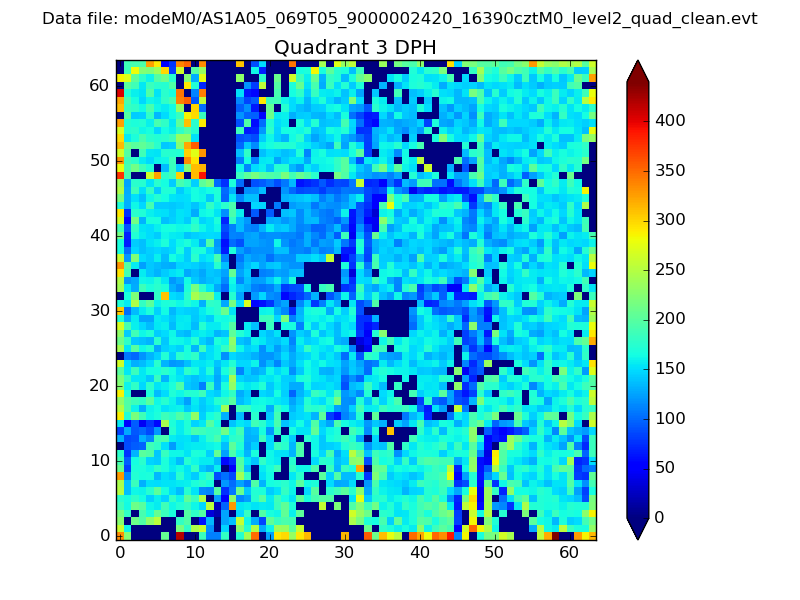 |
 |
Quadrant C |
| Plot type | Count rate plots | Images |
|---|---|---|
| Comparison with Poisson distribution Blue bars denote a histogram of data divided into 1 sec bins. Red curve is a Poisson curve with rate = median count rate of data. |
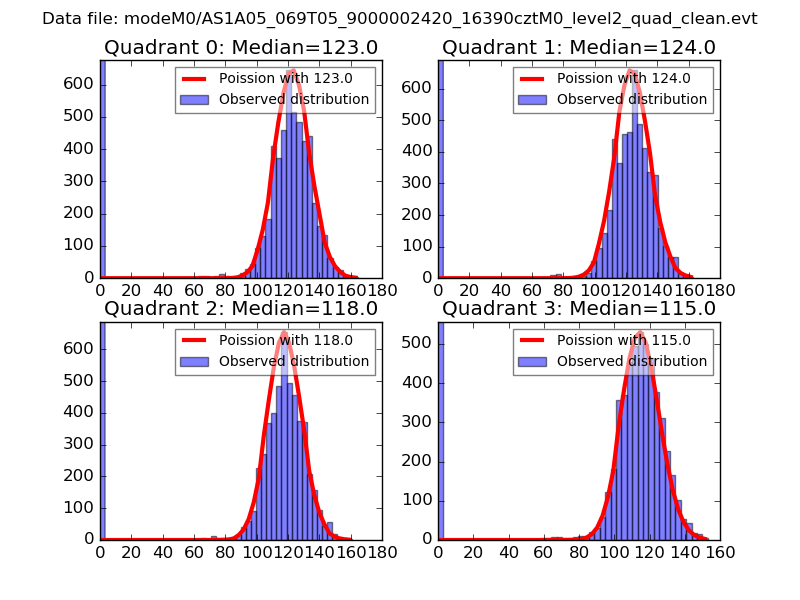 |
 |
| Quadrant-wise count rates Data is divided into 100 sec bins |
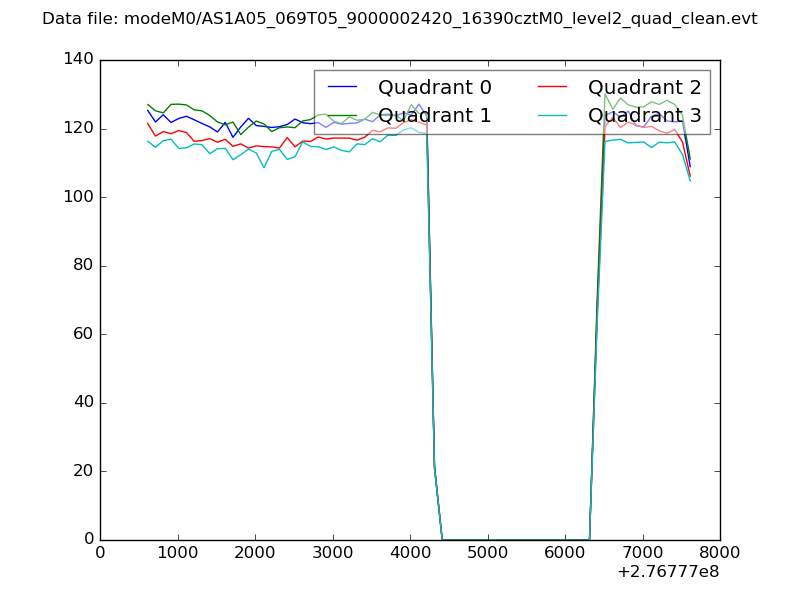 |
|
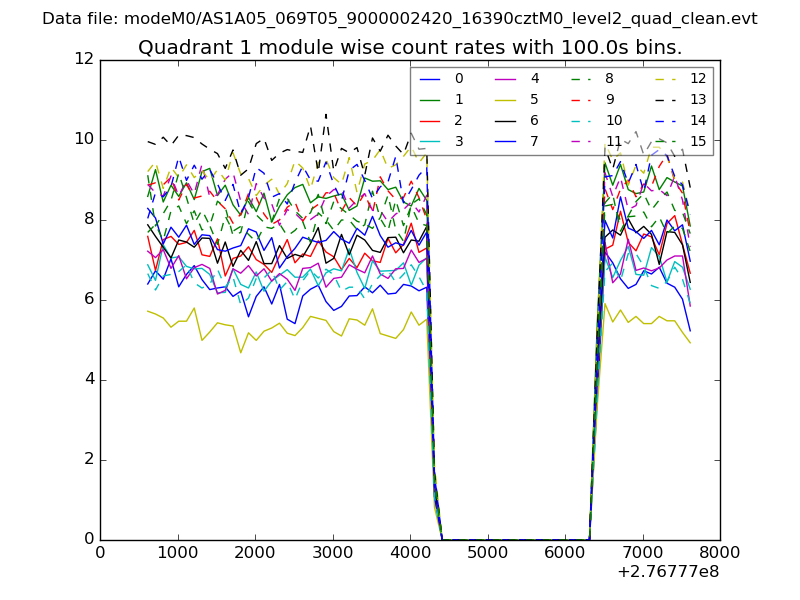
| Module-wise count rates for Quadrant A Data is divided into 100 sec bins |
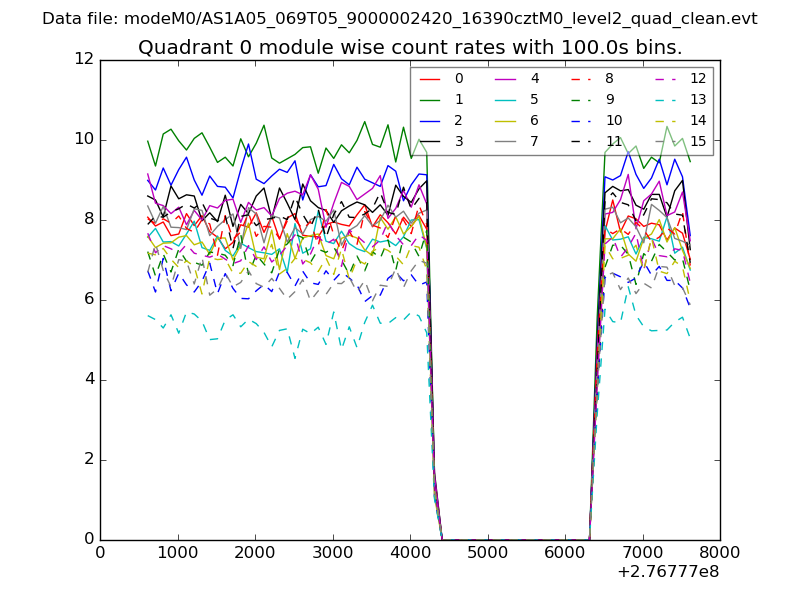 |
 |
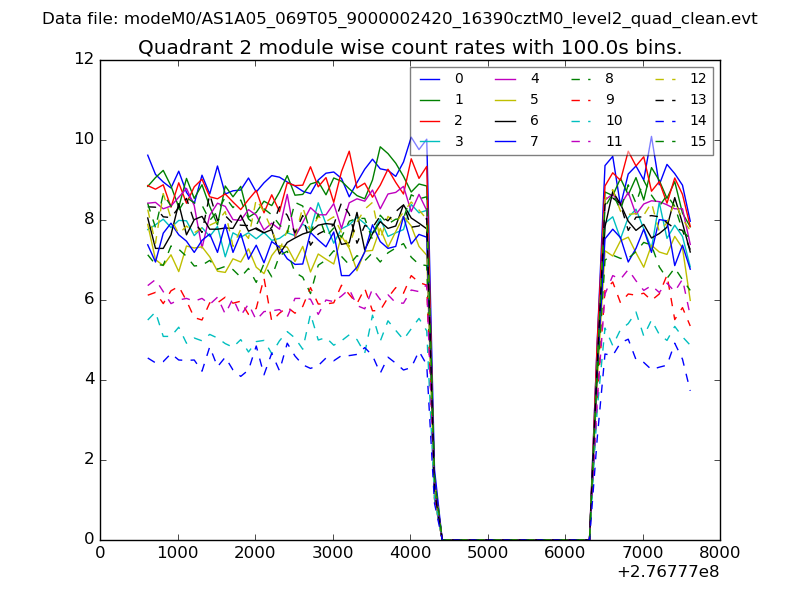
| Module-wise count rates for Quadrant B Data is divided into 100 sec bins |
 |
 |
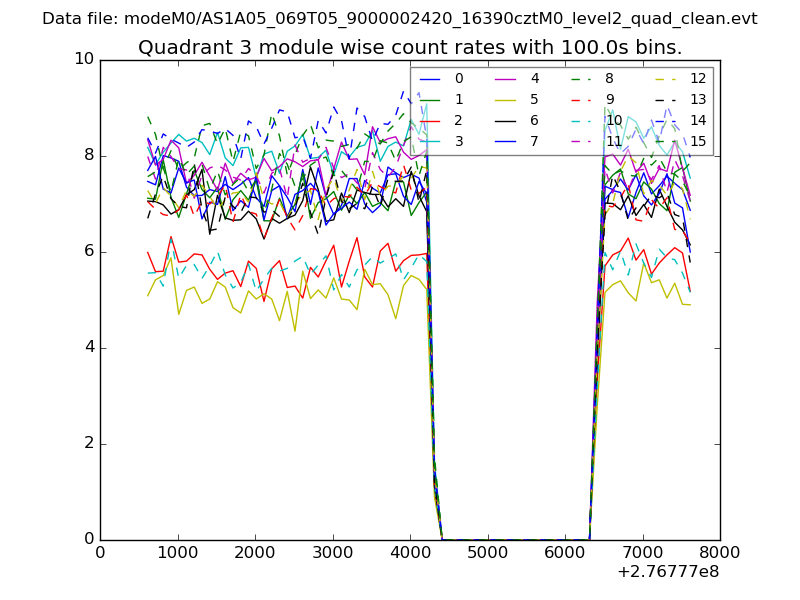
| Module-wise count rates for Quadrant C Data is divided into 100 sec bins |
 |
 |
| Module-wise count rates for Quadrant D Data is divided into 100 sec bins |
 |
 |
| Parameter | Plot |
|---|---|
| CZT HV Monitor | 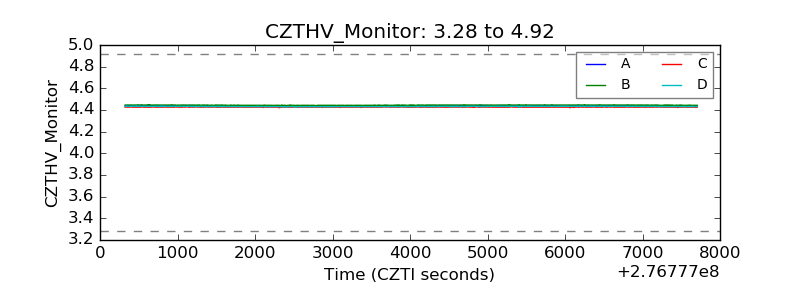 |
| D_VDD | 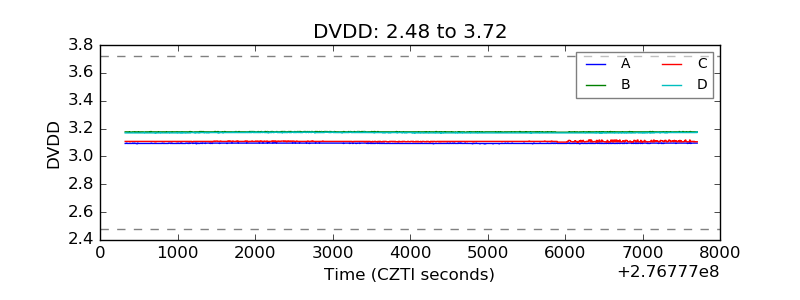 |
| Temperature 1 | 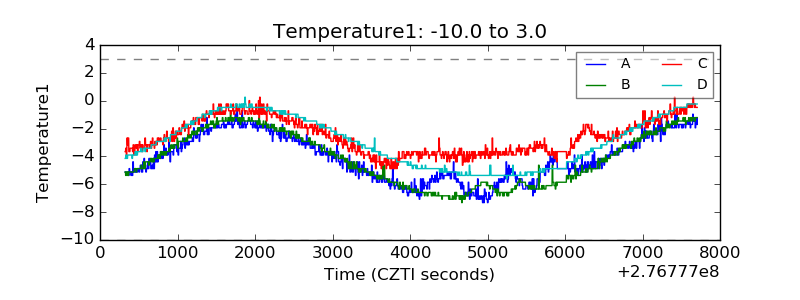 |
| Veto HV Monitor | 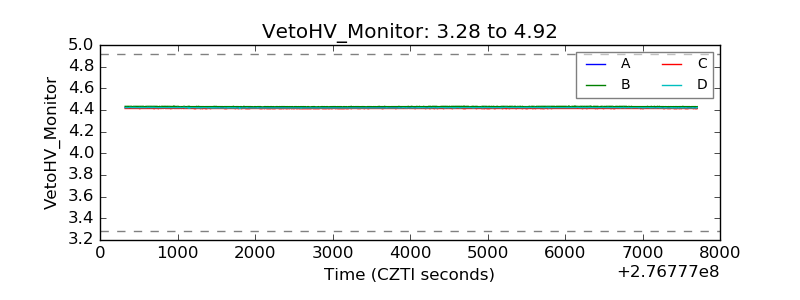 |
| Veto LLD | 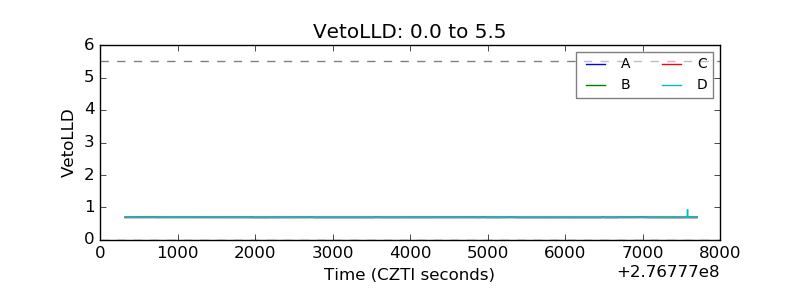 |
| Alpha Counter | 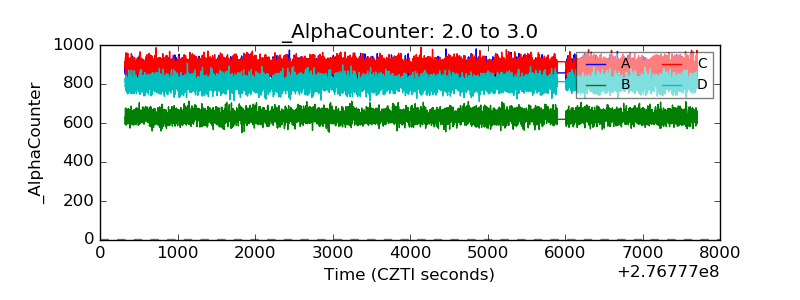 |
| _CPM_Rate | 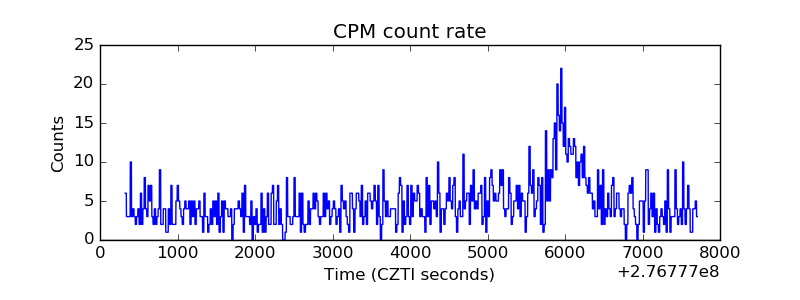 |
| CZT Counter | 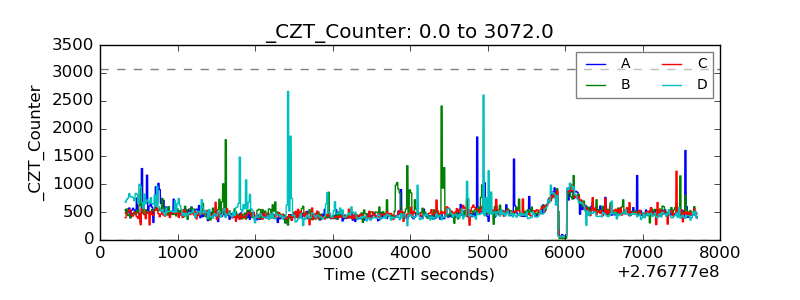 |
| +2.5 Volts monitor | 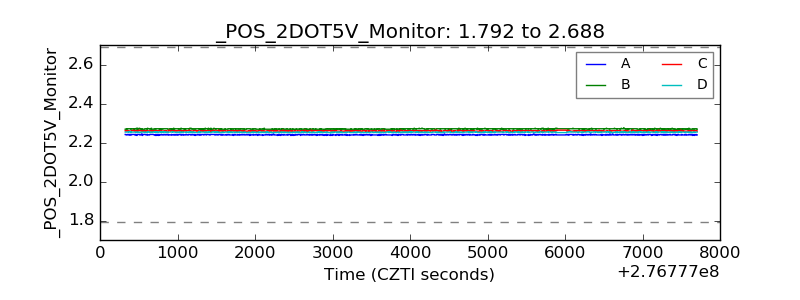 |
| +5 Volts monitor |  |
| _ROLL_ROT | 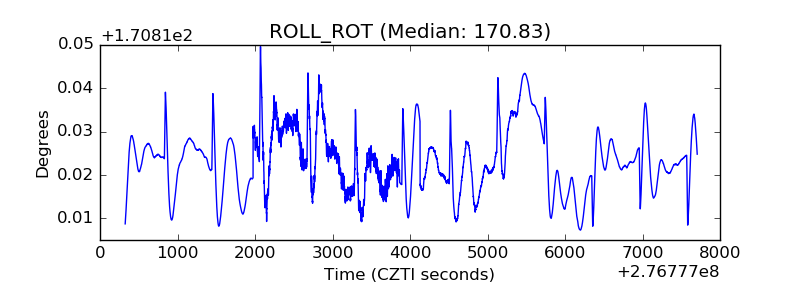 |
| _Roll_DEC | 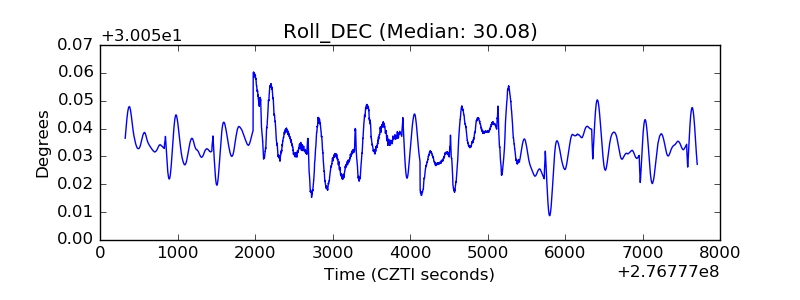 |
| _Roll_RA | 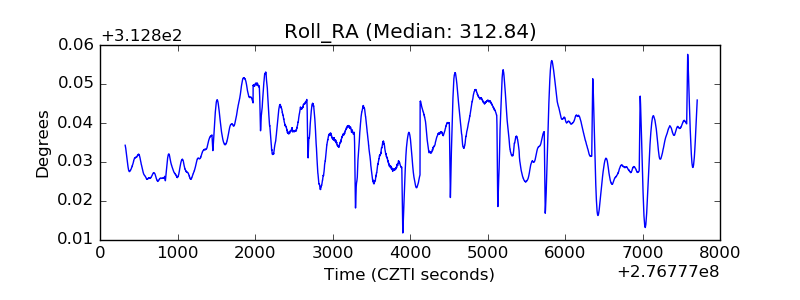 |
| Veto Counter | 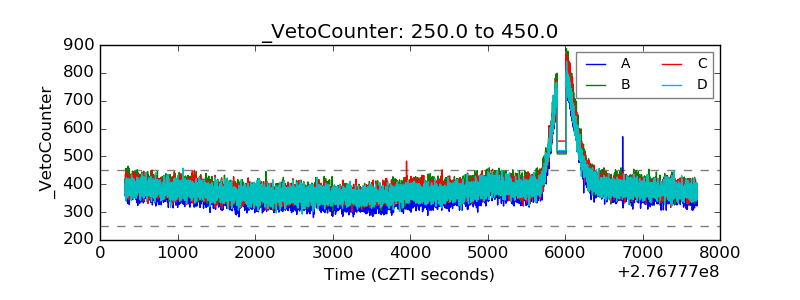 |