| Param | Original file | Final file |
|---|---|---|
| Filename | modeM0/AS1A05_069T05_9000002420_16393cztM0_level2.evt | modeM0/AS1A05_069T05_9000002420_16393cztM0_level2_quad_clean.evt |
| Size (bytes) | 942,491,520 | 183,032,640 |
| Size | 898.8 MB | 174.6 MB |
| Events in quadrant A | 6,861,264 | 1,172,790 |
| Events in quadrant B | 7,517,817 | 1,182,166 |
| Events in quadrant C | 6,877,773 | 1,134,594 |
| Events in quadrant D | 6,364,392 | 1,112,723 |
| Mode M9 | |||
|---|---|---|---|
| Quadrant | BADHDUFLAG | Total packets | Discarded packets |
| A | 0 | 9 | 0 |
| B | 0 | 9 | 0 |
| C | 0 | 9 | 0 |
| D | 0 | 9 | 0 |
| Mode SS | |||
|---|---|---|---|
| Quadrant | BADHDUFLAG | Total packets | Discarded packets |
| A | 0 | 278 | 0 |
| B | 0 | 278 | 0 |
| C | 0 | 278 | 0 |
| D | 0 | 278 | 0 |
| Mode M0 | |||
|---|---|---|---|
| Quadrant | BADHDUFLAG | Total packets | Discarded packets |
| A | 0 | 29514 | 2 |
| B | 0 | 31100 | 2 |
| C | 0 | 28965 | 2 |
| D | 0 | 28699 | 2 |
| Quadrant | Total seconds | Saturated seconds | Saturation percentage |
|---|---|---|---|
| A | 13621 | 183 | 1.343514% |
| B | 13621 | 269 | 1.974892% |
| C | 13621 | 165 | 1.211365% |
| D | 13621 | 145 | 1.064533% |
Noise dominated data is calculated using 1-second bins in cleaned event files. If a bin has >2000 counts, and if more than 50% of those come from <1% of pixels, then it is considered to be noise-dominated and hence unusable.
| Quadrant | # 1 sec bins | Bins with >0 counts | Bins with >2000 counts | High rate bins dominated by noise | Noise dominated (total time) | Noise dominated (detector-on time) | Marked lightcurve |
|---|---|---|---|---|---|---|---|
| A | 14607 | 13624 | 59 | 59 | 0.40% | 0.43% | 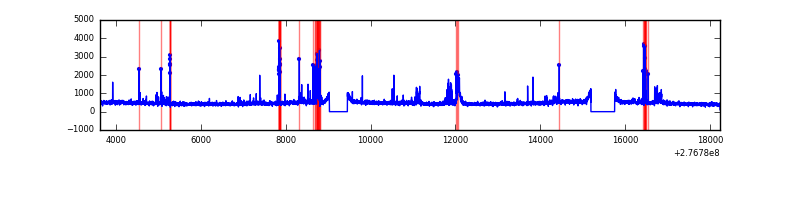 |
| B | 14607 | 13624 | 100 | 100 | 0.68% | 0.73% | 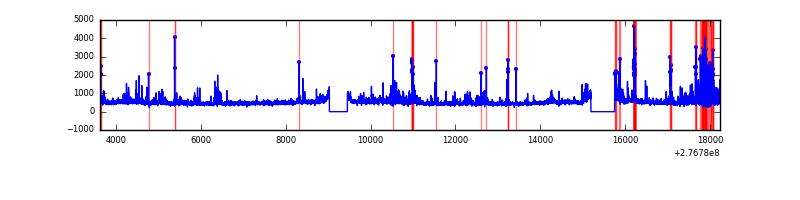 |
| C | 14607 | 13624 | 3 | 3 | 0.02% | 0.02% | 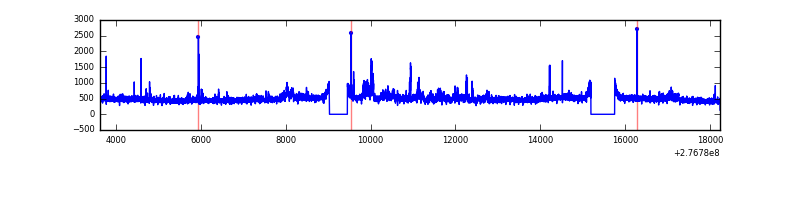 |
| D | 14607 | 13624 | 63 | 63 | 0.43% | 0.46% | 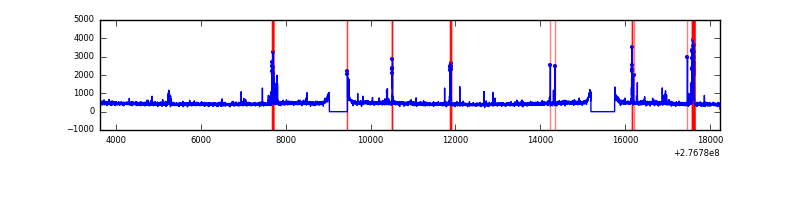 |
Top three noisy pixels from each quadrant. If the there are fewer than three noisy pixels in the level2.evt file, extra rows are filled as -1
| Pixel properties | Quadrant properties | ||||||
|---|---|---|---|---|---|---|---|
| Quadrant | DetID | PixID | Counts | Sigma | Mean | Median | Sigma |
| A | 9 | 143 | 376661 | 1166.35 | 1603 | 1563 | 321.6 |
| A | 15 | 174 | 233003 | 719.65 | 1603 | 1563 | 321.6 |
| A | 15 | 223 | 76580 | 233.26 | 1603 | 1563 | 321.6 |
| B | 4 | 173 | 307769 | 1000.02 | 1601 | 1555 | 306.2 |
| B | 10 | 16 | 216192 | 700.95 | 1601 | 1555 | 306.2 |
| B | 15 | 35 | 204032 | 661.24 | 1601 | 1555 | 306.2 |
| C | 3 | 233 | 570752 | 1586.53 | 1540 | 1547 | 358.8 |
| C | 14 | 238 | 236342 | 654.44 | 1540 | 1547 | 358.8 |
| C | 10 | 169 | 41994 | 112.74 | 1540 | 1547 | 358.8 |
| D | 10 | 70 | 272558 | 712.19 | 1564 | 1517 | 380.6 |
| D | 12 | 218 | 70699 | 181.78 | 1564 | 1517 | 380.6 |
| D | 2 | 234 | 57149 | 146.18 | 1564 | 1517 | 380.6 |
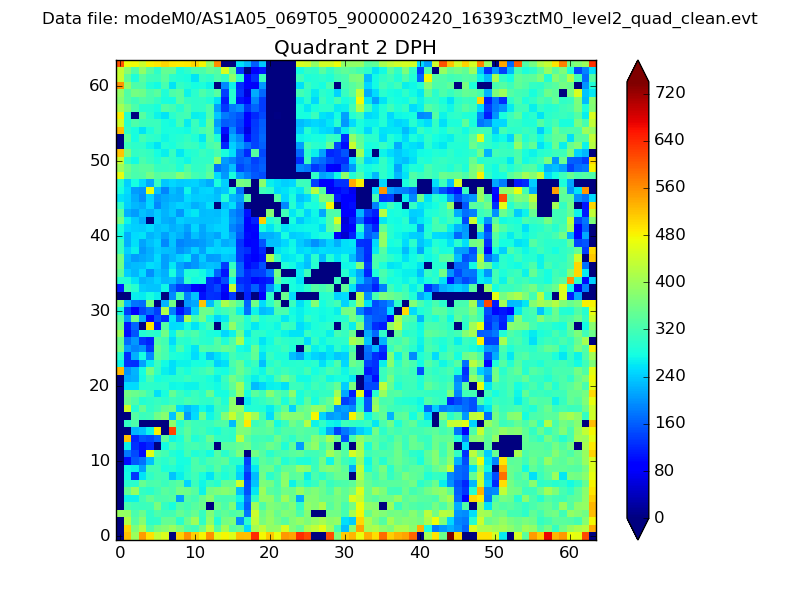
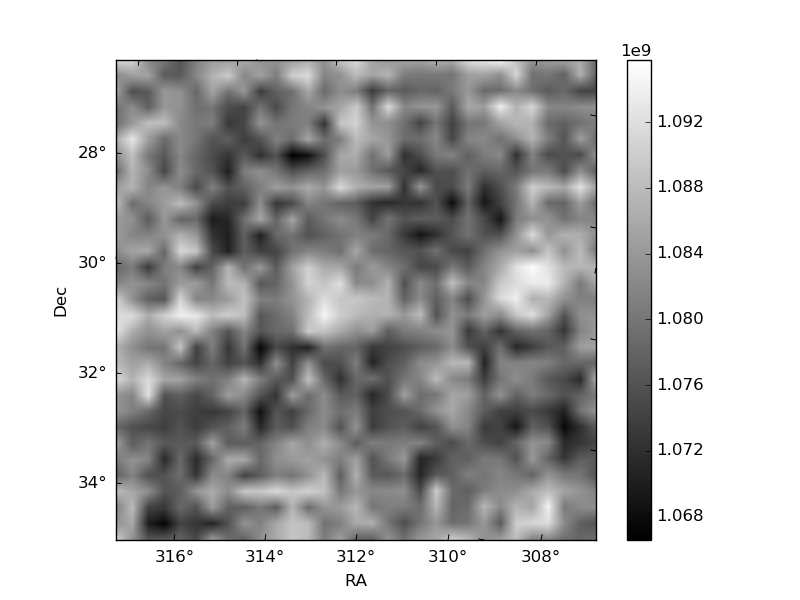
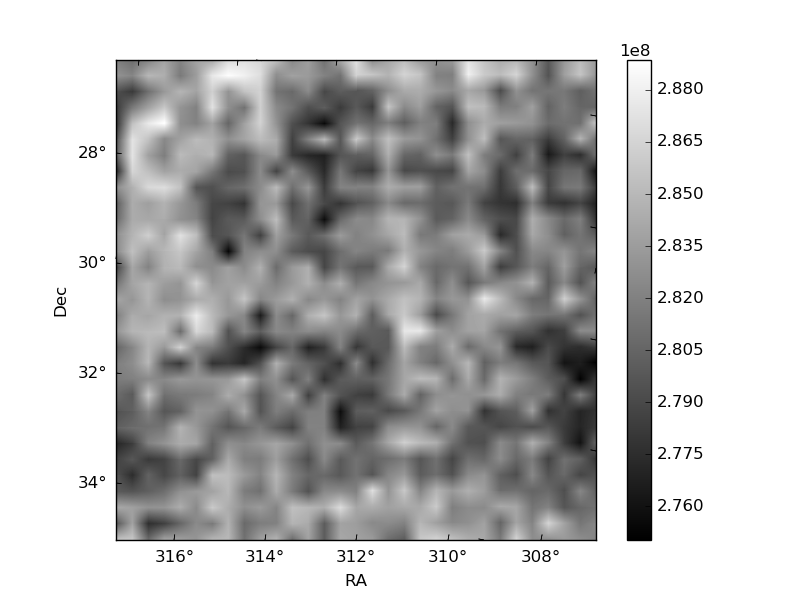
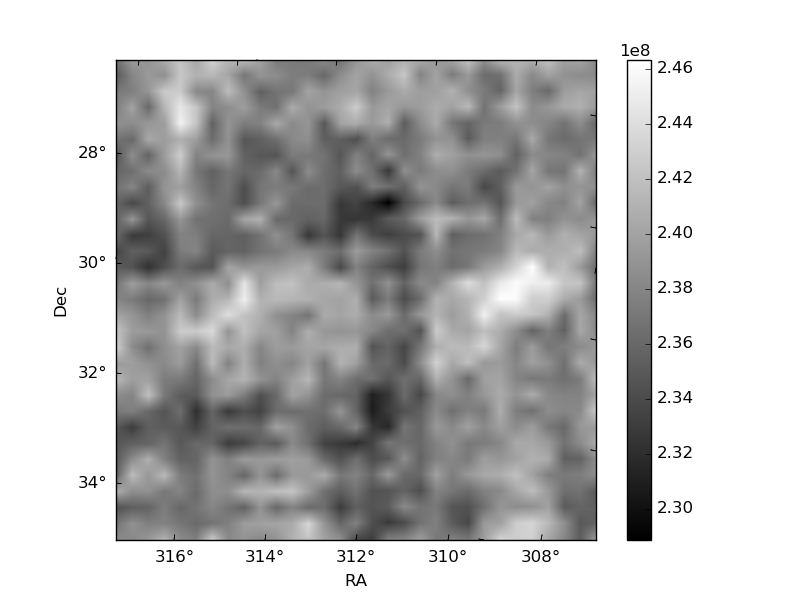
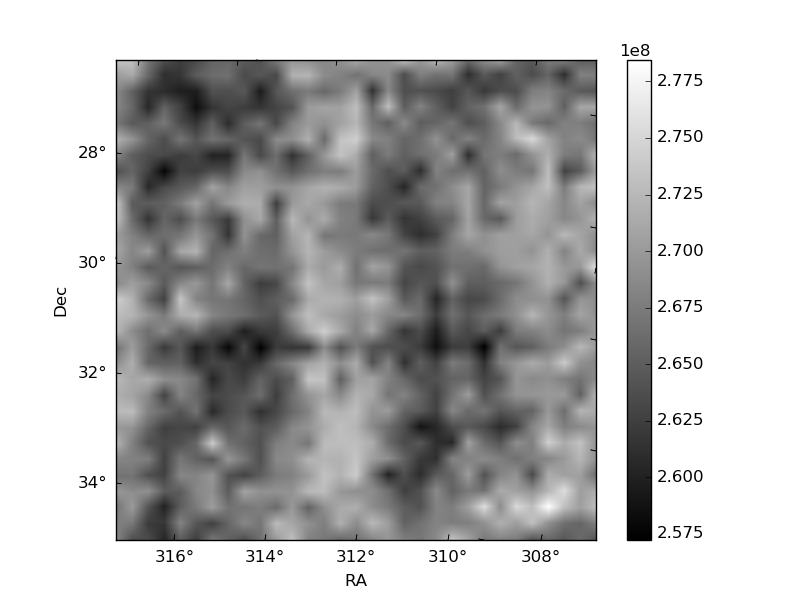
Histogram calculated using DETX and DETY for each event in the final _common_clean file
| Quadrant A | 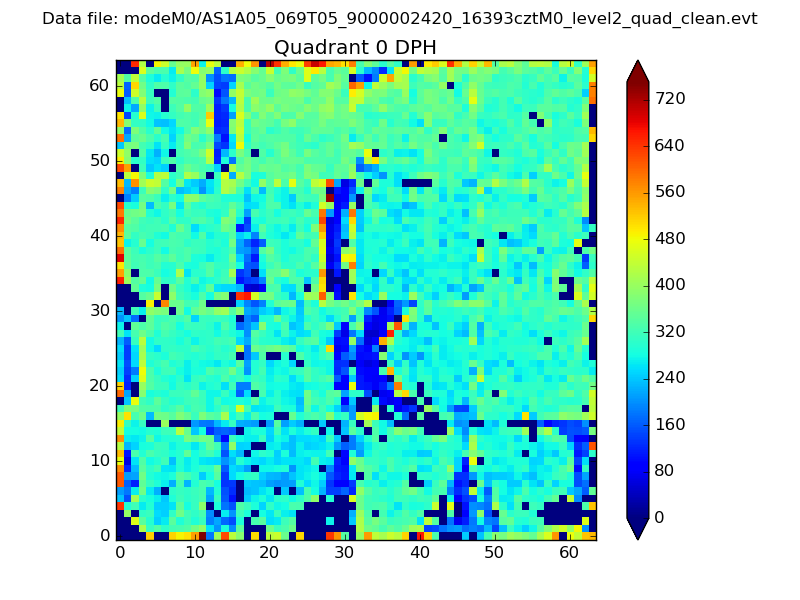 |
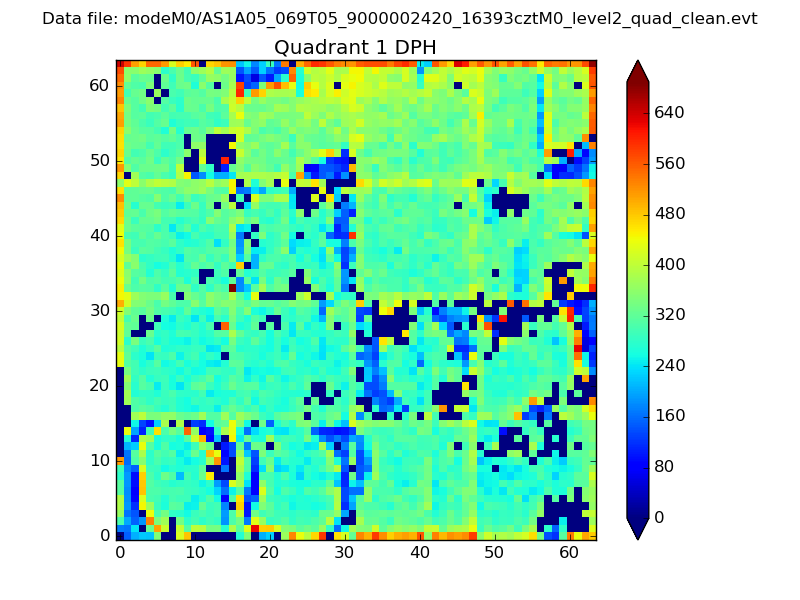 |
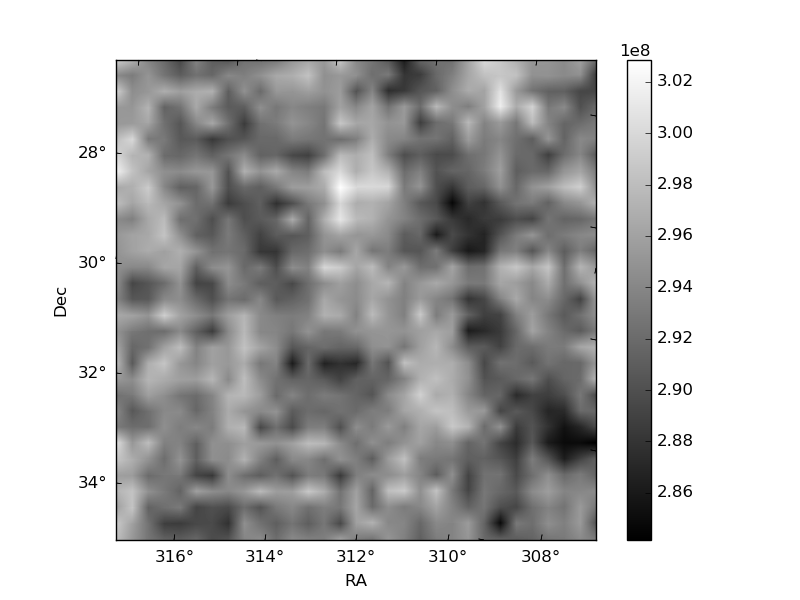
Quadrant B |
|---|---|---|---|
| Quadrant D | 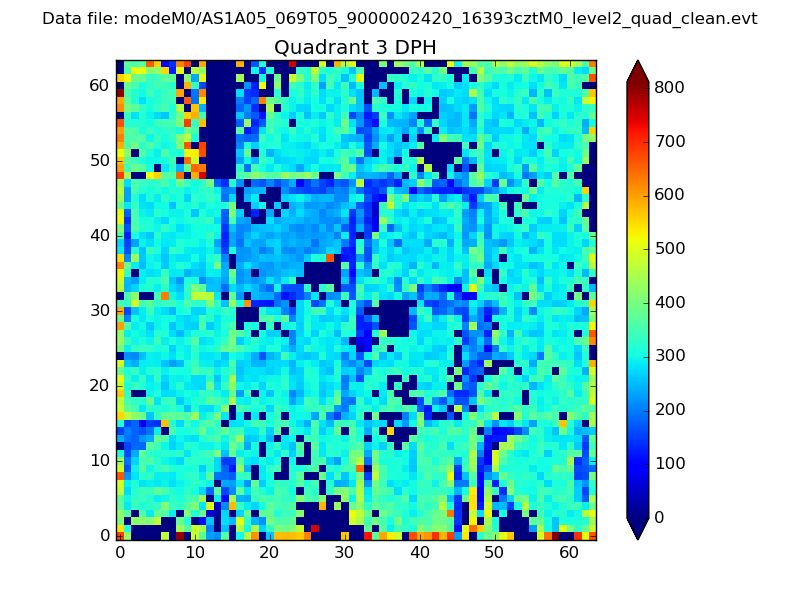 |
 |
Quadrant C |
| Plot type | Count rate plots | Images |
|---|---|---|
| Comparison with Poisson distribution Blue bars denote a histogram of data divided into 1 sec bins. Red curve is a Poisson curve with rate = median count rate of data. |
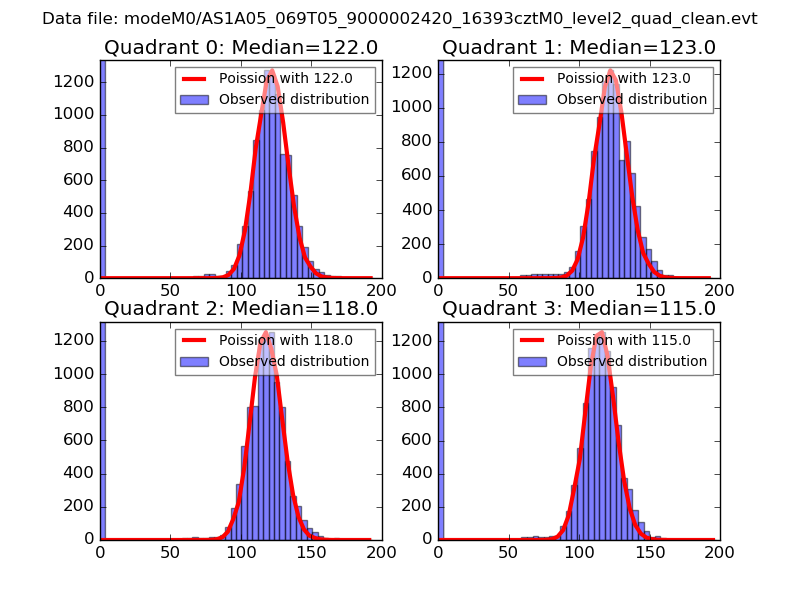 |
 |
| Quadrant-wise count rates Data is divided into 100 sec bins |
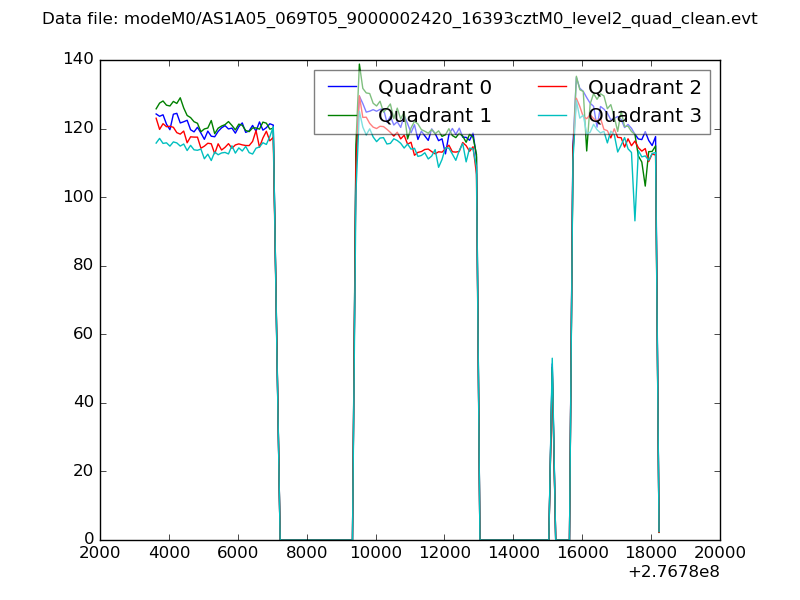 |
|
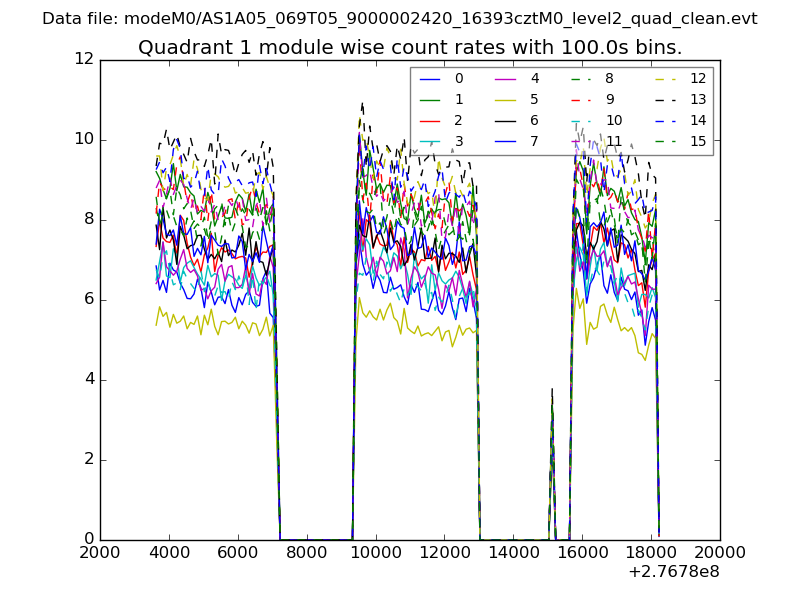
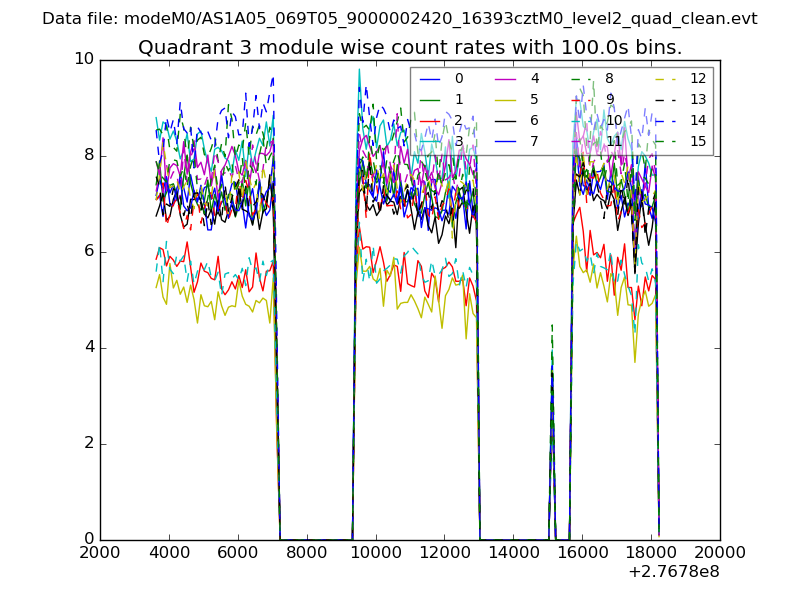
| Module-wise count rates for Quadrant A Data is divided into 100 sec bins |
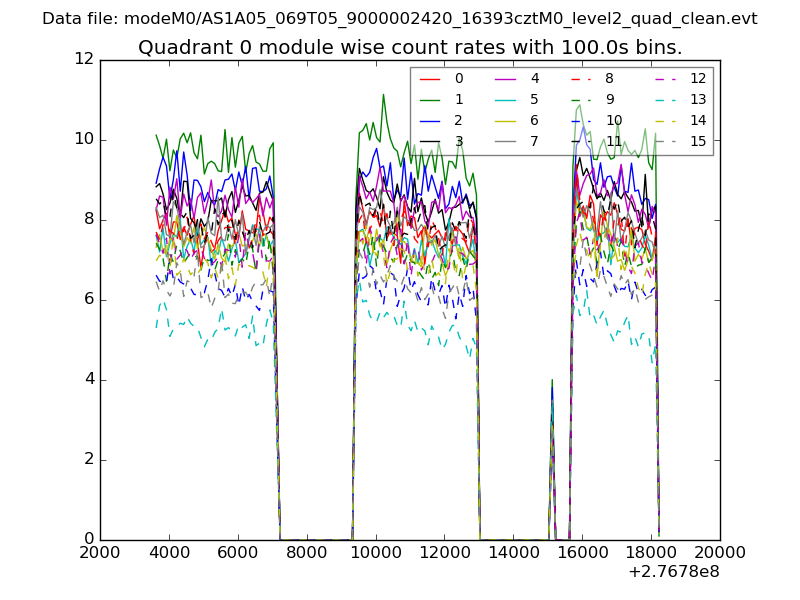 |
 |
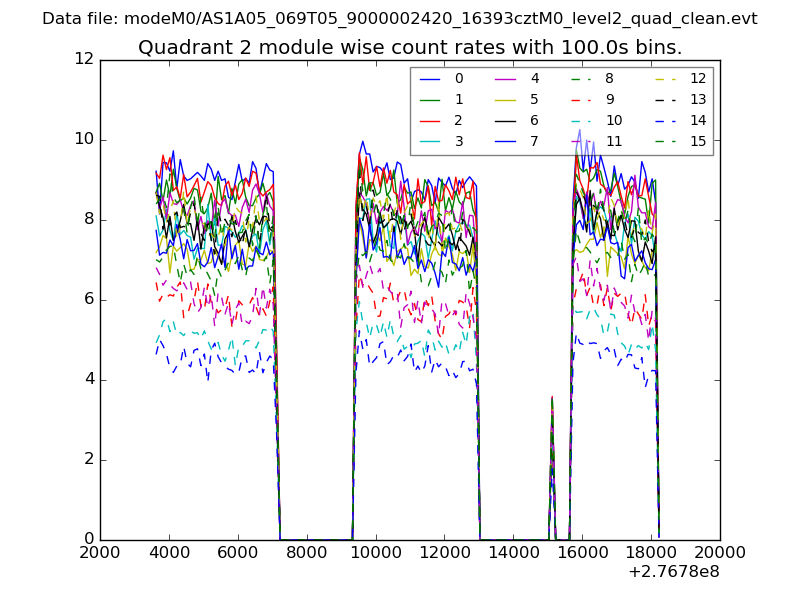
| Module-wise count rates for Quadrant B Data is divided into 100 sec bins |
 |
 |
| Module-wise count rates for Quadrant C Data is divided into 100 sec bins |
 |
 |
| Module-wise count rates for Quadrant D Data is divided into 100 sec bins |
 |
 |
| Parameter | Plot |
|---|---|
| CZT HV Monitor | 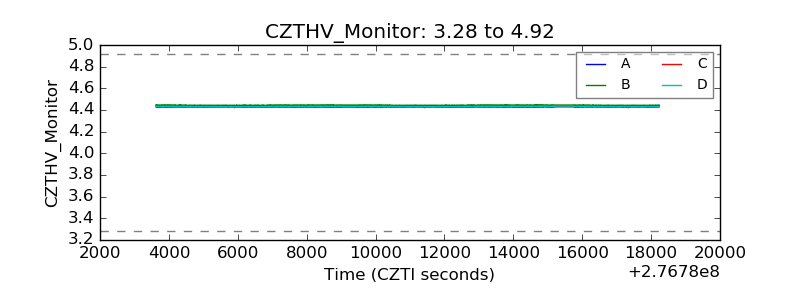 |
| D_VDD |  |
| Temperature 1 | 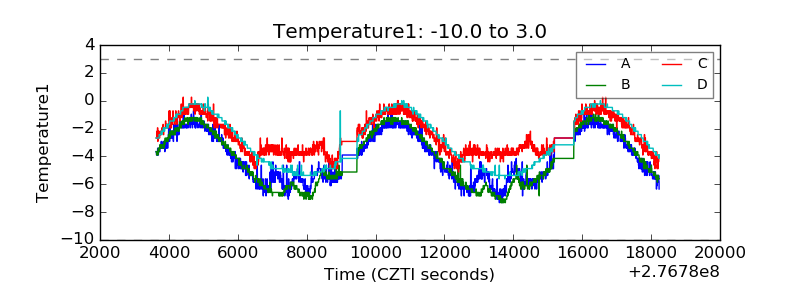 |
| Veto HV Monitor | 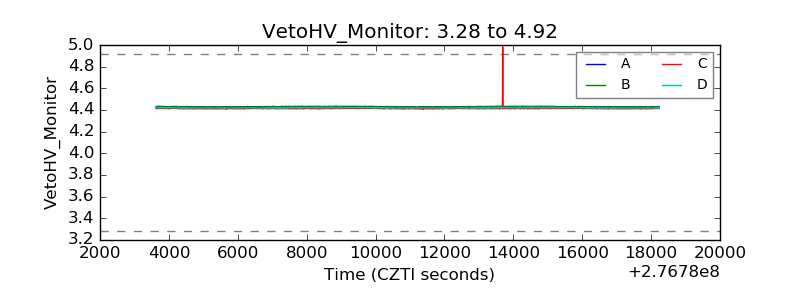 |
| Veto LLD | 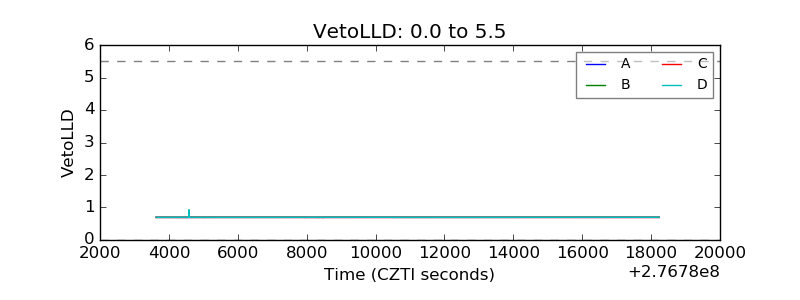 |
| Alpha Counter | 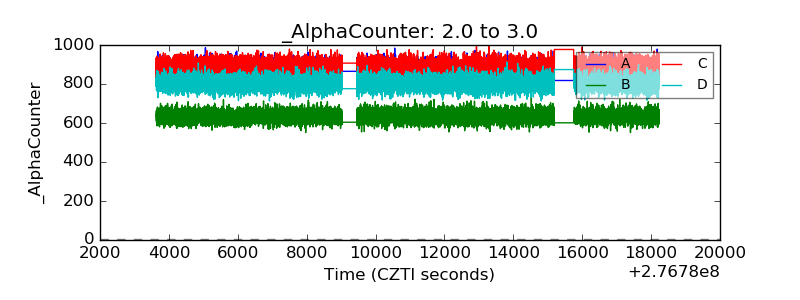 |
| _CPM_Rate | 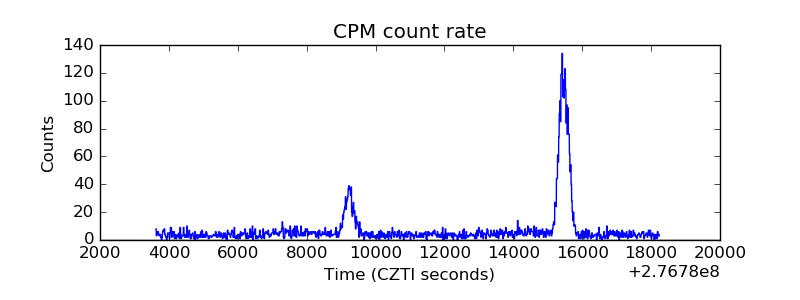 |
| CZT Counter | 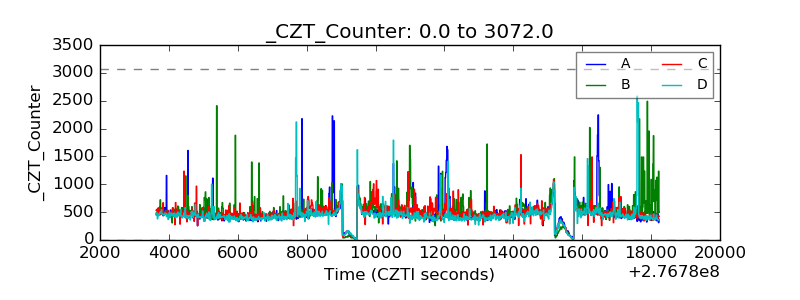 |
| +2.5 Volts monitor |  |
| +5 Volts monitor |  |
| _ROLL_ROT | 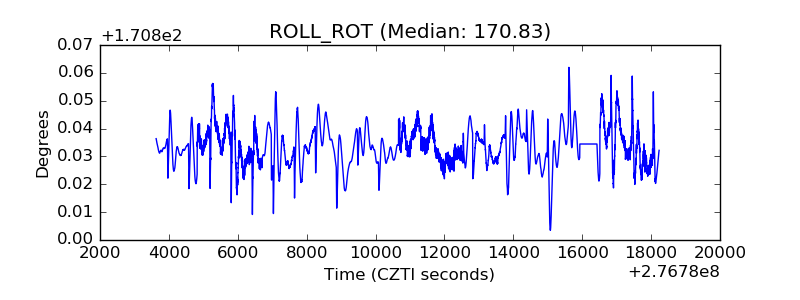 |
| _Roll_DEC | 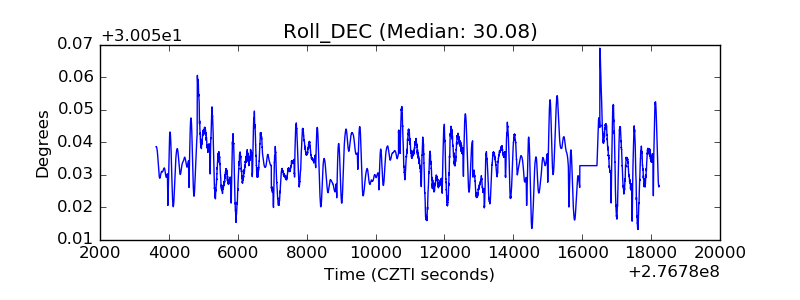 |
| _Roll_RA |  |
| Veto Counter | 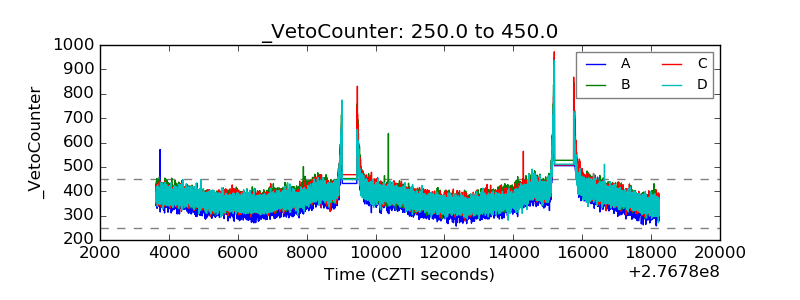 |