| Param | Original file | Final file |
|---|---|---|
| Filename | modeM0/AS1A05_069T02_9000002422cztM0_level2.fits | modeM0/AS1A05_069T02_9000002422cztM0_level2_quad_clean.evt |
| Size (bytes) | 672,027,840 | 616,184,640 |
| Size | 640.9 MB | 587.6 MB |
| Events in quadrant A | 4,118,998 | 3,628,669 |
| Events in quadrant B | 3,978,192 | 3,678,490 |
| Events in quadrant C | 4,012,080 | 3,472,820 |
| Events in quadrant D | 3,462,318 | 3,100,934 |
| Mode SS | |||
|---|---|---|---|
| Quadrant | BADHDUFLAG | Total packets | Discarded packets |
| A | 0 | 1416 | 0 |
| B | 0 | 1416 | 0 |
| C | 0 | 1416 | 0 |
| D | 0 | 1416 | 0 |
| Mode M0 | |||
|---|---|---|---|
| Quadrant | BADHDUFLAG | Total packets | Discarded packets |
| A | 0 | 151902 | 0 |
| B | 0 | 158996 | 0 |
| C | 0 | 147950 | 0 |
| D | 0 | 161105 | 0 |
| Mode M9 | |||
|---|---|---|---|
| Quadrant | BADHDUFLAG | Total packets | Discarded packets |
| A | 0 | 112 | 0 |
| B | 0 | 112 | 0 |
| C | 0 | 112 | 0 |
| D | 0 | 112 | 0 |
| Quadrant | Total seconds | Saturated seconds | Saturation percentage |
|---|---|---|---|
| A | 69708 | 1588 | 2.278074% |
| B | 69708 | 1578 | 2.263729% |
| C | 69708 | 1326 | 1.902221% |
| D | 69708 | 1832 | 2.628106% |
Noise dominated data is calculated using 1-second bins in cleaned event files. If a bin has >2000 counts, and if more than 50% of those come from <1% of pixels, then it is considered to be noise-dominated and hence unusable.
| Quadrant | # 1 sec bins | Bins with >0 counts | Bins with >2000 counts | High rate bins dominated by noise | Noise dominated (total time) | Noise dominated (detector-on time) | Marked lightcurve |
|---|---|---|---|---|---|---|---|
| A | 80809 | 69705 | 0 | 0 | 0.00% | 0.00% |  |
| B | 80809 | 69701 | 0 | 0 | 0.00% | 0.00% |  |
| C | 80809 | 69704 | 0 | 0 | 0.00% | 0.00% |  |
| D | 80809 | 69689 | 0 | 0 | 0.00% | 0.00% |  |
Top three noisy pixels from each quadrant. If the there are fewer than three noisy pixels in the level2.evt file, extra rows are filled as -1
| Pixel properties | Quadrant properties | ||||||
|---|---|---|---|---|---|---|---|
| Quadrant | DetID | PixID | Counts | Sigma | Mean | Median | Sigma |
| A | 0 | 29 | 3857 | 10.81 | 1072 | 1005 | 263.7 |
| A | 7 | 110 | 3268 | 8.58 | 1072 | 1005 | 263.7 |
| A | 9 | 19 | 3126 | 8.04 | 1072 | 1005 | 263.7 |
| B | 2 | 9 | 3304 | 11.22 | 1051 | 1004 | 205.0 |
| B | 2 | 8 | 2750 | 8.52 | 1051 | 1004 | 205.0 |
| B | 14 | 254 | 2614 | 7.85 | 1051 | 1004 | 205.0 |
| C | 1 | 81 | 2956 | 7.19 | 1058 | 984 | 274.2 |
| C | 1 | 80 | 2955 | 7.19 | 1058 | 984 | 274.2 |
| C | 12 | 241 | 2799 | 6.62 | 1058 | 984 | 274.2 |
| D | 10 | 189 | 2501 | 6.08 | 990 | 901 | 263.2 |
| D | 6 | 231 | 2491 | 6.04 | 990 | 901 | 263.2 |
| D | 7 | 3 | 2451 | 5.89 | 990 | 901 | 263.2 |
Histogram calculated using DETX and DETY for each event in the final _common_clean file
| Quadrant A |  |
 |
Quadrant B |
|---|---|---|---|
| Quadrant D |  |
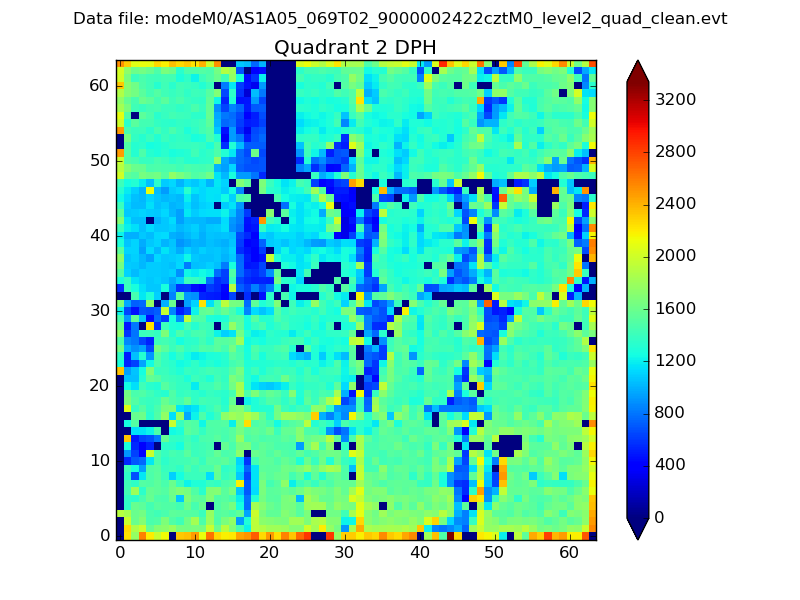 |
Quadrant C |
| Plot type | Count rate plots | Images |
|---|---|---|
| Comparison with Poisson distribution Blue bars denote a histogram of data divided into 1 sec bins. Red curve is a Poisson curve with rate = median count rate of data. |
 |
 |
| Quadrant-wise count rates Data is divided into 100 sec bins |
 |
|
| Module-wise count rates for Quadrant A Data is divided into 100 sec bins |
 |
 |
| Module-wise count rates for Quadrant B Data is divided into 100 sec bins |
 |
 |
| Module-wise count rates for Quadrant C Data is divided into 100 sec bins |
 |
 |
| Module-wise count rates for Quadrant D Data is divided into 100 sec bins |
 |
 |
| Parameter | Plot |
|---|---|
| CZT HV Monitor |  |
| D_VDD |  |
| Temperature 1 |  |
| Veto HV Monitor |  |
| Veto LLD |  |
| Alpha Counter |  |
| _CPM_Rate |  |
| CZT Counter |  |
| +2.5 Volts monitor |  |
| +5 Volts monitor |  |
| _ROLL_ROT |  |
| _Roll_DEC |  |
| _Roll_RA |  |
| Veto Counter |  |