| Param | Original file | Final file |
|---|---|---|
| Filename | modeM0/AS1A05_069T02_9000002422_16393cztM0_level2.evt | modeM0/AS1A05_069T02_9000002422_16393cztM0_level2_quad_clean.evt |
| Size (bytes) | 299,891,520 | 45,365,760 |
| Size | 286.0 MB | 43.3 MB |
| Events in quadrant A | 2,054,825 | 272,783 |
| Events in quadrant B | 2,497,968 | 275,556 |
| Events in quadrant C | 2,077,661 | 266,113 |
| Events in quadrant D | 2,160,640 | 258,331 |
| Mode SS | |||
|---|---|---|---|
| Quadrant | BADHDUFLAG | Total packets | Discarded packets |
| A | 0 | 88 | 0 |
| B | 0 | 88 | 0 |
| C | 0 | 88 | 0 |
| D | 0 | 88 | 0 |
| Mode M0 | |||
|---|---|---|---|
| Quadrant | BADHDUFLAG | Total packets | Discarded packets |
| A | 0 | 8868 | 2 |
| B | 0 | 10123 | 1 |
| C | 0 | 8839 | 1 |
| D | 0 | 9371 | 1 |
| Mode M9 | |||
|---|---|---|---|
| Quadrant | BADHDUFLAG | Total packets | Discarded packets |
| A | 0 | 7 | 0 |
| B | 0 | 7 | 0 |
| C | 0 | 7 | 0 |
| D | 0 | 7 | 0 |
| Quadrant | Total seconds | Saturated seconds | Saturation percentage |
|---|---|---|---|
| A | 4263 | 46 | 1.079052% |
| B | 4263 | 89 | 2.087732% |
| C | 4263 | 59 | 1.384002% |
| D | 4263 | 51 | 1.196341% |
Noise dominated data is calculated using 1-second bins in cleaned event files. If a bin has >2000 counts, and if more than 50% of those come from <1% of pixels, then it is considered to be noise-dominated and hence unusable.
| Quadrant | # 1 sec bins | Bins with >0 counts | Bins with >2000 counts | High rate bins dominated by noise | Noise dominated (total time) | Noise dominated (detector-on time) | Marked lightcurve |
|---|---|---|---|---|---|---|---|
| A | 5014 | 4264 | 0 | 0 | 0.00% | 0.00% | 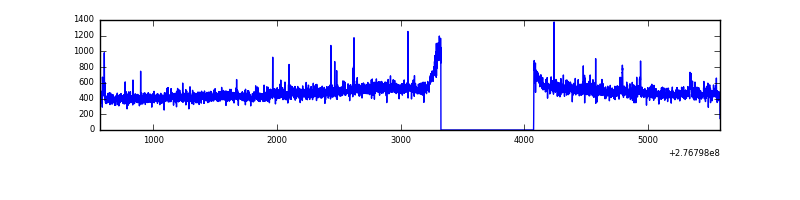 |
| B | 5014 | 4264 | 34 | 34 | 0.68% | 0.80% | 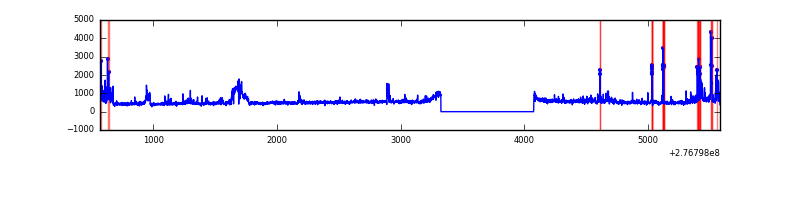 |
| C | 5014 | 4265 | 1 | 1 | 0.02% | 0.02% | 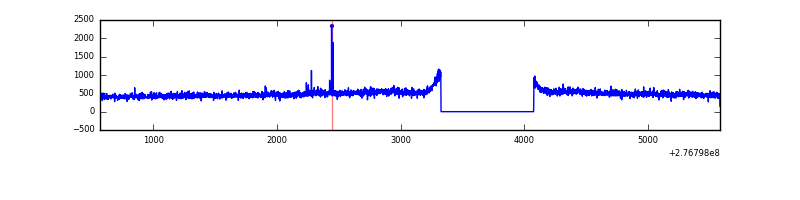 |
| D | 5014 | 4264 | 10 | 10 | 0.20% | 0.23% | 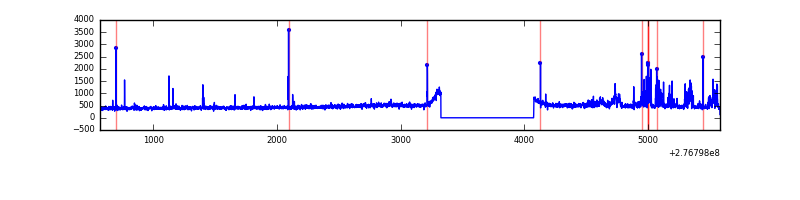 |
Top three noisy pixels from each quadrant. If the there are fewer than three noisy pixels in the level2.evt file, extra rows are filled as -1
| Pixel properties | Quadrant properties | ||||||
|---|---|---|---|---|---|---|---|
| Quadrant | DetID | PixID | Counts | Sigma | Mean | Median | Sigma |
| A | 15 | 223 | 20501 | 188.32 | 520 | 508 | 106.2 |
| A | 9 | 143 | 17869 | 163.53 | 520 | 508 | 106.2 |
| A | 15 | 174 | 13757 | 124.8 | 520 | 508 | 106.2 |
| B | 10 | 16 | 228713 | 2239.37 | 520 | 506 | 101.9 |
| B | 15 | 35 | 100705 | 983.24 | 520 | 506 | 101.9 |
| B | 3 | 209 | 41805 | 405.26 | 520 | 506 | 101.9 |
| C | 14 | 238 | 75961 | 635.37 | 500 | 503 | 118.8 |
| C | 3 | 233 | 39836 | 331.19 | 500 | 503 | 118.8 |
| C | 10 | 169 | 8274 | 65.43 | 500 | 503 | 118.8 |
| D | 12 | 110 | 189771 | 1509.4 | 506 | 491 | 125.4 |
| D | 1 | 52 | 16971 | 131.42 | 506 | 491 | 125.4 |
| D | 10 | 70 | 14194 | 109.27 | 506 | 491 | 125.4 |
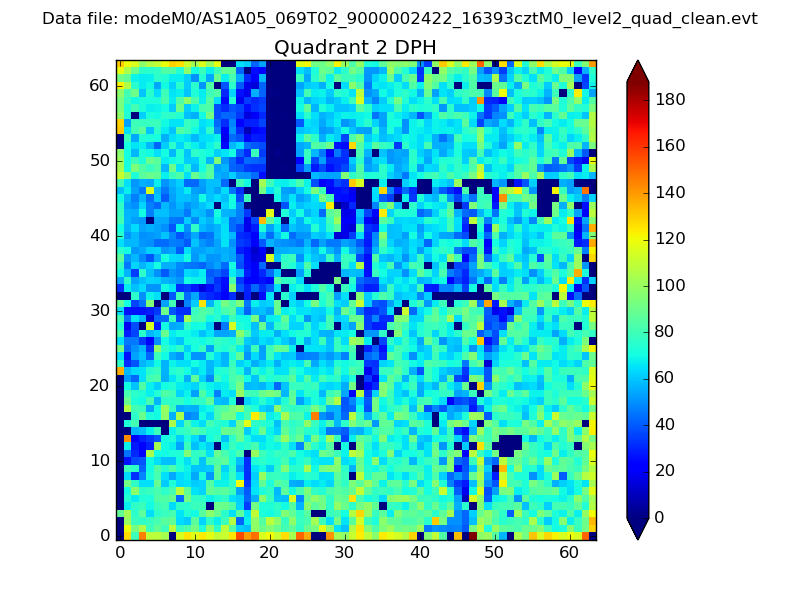
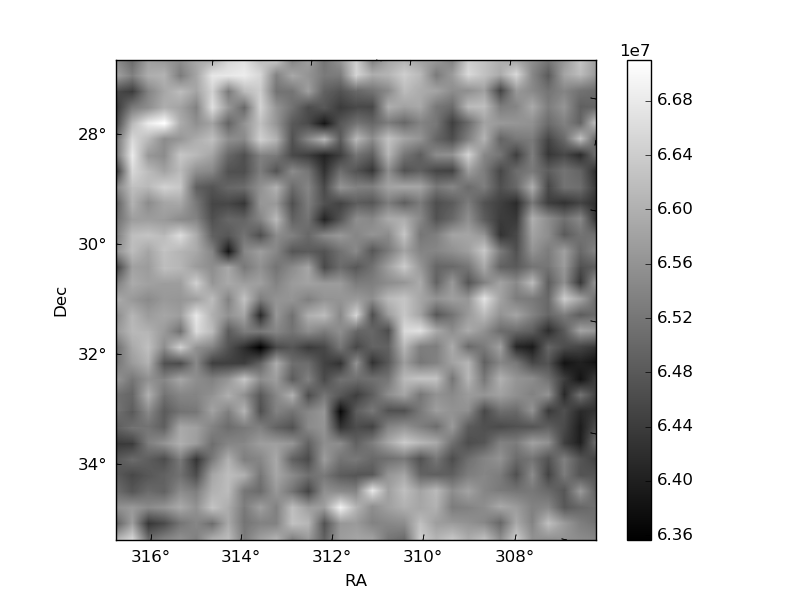
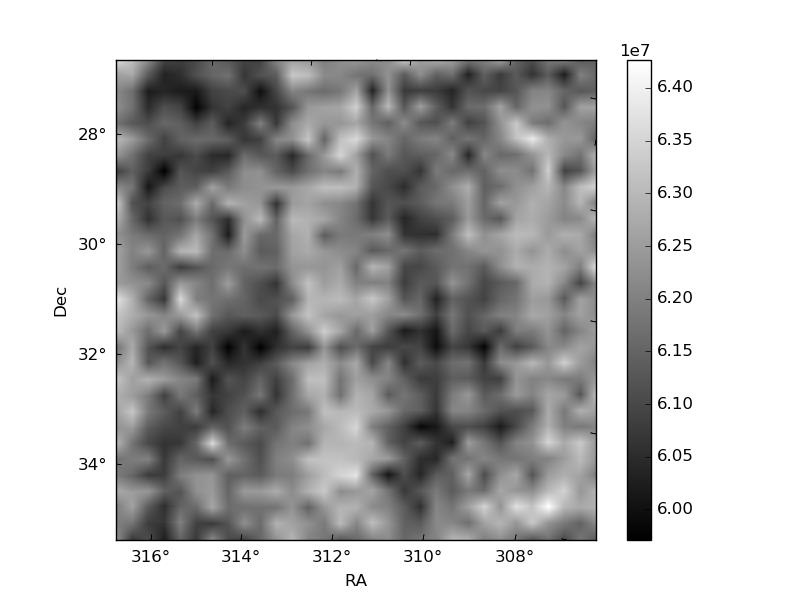
Histogram calculated using DETX and DETY for each event in the final _common_clean file
| Quadrant A |  |
 |
Quadrant B |
|---|---|---|---|
| Quadrant D | 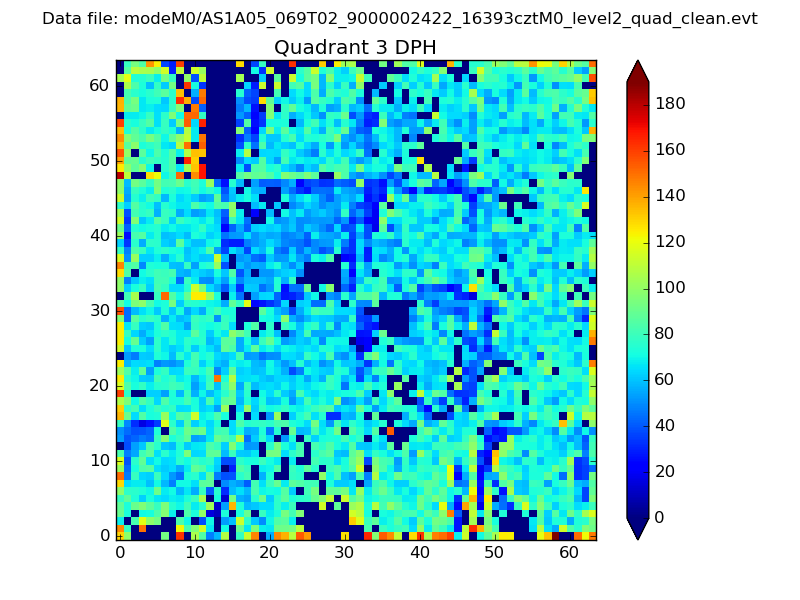 |
 |
Quadrant C |
| Plot type | Count rate plots | Images |
|---|---|---|
| Comparison with Poisson distribution Blue bars denote a histogram of data divided into 1 sec bins. Red curve is a Poisson curve with rate = median count rate of data. |
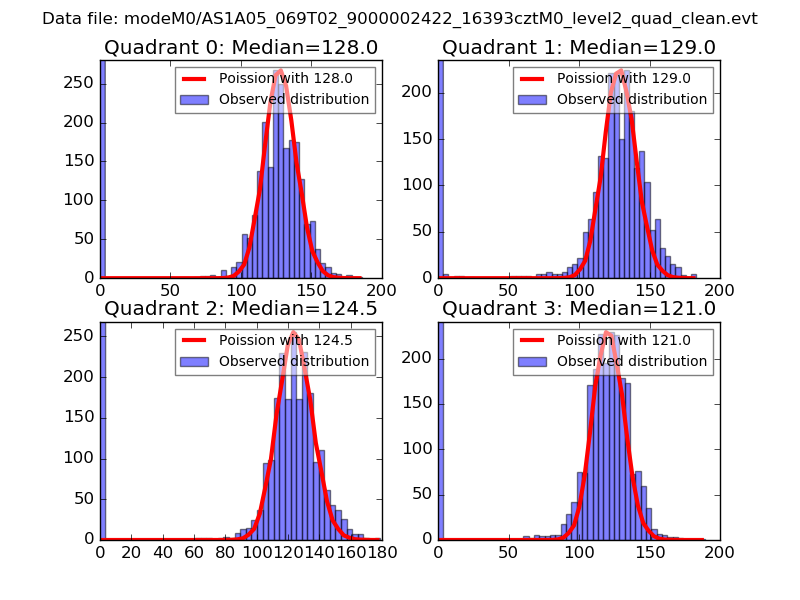 |
 |
| Quadrant-wise count rates Data is divided into 100 sec bins |
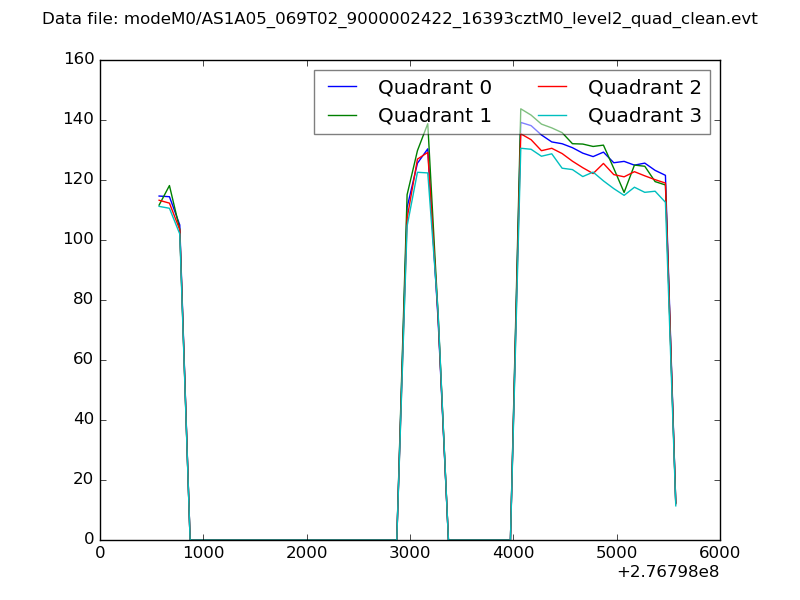 |
|
| Module-wise count rates for Quadrant A Data is divided into 100 sec bins |
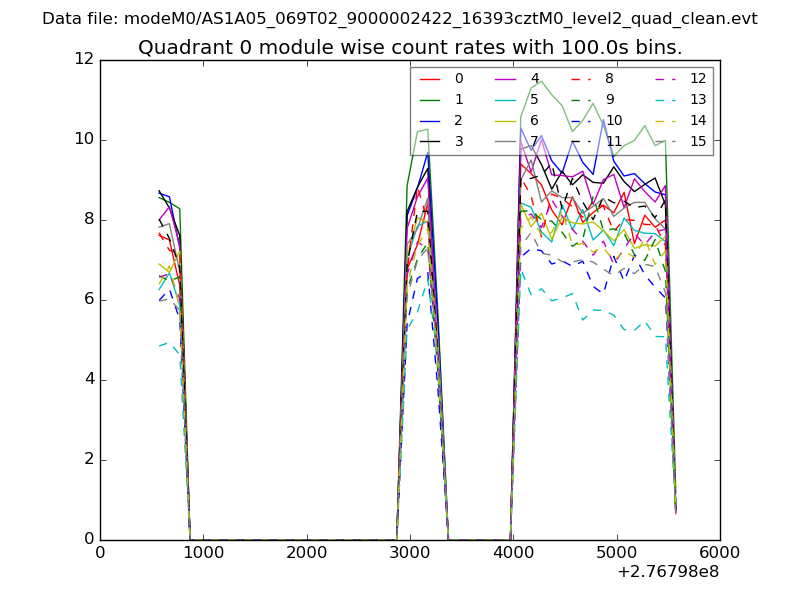 |
 |
| Module-wise count rates for Quadrant B Data is divided into 100 sec bins |
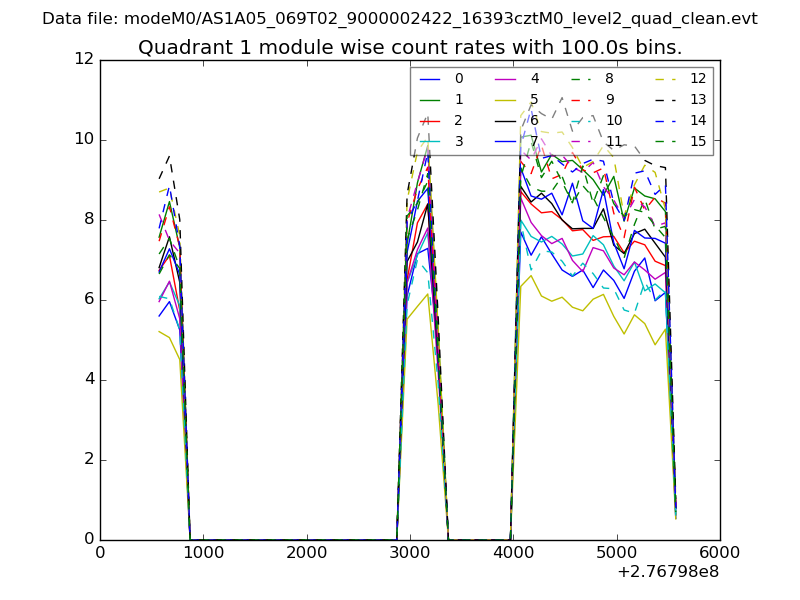 |
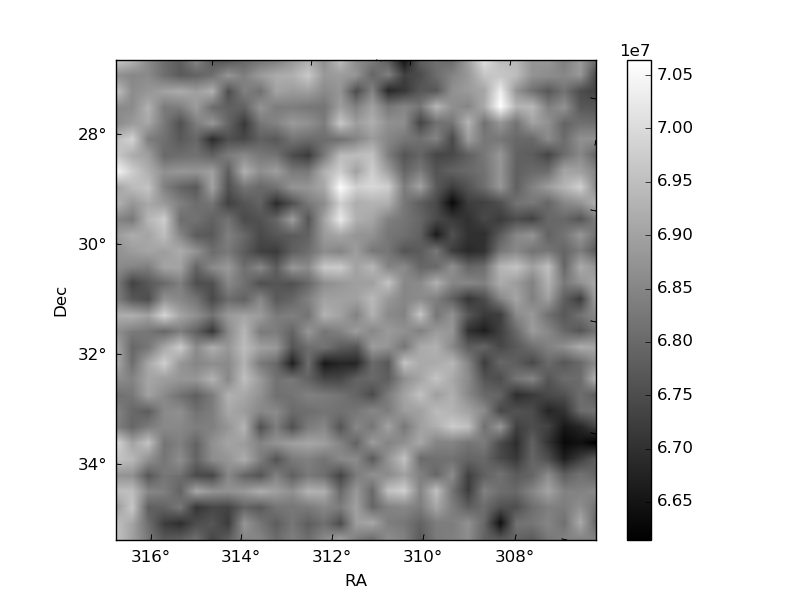 |
| Module-wise count rates for Quadrant C Data is divided into 100 sec bins |
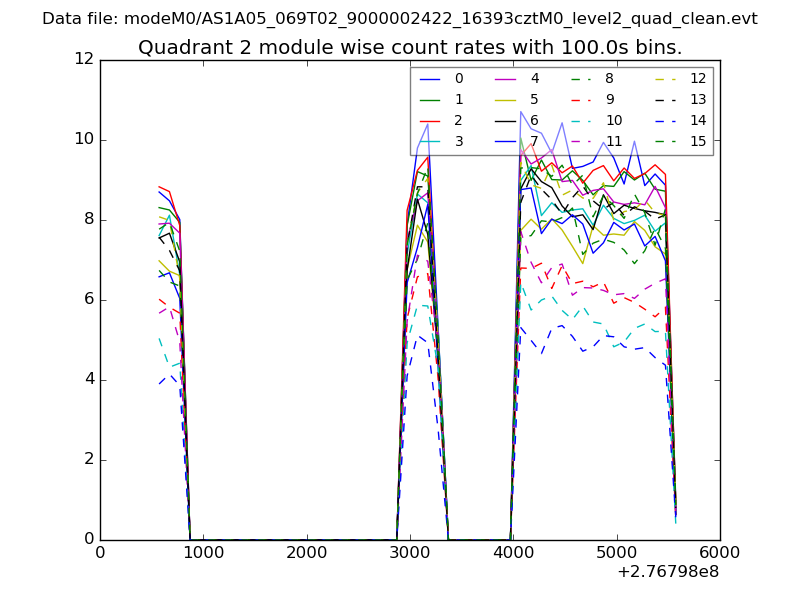 |
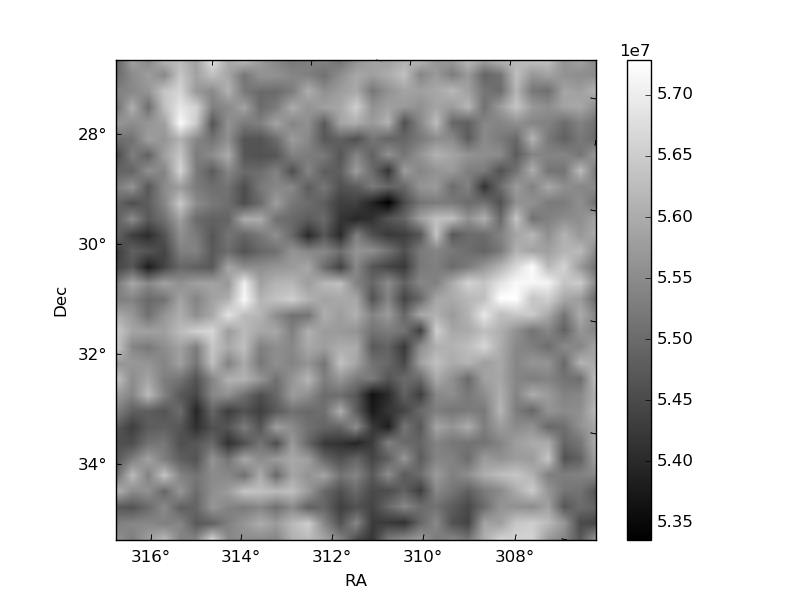 |
| Module-wise count rates for Quadrant D Data is divided into 100 sec bins |
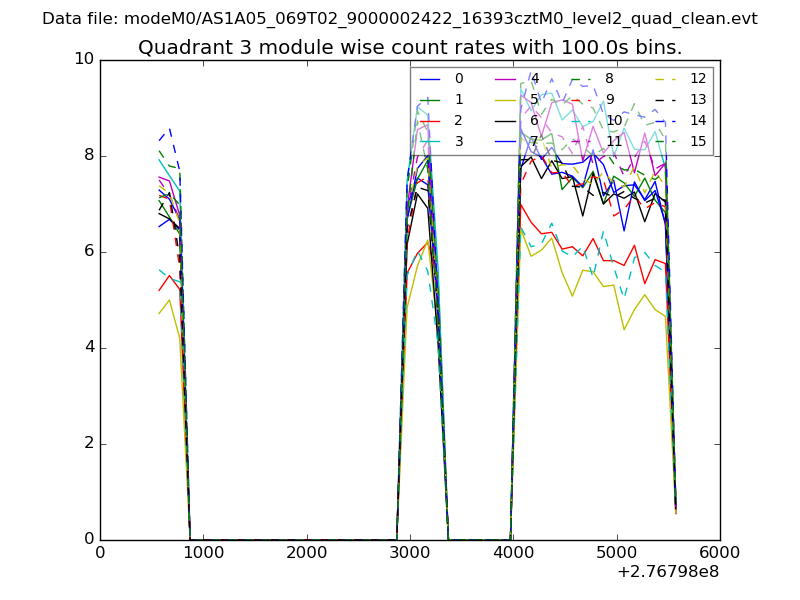 |
 |
| Parameter | Plot |
|---|---|
| CZT HV Monitor | 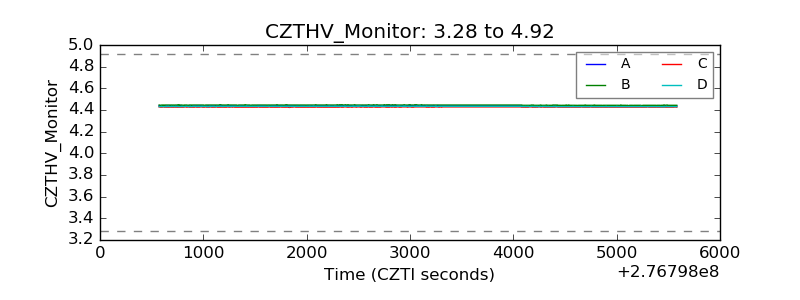 |
| D_VDD | 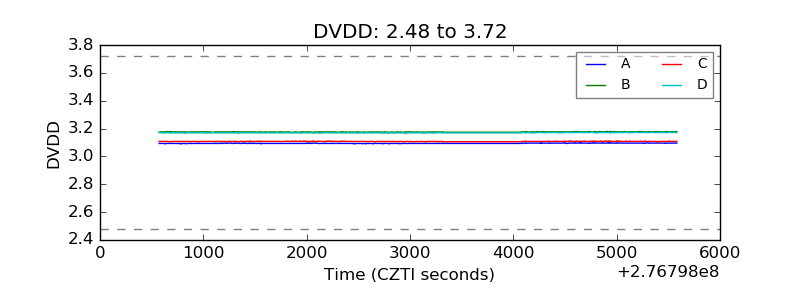 |
| Temperature 1 | 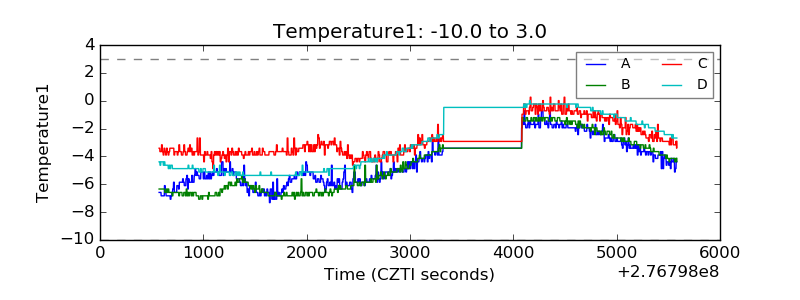 |
| Veto HV Monitor | 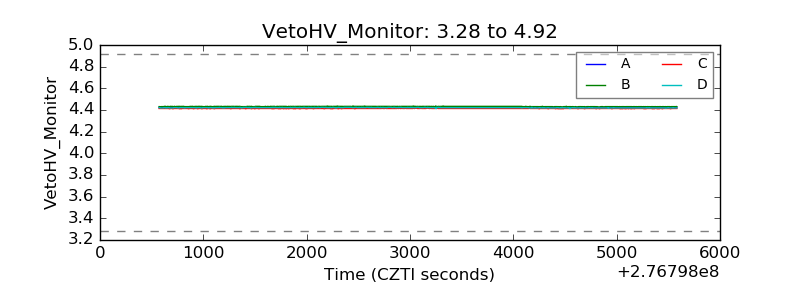 |
| Veto LLD | 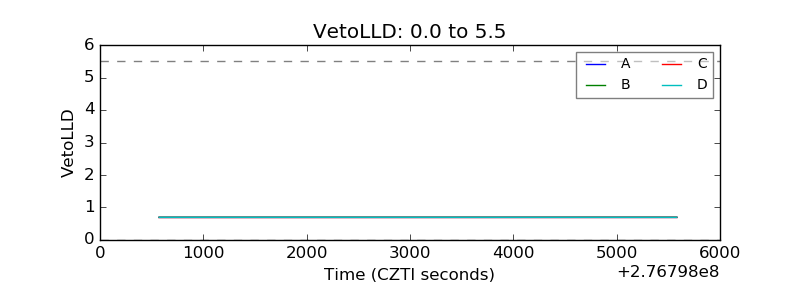 |
| Alpha Counter | 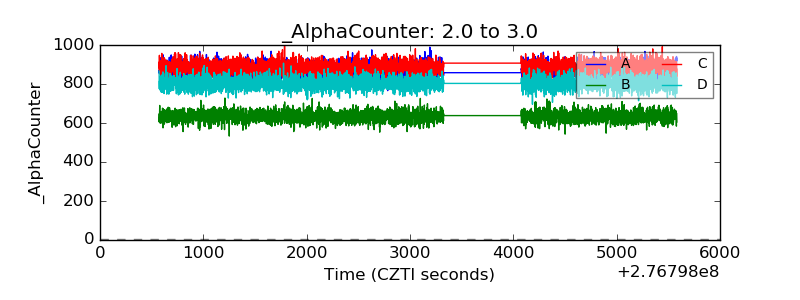 |
| _CPM_Rate | 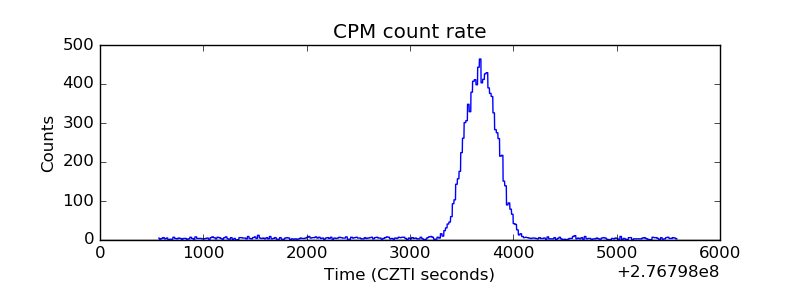 |
| CZT Counter | 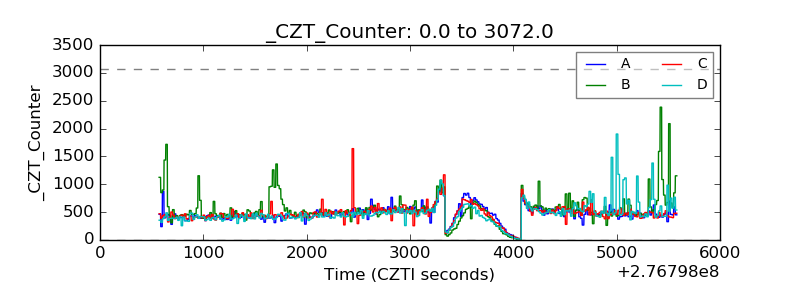 |
| +2.5 Volts monitor |  |
| +5 Volts monitor |  |
| _ROLL_ROT | 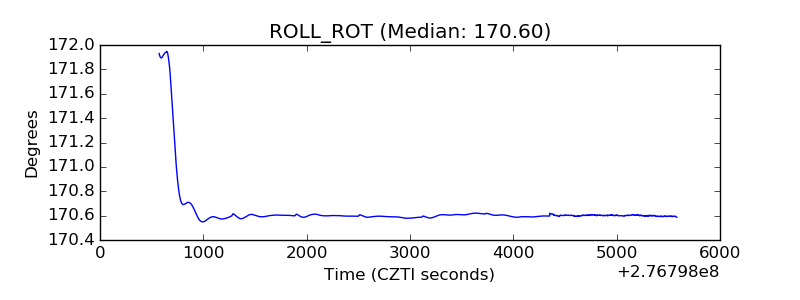 |
| _Roll_DEC | 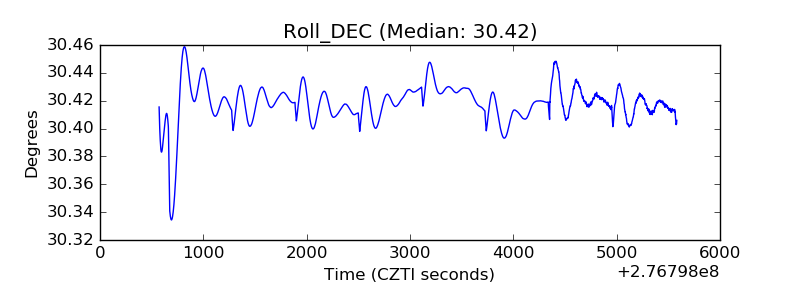 |
| _Roll_RA | 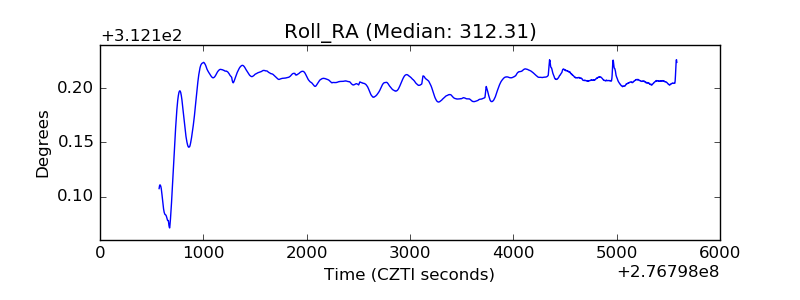 |
| Veto Counter | 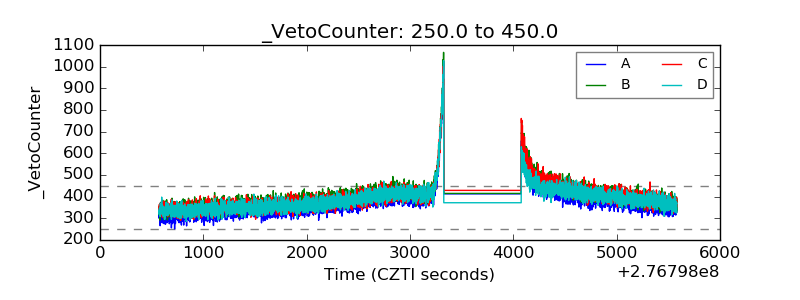 |