| Param | Original file | Final file |
|---|---|---|
| Filename | modeM0/AS1A05_069T02_9000002422_16394cztM0_level2.evt | modeM0/AS1A05_069T02_9000002422_16394cztM0_level2_quad_clean.evt |
| Size (bytes) | 482,855,040 | 92,975,040 |
| Size | 460.5 MB | 88.7 MB |
| Events in quadrant A | 3,401,193 | 596,608 |
| Events in quadrant B | 3,845,026 | 602,461 |
| Events in quadrant C | 3,402,396 | 581,369 |
| Events in quadrant D | 3,513,826 | 562,049 |
| Mode SS | |||
|---|---|---|---|
| Quadrant | BADHDUFLAG | Total packets | Discarded packets |
| A | 0 | 138 | 0 |
| B | 0 | 138 | 0 |
| C | 0 | 138 | 0 |
| D | 0 | 138 | 0 |
| Mode M0 | |||
|---|---|---|---|
| Quadrant | BADHDUFLAG | Total packets | Discarded packets |
| A | 0 | 14496 | 3 |
| B | 0 | 15849 | 2 |
| C | 0 | 14563 | 2 |
| D | 0 | 15065 | 2 |
| Mode M9 | |||
|---|---|---|---|
| Quadrant | BADHDUFLAG | Total packets | Discarded packets |
| A | 0 | 13 | 0 |
| B | 0 | 13 | 0 |
| C | 0 | 13 | 0 |
| D | 0 | 14 | 0 |
| Quadrant | Total seconds | Saturated seconds | Saturation percentage |
|---|---|---|---|
| A | 6785 | 49 | 0.722181% |
| B | 6785 | 138 | 2.033898% |
| C | 6785 | 82 | 1.208548% |
| D | 6785 | 68 | 1.002211% |
Noise dominated data is calculated using 1-second bins in cleaned event files. If a bin has >2000 counts, and if more than 50% of those come from <1% of pixels, then it is considered to be noise-dominated and hence unusable.
| Quadrant | # 1 sec bins | Bins with >0 counts | Bins with >2000 counts | High rate bins dominated by noise | Noise dominated (total time) | Noise dominated (detector-on time) | Marked lightcurve |
|---|---|---|---|---|---|---|---|
| A | 7701 | 6787 | 9 | 9 | 0.12% | 0.13% | 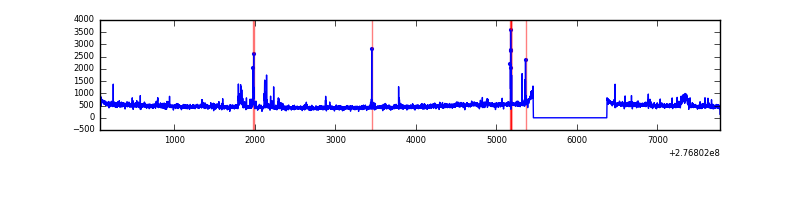 |
| B | 7701 | 6787 | 89 | 89 | 1.16% | 1.31% | 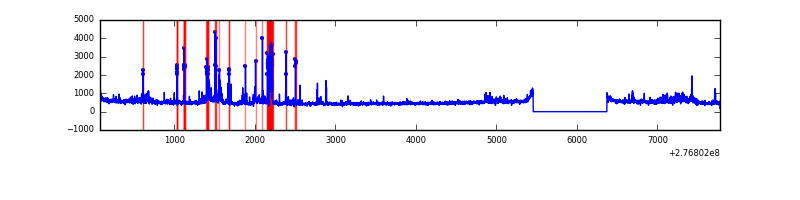 |
| C | 7701 | 6787 | 0 | 0 | 0.00% | 0.00% | 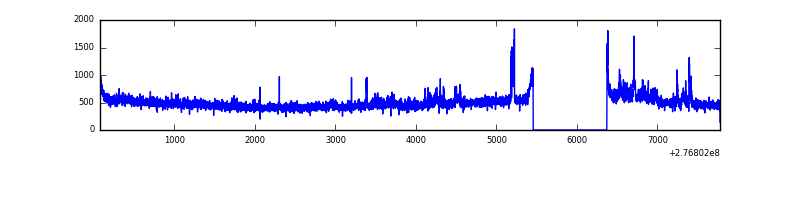 |
| D | 7701 | 6787 | 27 | 27 | 0.35% | 0.40% | 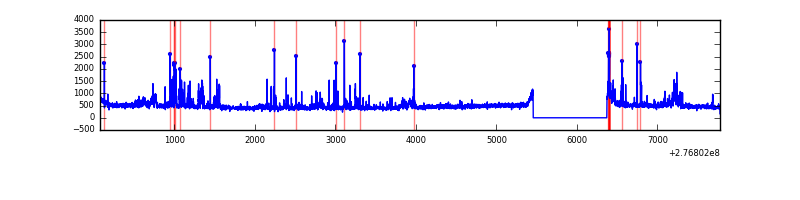 |
Top three noisy pixels from each quadrant. If the there are fewer than three noisy pixels in the level2.evt file, extra rows are filled as -1
| Pixel properties | Quadrant properties | ||||||
|---|---|---|---|---|---|---|---|
| Quadrant | DetID | PixID | Counts | Sigma | Mean | Median | Sigma |
| A | 9 | 143 | 100643 | 608.99 | 808 | 790 | 164.0 |
| A | 15 | 174 | 98803 | 597.77 | 808 | 790 | 164.0 |
| A | 15 | 223 | 73324 | 442.38 | 808 | 790 | 164.0 |
| B | 10 | 16 | 330609 | 2134.23 | 808 | 786 | 154.5 |
| B | 0 | 189 | 117512 | 755.31 | 808 | 786 | 154.5 |
| B | 3 | 209 | 99833 | 640.91 | 808 | 786 | 154.5 |
| C | 3 | 233 | 224625 | 1223.1 | 780 | 784 | 183.0 |
| C | 14 | 238 | 121800 | 661.25 | 780 | 784 | 183.0 |
| C | 7 | 247 | 9803 | 49.28 | 780 | 784 | 183.0 |
| D | 12 | 110 | 283351 | 1463.42 | 789 | 765 | 193.1 |
| D | 10 | 70 | 93649 | 481.01 | 789 | 765 | 193.1 |
| D | 1 | 52 | 41732 | 212.15 | 789 | 765 | 193.1 |
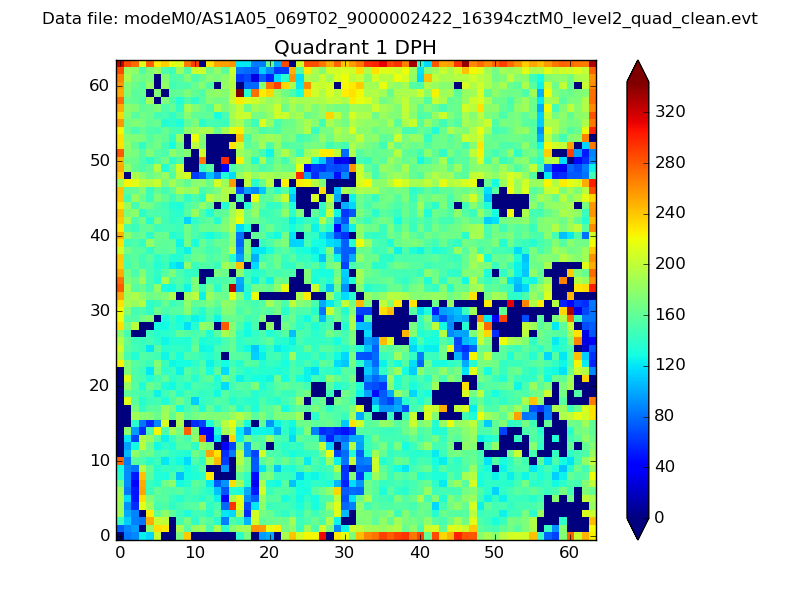
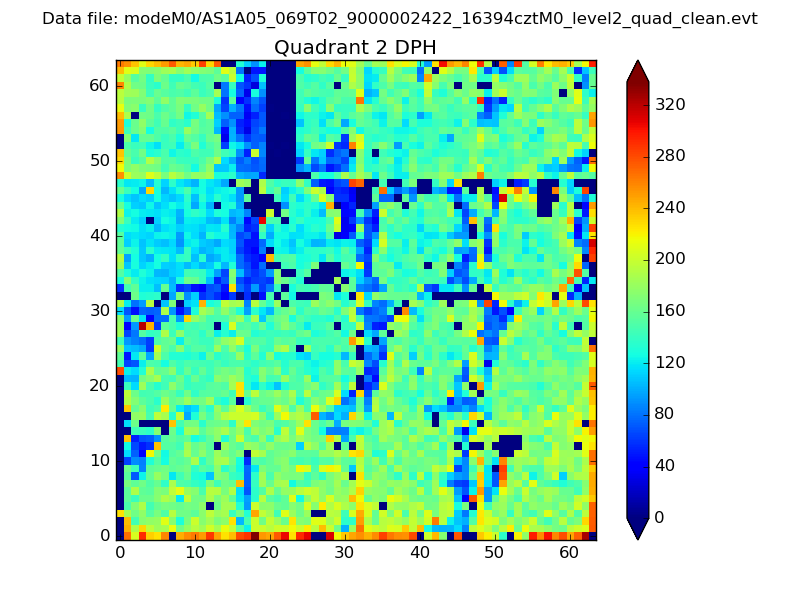
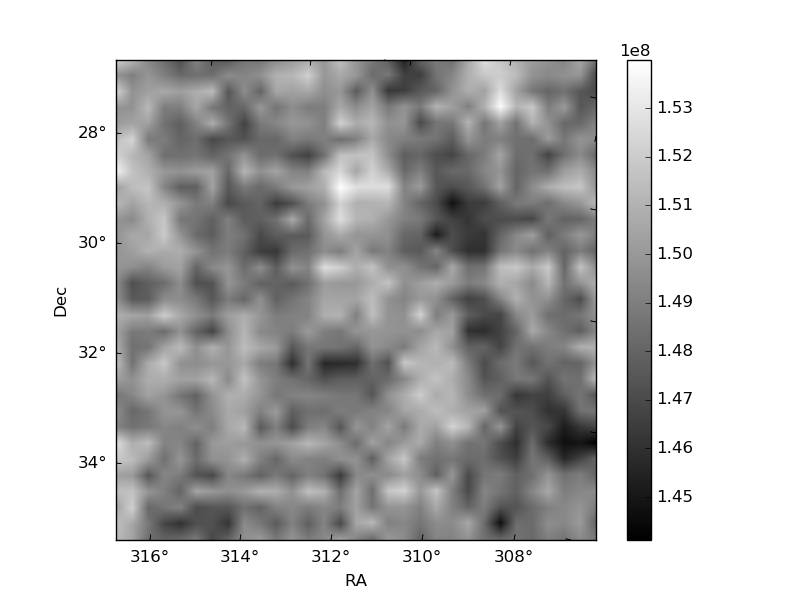
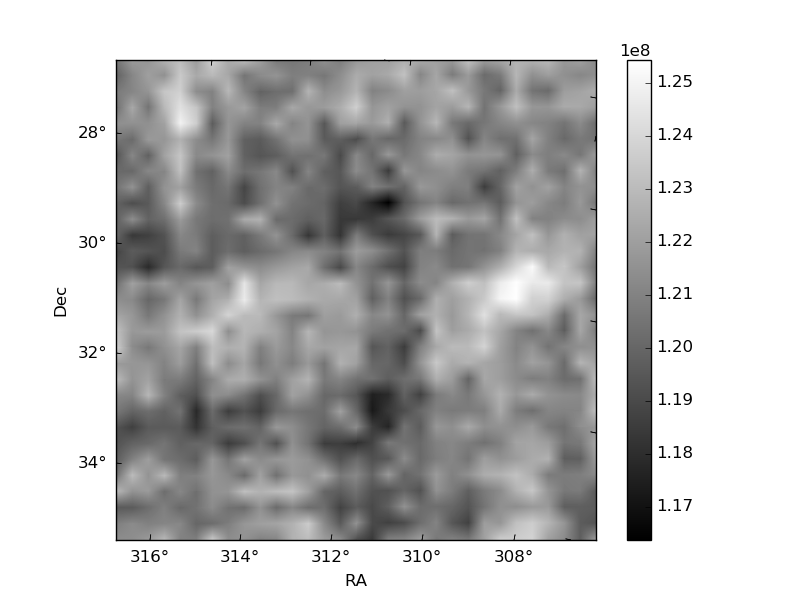
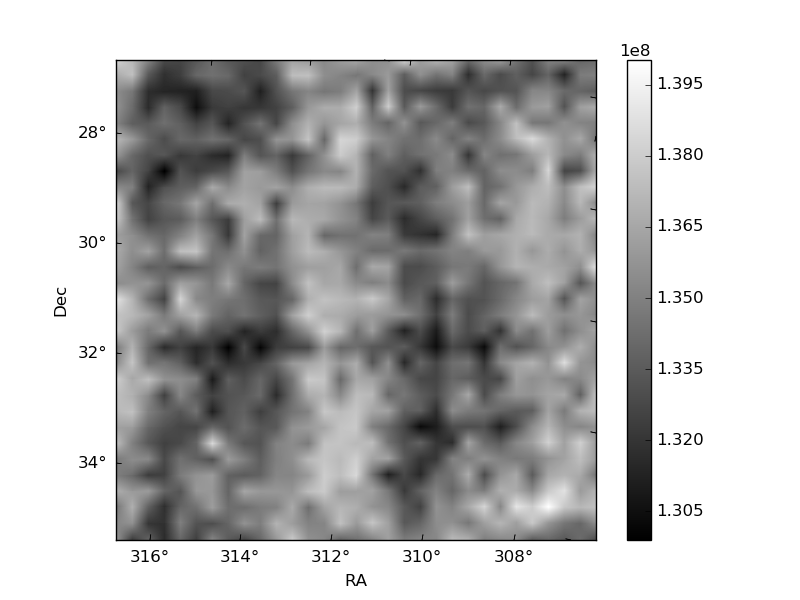
Histogram calculated using DETX and DETY for each event in the final _common_clean file
| Quadrant A |  |
 |
Quadrant B |
|---|---|---|---|
| Quadrant D | 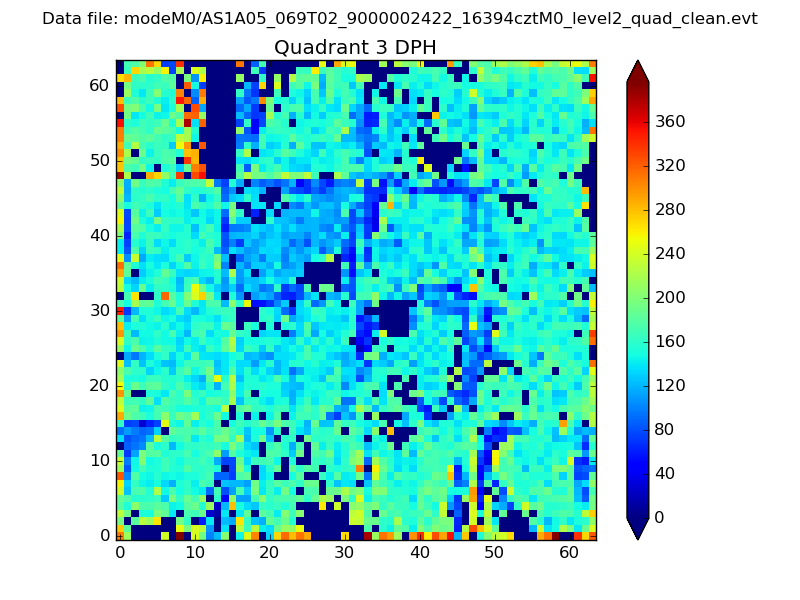 |
 |
Quadrant C |
| Plot type | Count rate plots | Images |
|---|---|---|
| Comparison with Poisson distribution Blue bars denote a histogram of data divided into 1 sec bins. Red curve is a Poisson curve with rate = median count rate of data. |
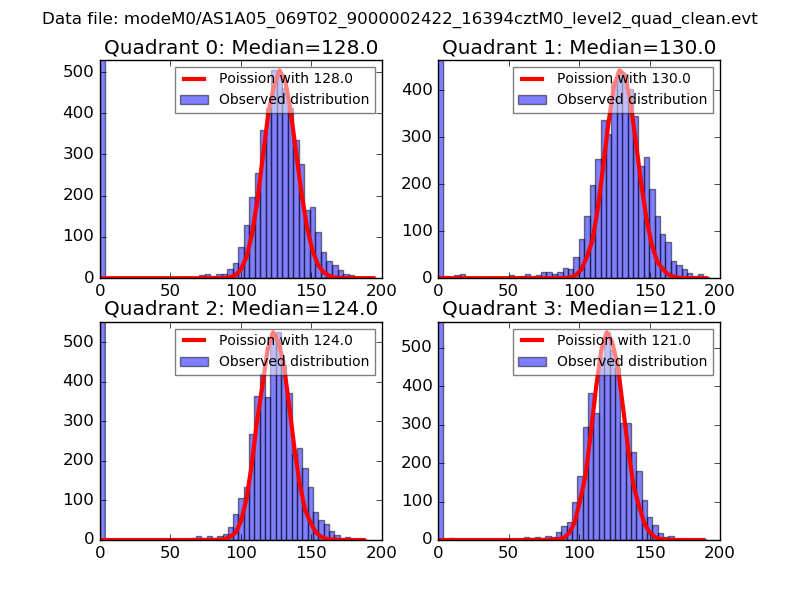 |
 |
| Quadrant-wise count rates Data is divided into 100 sec bins |
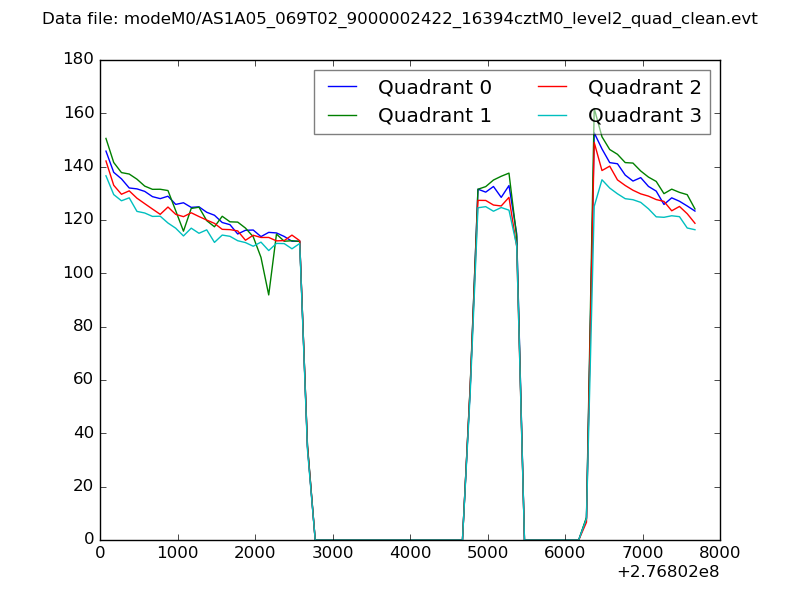 |
|
| Module-wise count rates for Quadrant A Data is divided into 100 sec bins |
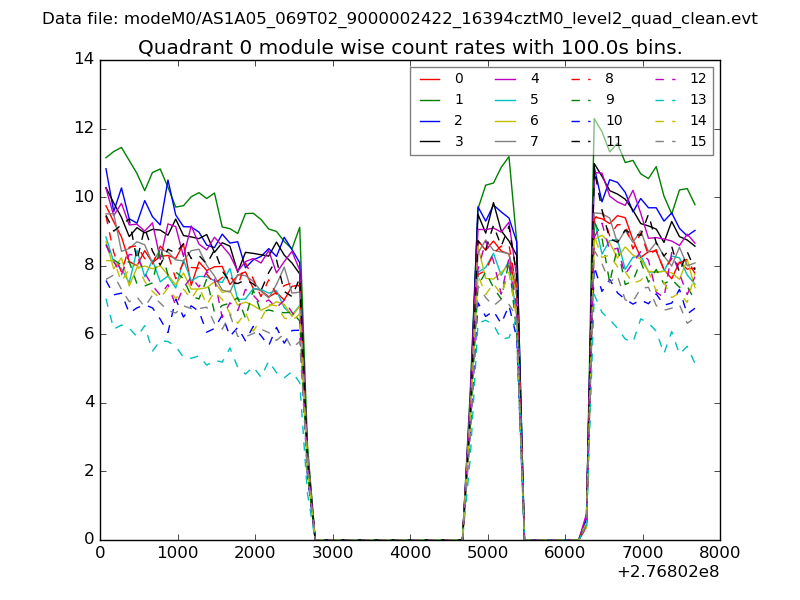 |
 |
| Module-wise count rates for Quadrant B Data is divided into 100 sec bins |
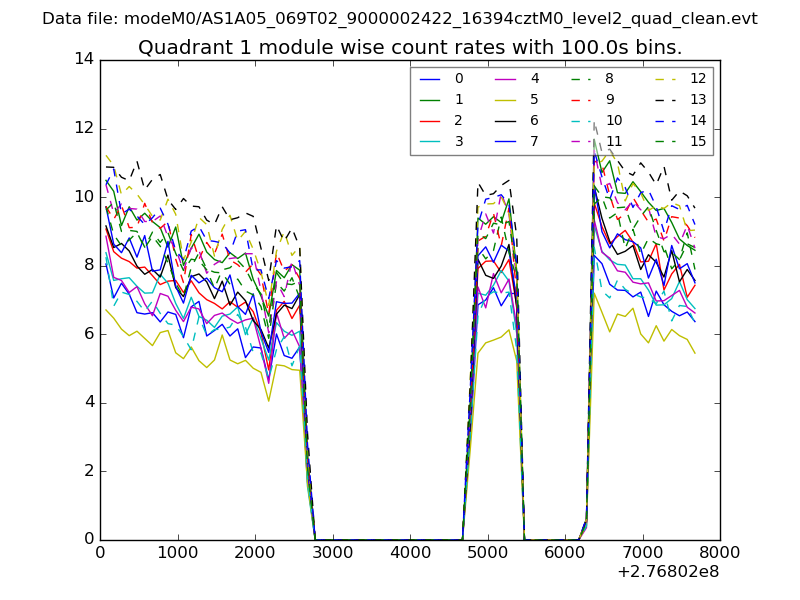 |
 |
| Module-wise count rates for Quadrant C Data is divided into 100 sec bins |
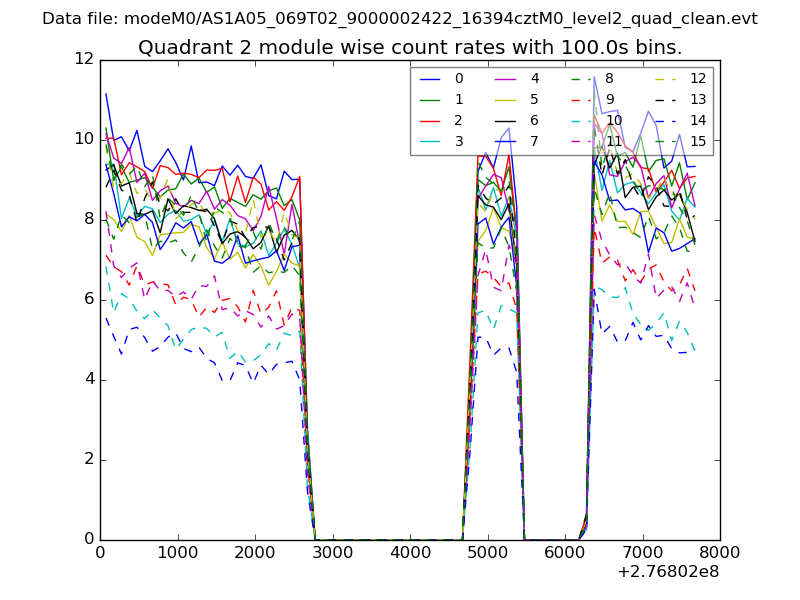 |
 |
| Module-wise count rates for Quadrant D Data is divided into 100 sec bins |
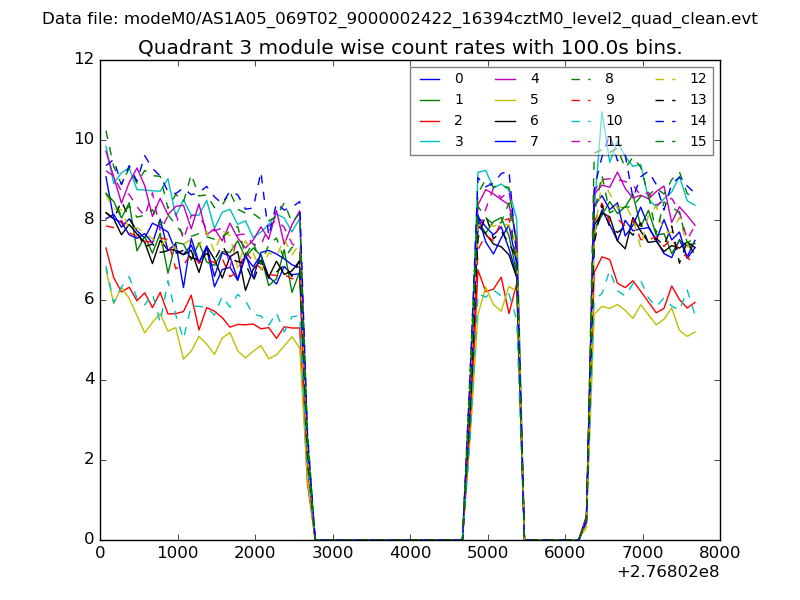 |
 |
| Parameter | Plot |
|---|---|
| CZT HV Monitor | 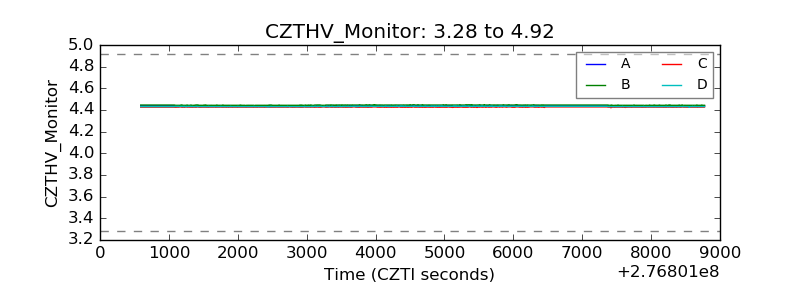 |
| D_VDD | 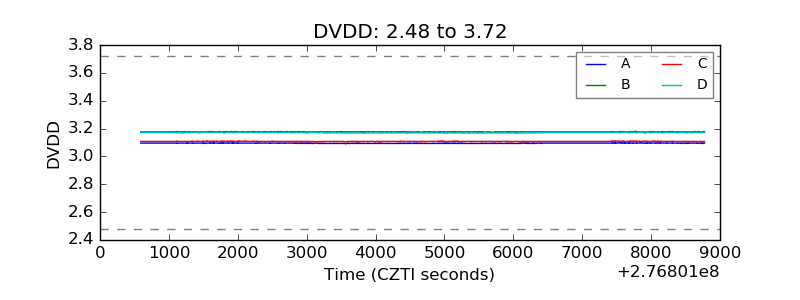 |
| Temperature 1 | 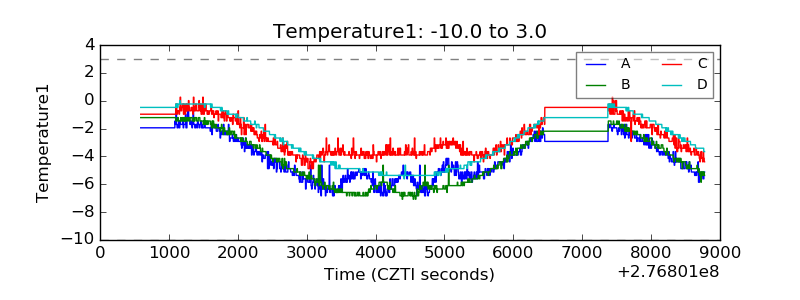 |
| Veto HV Monitor |  |
| Veto LLD | 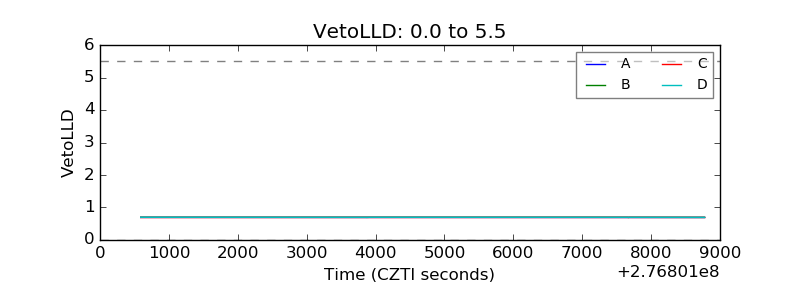 |
| Alpha Counter | 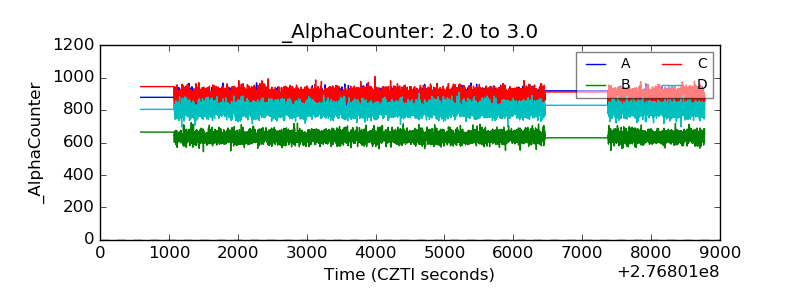 |
| _CPM_Rate | 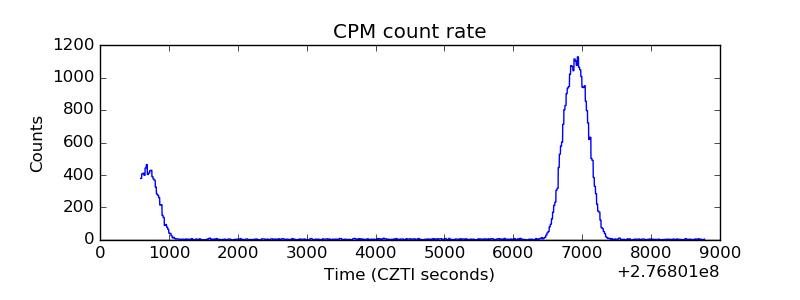 |
| CZT Counter | 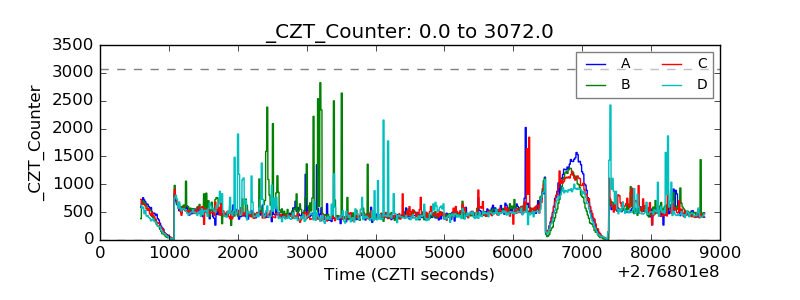 |
| +2.5 Volts monitor |  |
| +5 Volts monitor | 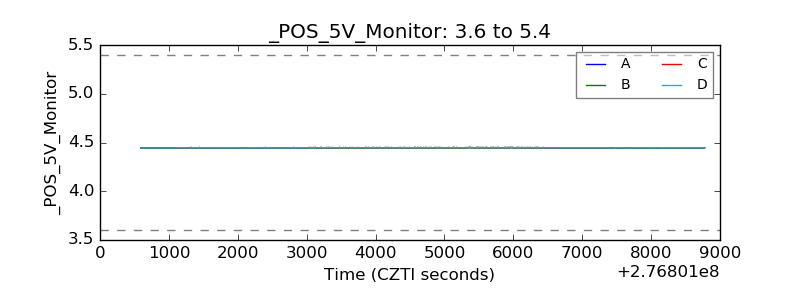 |
| _ROLL_ROT | 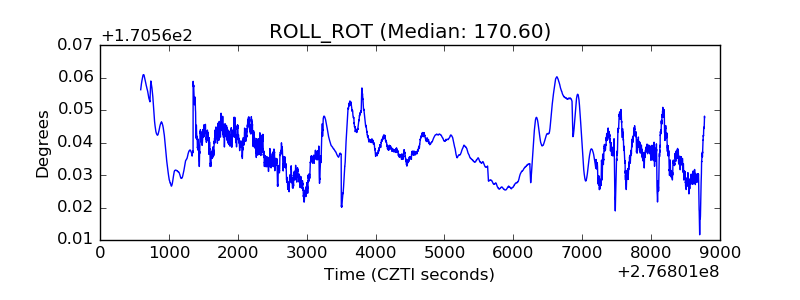 |
| _Roll_DEC | 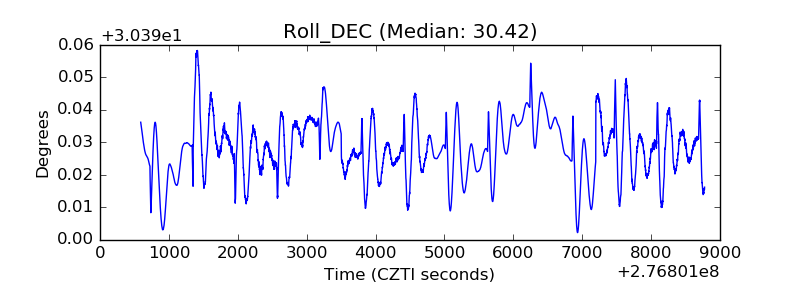 |
| _Roll_RA |  |
| Veto Counter | 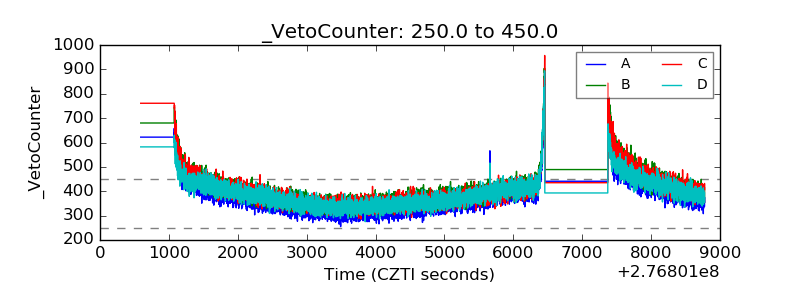 |