| Param | Original file | Final file |
|---|---|---|
| Filename | modeM0/AS1A05_069T02_9000002422_16398cztM0_level2.evt | modeM0/AS1A05_069T02_9000002422_16398cztM0_level2_quad_clean.evt |
| Size (bytes) | 436,469,760 | 85,567,680 |
| Size | 416.2 MB | 81.6 MB |
| Events in quadrant A | 3,115,614 | 550,326 |
| Events in quadrant B | 3,510,655 | 569,920 |
| Events in quadrant C | 3,171,539 | 533,676 |
| Events in quadrant D | 3,006,048 | 511,102 |
| Mode SS | |||
|---|---|---|---|
| Quadrant | BADHDUFLAG | Total packets | Discarded packets |
| A | 0 | 122 | 0 |
| B | 0 | 122 | 0 |
| C | 0 | 122 | 0 |
| D | 0 | 122 | 0 |
| Mode M0 | |||
|---|---|---|---|
| Quadrant | BADHDUFLAG | Total packets | Discarded packets |
| A | 0 | 13014 | 3 |
| B | 0 | 14401 | 2 |
| C | 0 | 13243 | 2 |
| D | 0 | 13041 | 2 |
| Mode M9 | |||
|---|---|---|---|
| Quadrant | BADHDUFLAG | Total packets | Discarded packets |
| A | 0 | 17 | 0 |
| B | 0 | 17 | 0 |
| C | 0 | 17 | 0 |
| D | 0 | 18 | 0 |
| Quadrant | Total seconds | Saturated seconds | Saturation percentage |
|---|---|---|---|
| A | 6111 | 11 | 0.180003% |
| B | 6111 | 30 | 0.490918% |
| C | 6111 | 42 | 0.687285% |
| D | 6111 | 38 | 0.621829% |
Noise dominated data is calculated using 1-second bins in cleaned event files. If a bin has >2000 counts, and if more than 50% of those come from <1% of pixels, then it is considered to be noise-dominated and hence unusable.
| Quadrant | # 1 sec bins | Bins with >0 counts | Bins with >2000 counts | High rate bins dominated by noise | Noise dominated (total time) | Noise dominated (detector-on time) | Marked lightcurve |
|---|---|---|---|---|---|---|---|
| A | 7437 | 6113 | 0 | 0 | 0.00% | 0.00% | 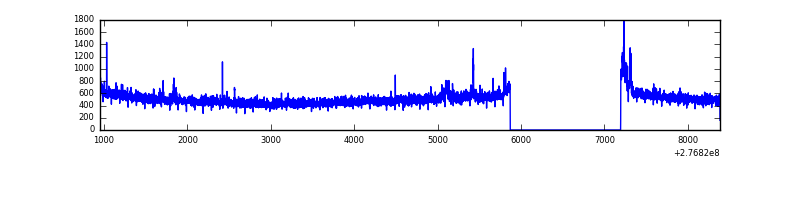 |
| B | 7437 | 6113 | 7 | 7 | 0.09% | 0.11% | 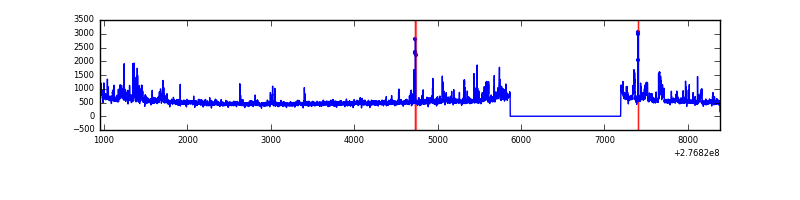 |
| C | 7437 | 6113 | 0 | 0 | 0.00% | 0.00% | 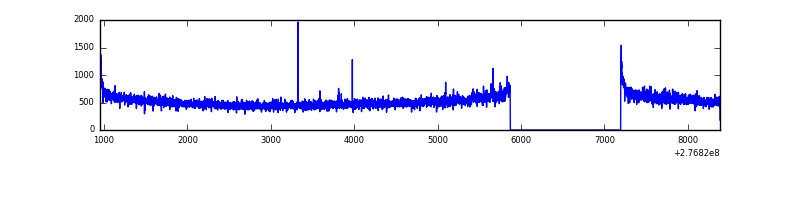 |
| D | 7437 | 6113 | 29 | 29 | 0.39% | 0.47% | 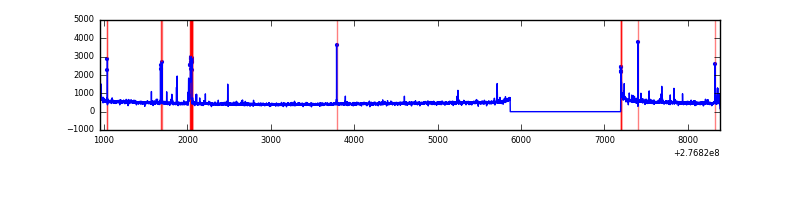 |
Top three noisy pixels from each quadrant. If the there are fewer than three noisy pixels in the level2.evt file, extra rows are filled as -1
| Pixel properties | Quadrant properties | ||||||
|---|---|---|---|---|---|---|---|
| Quadrant | DetID | PixID | Counts | Sigma | Mean | Median | Sigma |
| A | 15 | 174 | 80685 | 519.96 | 773 | 758 | 153.7 |
| A | 15 | 223 | 45221 | 289.25 | 773 | 758 | 153.7 |
| A | 15 | 239 | 17346 | 107.91 | 773 | 758 | 153.7 |
| B | 15 | 35 | 136536 | 916.18 | 785 | 767 | 148.2 |
| B | 10 | 16 | 79492 | 531.25 | 785 | 767 | 148.2 |
| B | 0 | 189 | 64338 | 428.98 | 785 | 767 | 148.2 |
| C | 3 | 233 | 136476 | 787.18 | 745 | 754 | 172.4 |
| C | 14 | 238 | 116896 | 673.62 | 745 | 754 | 172.4 |
| C | 10 | 169 | 10428 | 56.11 | 745 | 754 | 172.4 |
| D | 12 | 218 | 104329 | 573.52 | 742 | 722 | 180.7 |
| D | 10 | 70 | 27051 | 145.75 | 742 | 722 | 180.7 |
| D | 7 | 38 | 25058 | 134.71 | 742 | 722 | 180.7 |
Histogram calculated using DETX and DETY for each event in the final _common_clean file
| Quadrant A | 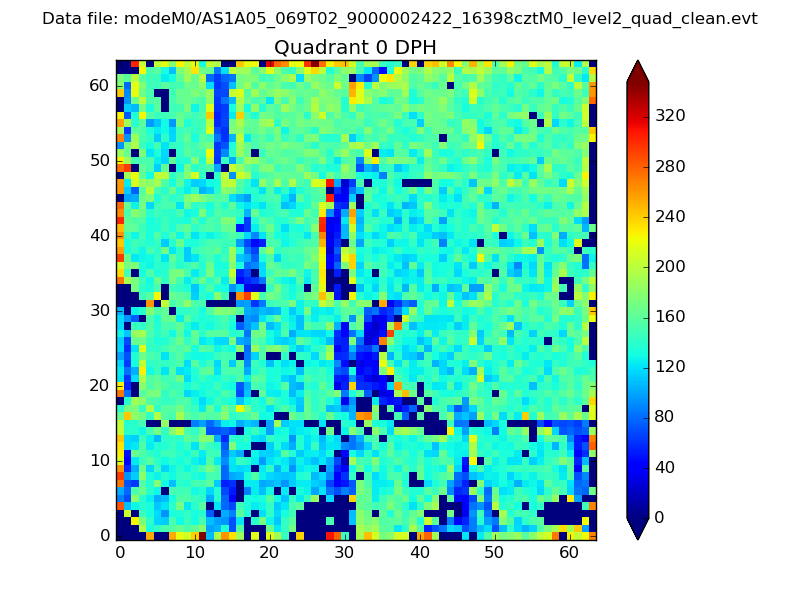 |
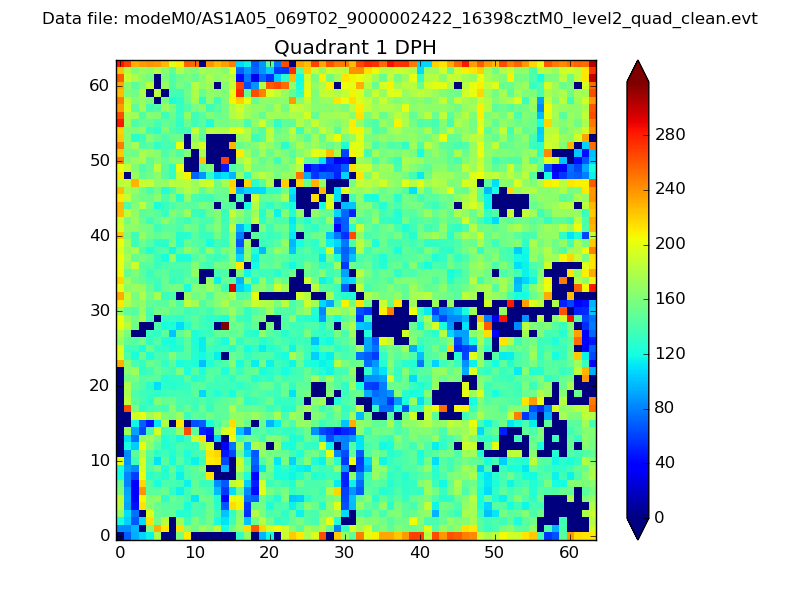 |
Quadrant B |
|---|---|---|---|
| Quadrant D | 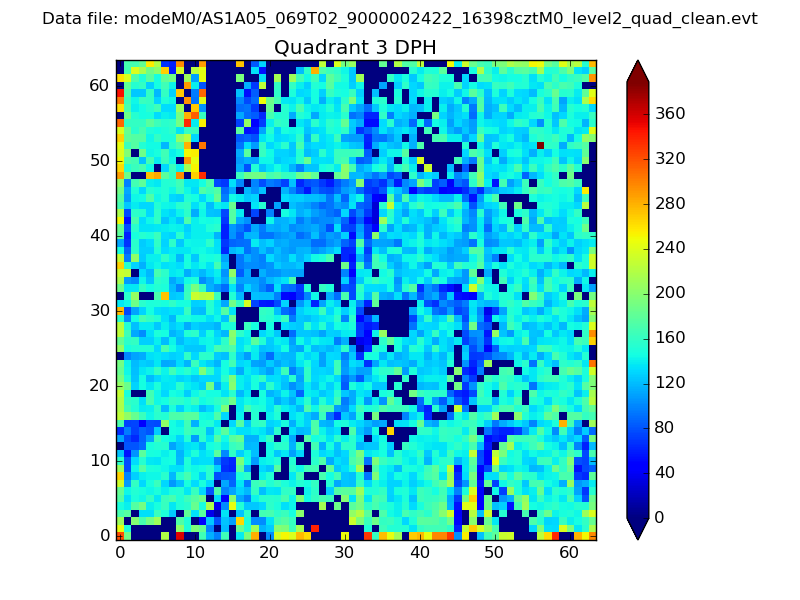 |
 |
Quadrant C |
| Plot type | Count rate plots | Images |
|---|---|---|
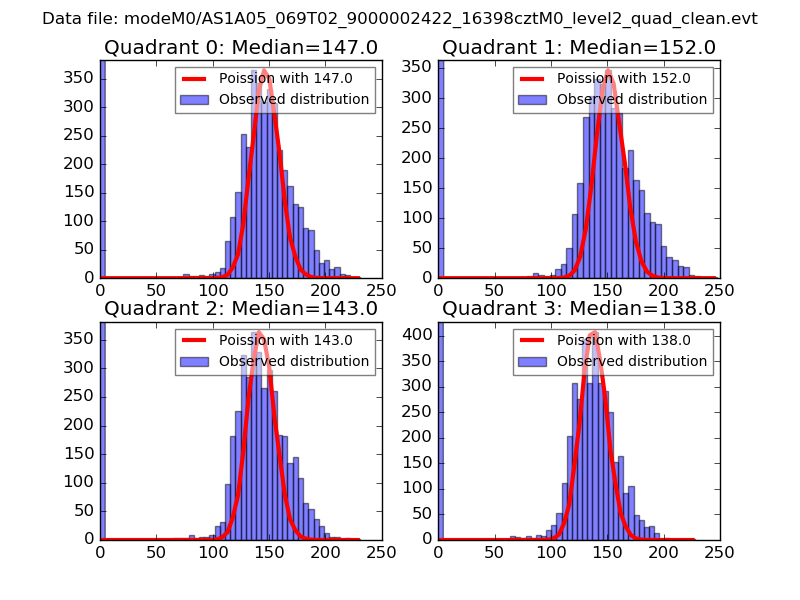
| Comparison with Poisson distribution Blue bars denote a histogram of data divided into 1 sec bins. Red curve is a Poisson curve with rate = median count rate of data. |
 |
 |
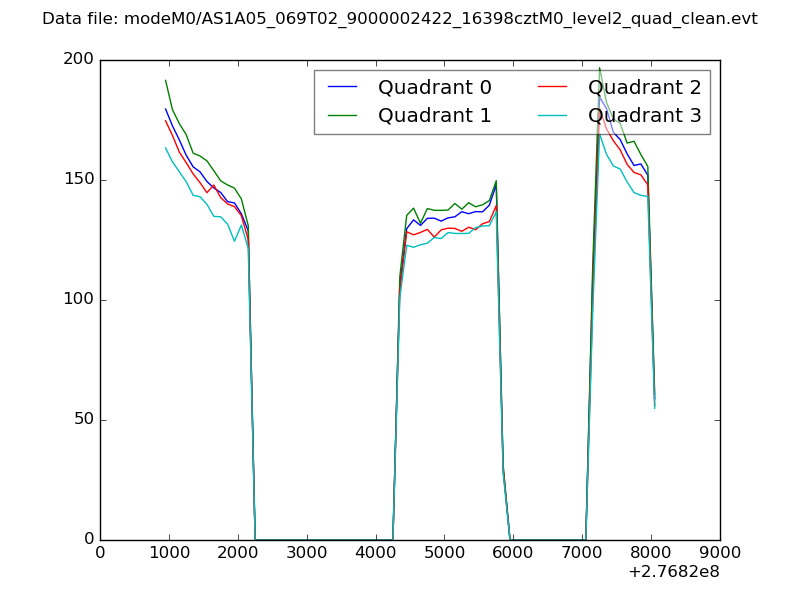
| Quadrant-wise count rates Data is divided into 100 sec bins |
 |
|
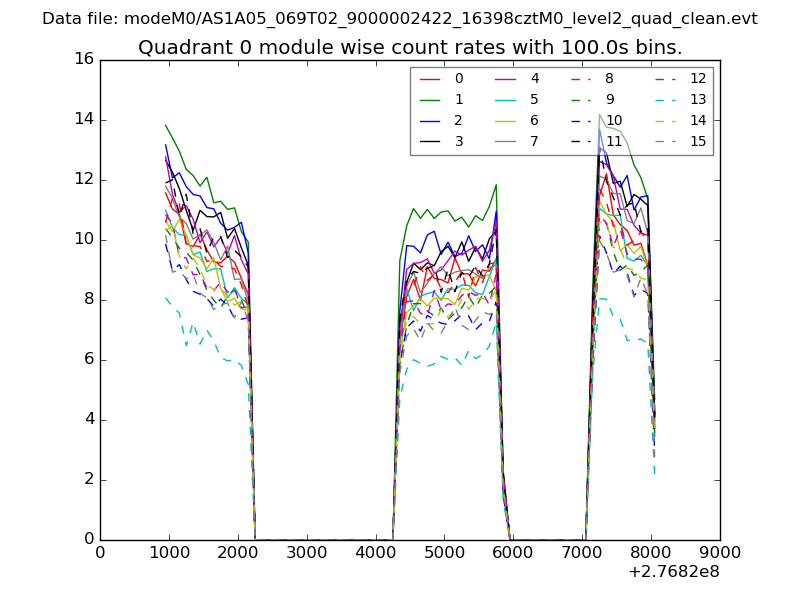
| Module-wise count rates for Quadrant A Data is divided into 100 sec bins |
 |
 |
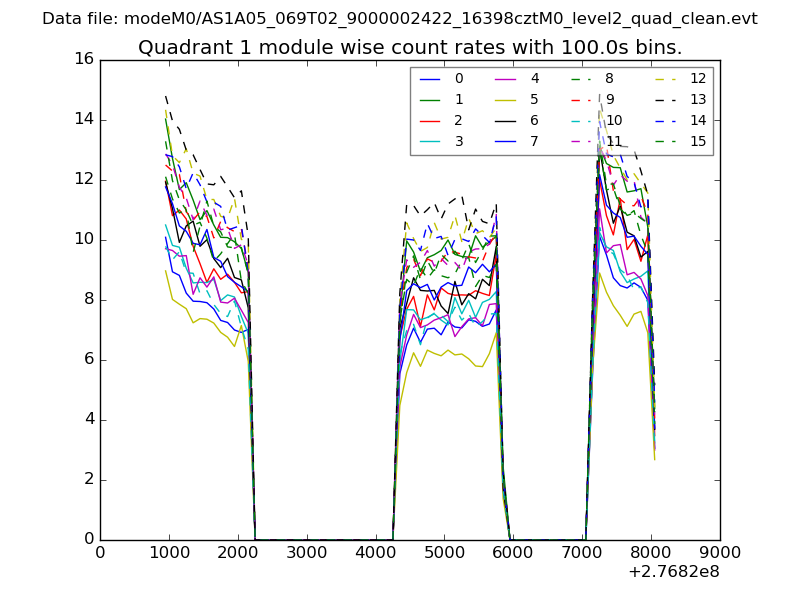
| Module-wise count rates for Quadrant B Data is divided into 100 sec bins |
 |
 |
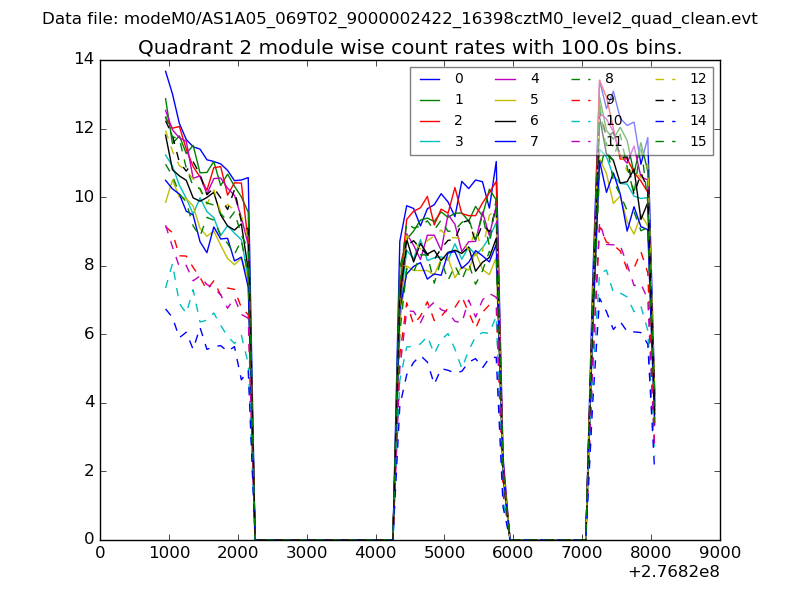
| Module-wise count rates for Quadrant C Data is divided into 100 sec bins |
 |
 |
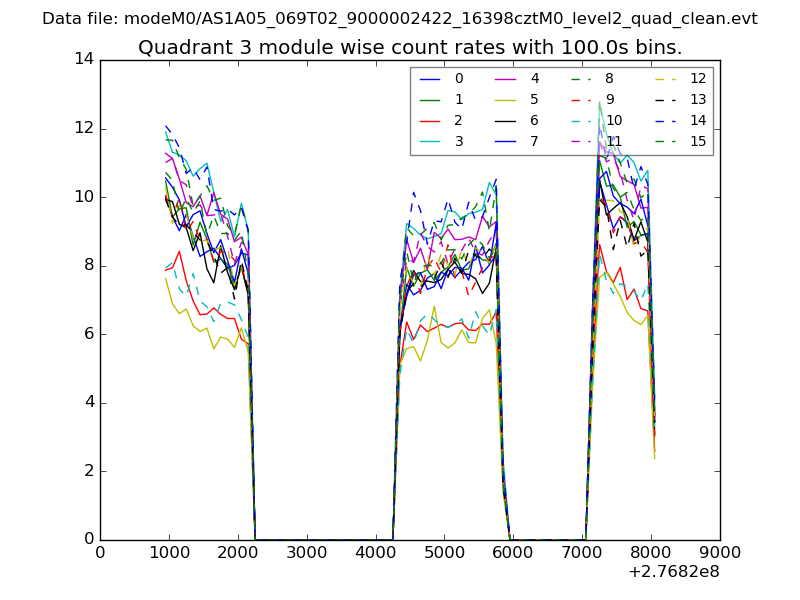
| Module-wise count rates for Quadrant D Data is divided into 100 sec bins |
 |
 |
| Parameter | Plot |
|---|---|
| CZT HV Monitor | 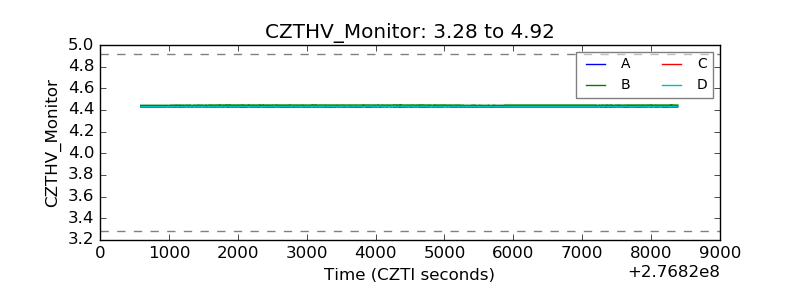 |
| D_VDD | 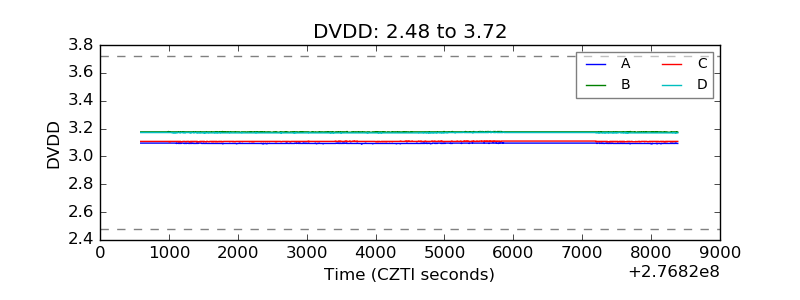 |
| Temperature 1 | 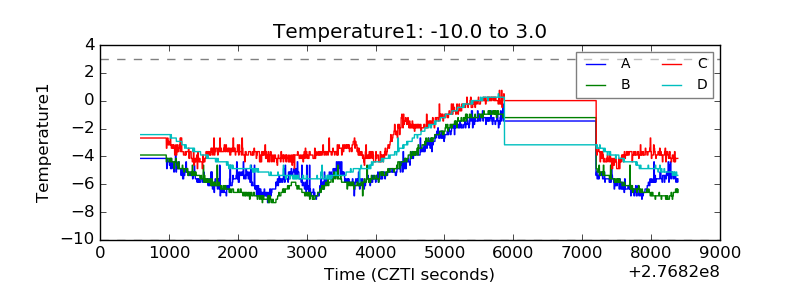 |
| Veto HV Monitor | 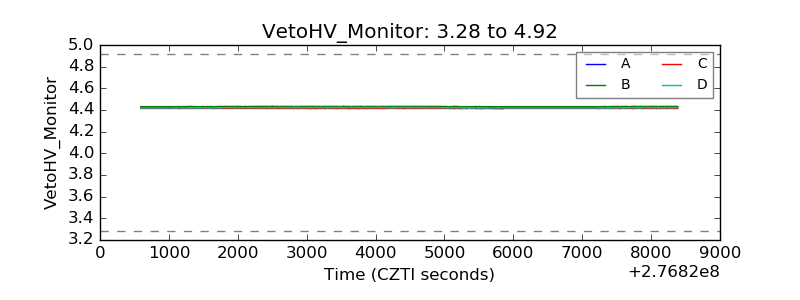 |
| Veto LLD | 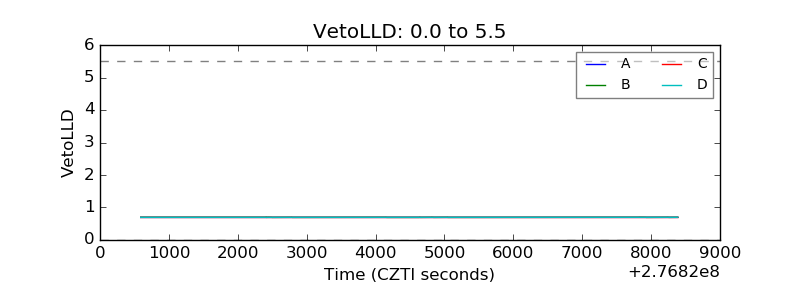 |
| Alpha Counter | 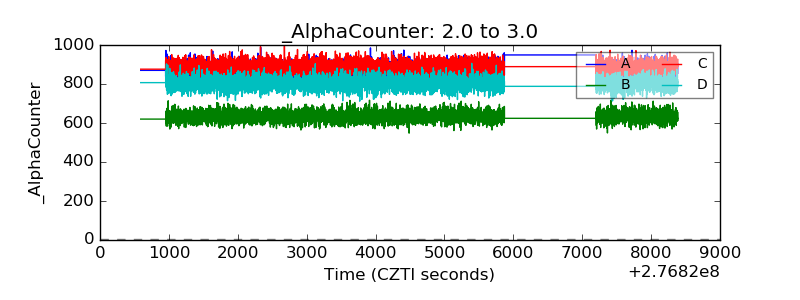 |
| _CPM_Rate | 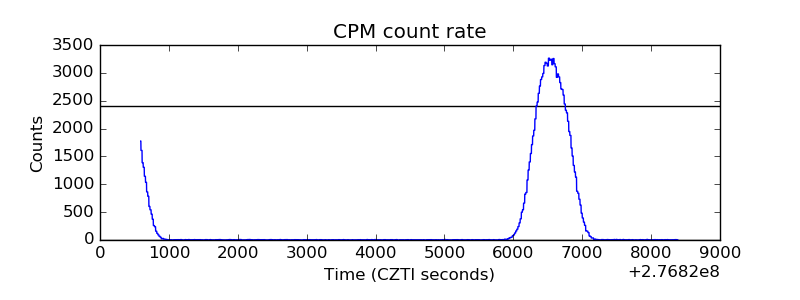 |
| CZT Counter |  |
| +2.5 Volts monitor |  |
| +5 Volts monitor | 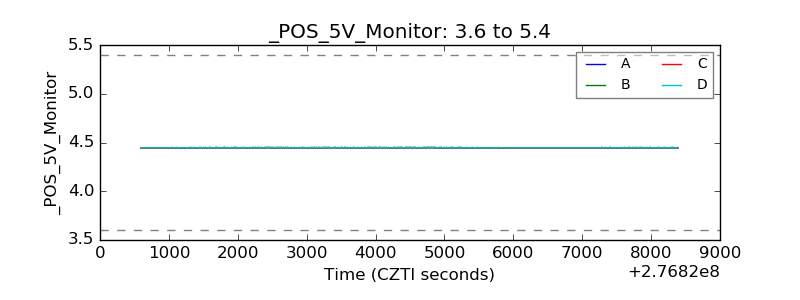 |
| _ROLL_ROT | 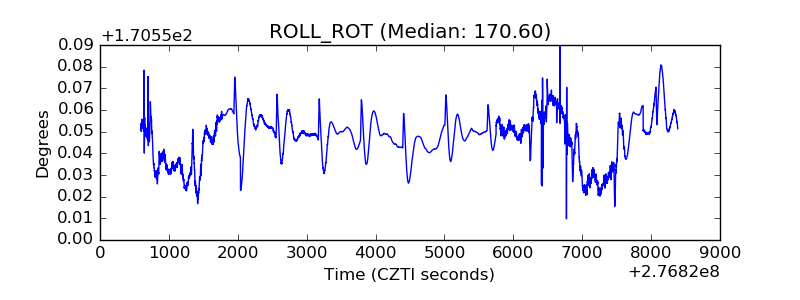 |
| _Roll_DEC | 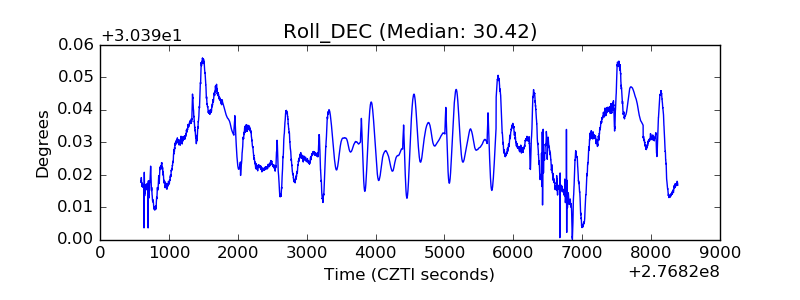 |
| _Roll_RA | 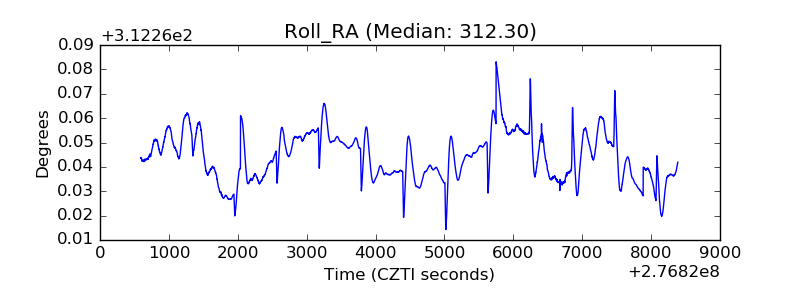 |
| Veto Counter | 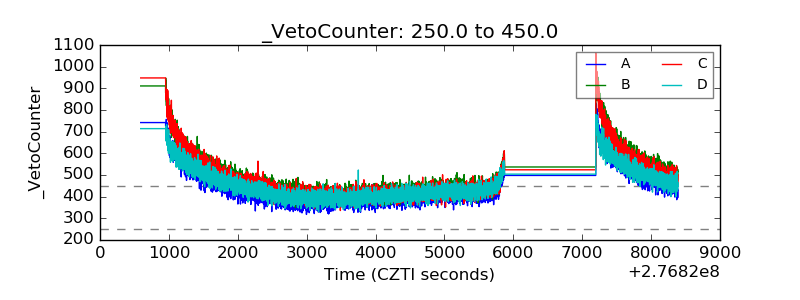 |