| Param | Original file | Final file |
|---|---|---|
| Filename | modeM0/AS1A05_069T02_9000002422_16399cztM0_level2.evt | modeM0/AS1A05_069T02_9000002422_16399cztM0_level2_quad_clean.evt |
| Size (bytes) | 476,625,600 | 79,153,920 |
| Size | 454.5 MB | 75.5 MB |
| Events in quadrant A | 3,378,097 | 498,263 |
| Events in quadrant B | 3,725,181 | 512,477 |
| Events in quadrant C | 3,426,505 | 478,099 |
| Events in quadrant D | 3,465,146 | 456,208 |
| Mode SS | |||
|---|---|---|---|
| Quadrant | BADHDUFLAG | Total packets | Discarded packets |
| A | 0 | 132 | 0 |
| B | 0 | 132 | 0 |
| C | 0 | 132 | 0 |
| D | 0 | 132 | 0 |
| Mode M0 | |||
|---|---|---|---|
| Quadrant | BADHDUFLAG | Total packets | Discarded packets |
| A | 0 | 13841 | 3 |
| B | 0 | 15120 | 2 |
| C | 0 | 13958 | 2 |
| D | 0 | 14596 | 2 |
| Mode M9 | |||
|---|---|---|---|
| Quadrant | BADHDUFLAG | Total packets | Discarded packets |
| A | 0 | 17 | 0 |
| B | 0 | 17 | 0 |
| C | 0 | 17 | 0 |
| D | 0 | 18 | 0 |
| Quadrant | Total seconds | Saturated seconds | Saturation percentage |
|---|---|---|---|
| A | 6474 | 42 | 0.648749% |
| B | 6474 | 77 | 1.189373% |
| C | 6474 | 86 | 1.328390% |
| D | 6474 | 143 | 2.208835% |
Noise dominated data is calculated using 1-second bins in cleaned event files. If a bin has >2000 counts, and if more than 50% of those come from <1% of pixels, then it is considered to be noise-dominated and hence unusable.
| Quadrant | # 1 sec bins | Bins with >0 counts | Bins with >2000 counts | High rate bins dominated by noise | Noise dominated (total time) | Noise dominated (detector-on time) | Marked lightcurve |
|---|---|---|---|---|---|---|---|
| A | 7810 | 6476 | 3 | 3 | 0.04% | 0.05% | 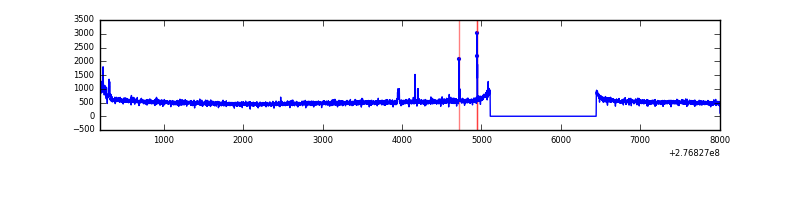 |
| B | 7810 | 6476 | 8 | 8 | 0.10% | 0.12% | 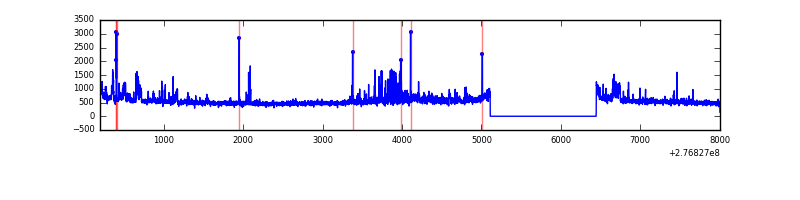 |
| C | 7810 | 6476 | 0 | 0 | 0.00% | 0.00% | 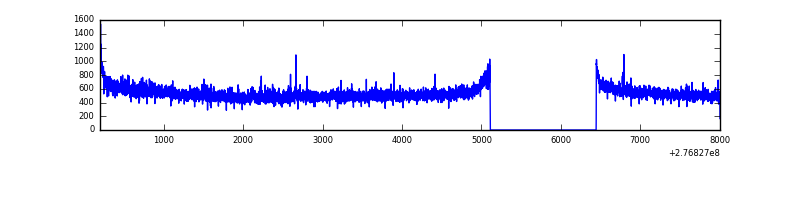 |
| D | 7810 | 6476 | 97 | 97 | 1.24% | 1.50% | 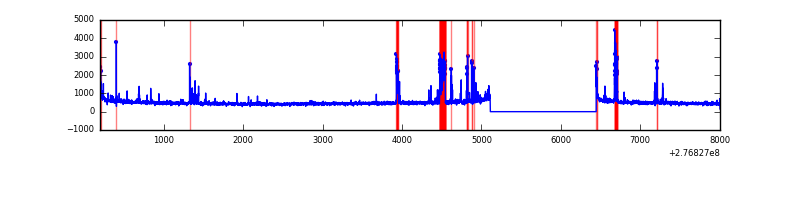 |
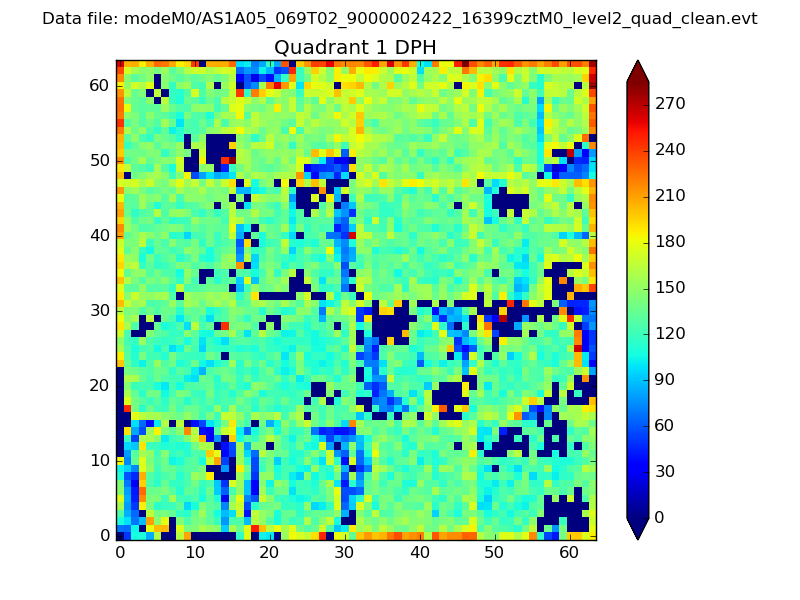
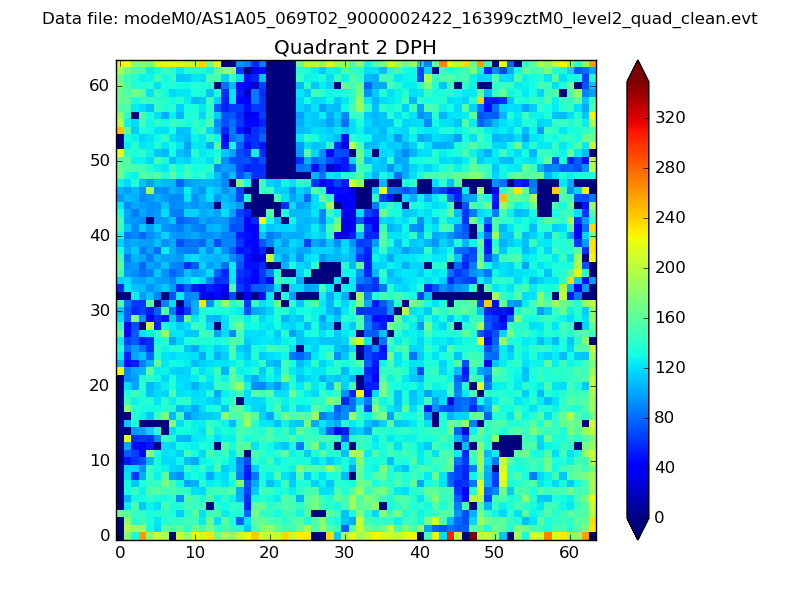
Top three noisy pixels from each quadrant. If the there are fewer than three noisy pixels in the level2.evt file, extra rows are filled as -1
| Pixel properties | Quadrant properties | ||||||
|---|---|---|---|---|---|---|---|
| Quadrant | DetID | PixID | Counts | Sigma | Mean | Median | Sigma |
| A | 15 | 174 | 64279 | 379.12 | 840 | 823 | 167.4 |
| A | 15 | 223 | 57364 | 337.81 | 840 | 823 | 167.4 |
| A | 15 | 239 | 25939 | 150.06 | 840 | 823 | 167.4 |
| B | 15 | 35 | 128562 | 804.8 | 850 | 834 | 158.7 |
| B | 4 | 173 | 76232 | 475.07 | 850 | 834 | 158.7 |
| B | 0 | 189 | 53504 | 331.87 | 850 | 834 | 158.7 |
| C | 3 | 233 | 149777 | 795.42 | 806 | 814 | 187.3 |
| C | 14 | 238 | 126978 | 673.68 | 806 | 814 | 187.3 |
| C | 10 | 169 | 6828 | 32.11 | 806 | 814 | 187.3 |
| D | 10 | 70 | 239474 | 1232.52 | 798 | 776 | 193.7 |
| D | 12 | 218 | 124410 | 638.39 | 798 | 776 | 193.7 |
| D | 13 | 168 | 42775 | 216.86 | 798 | 776 | 193.7 |
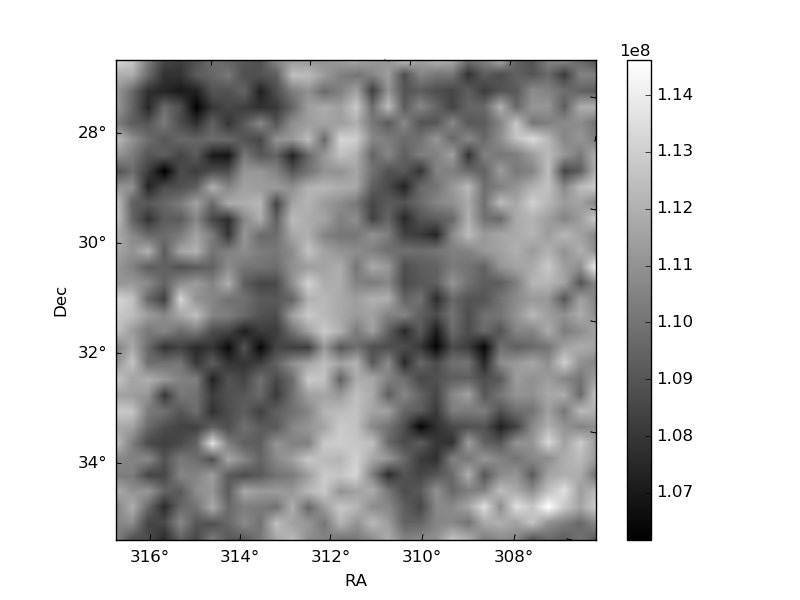
Histogram calculated using DETX and DETY for each event in the final _common_clean file
| Quadrant A | 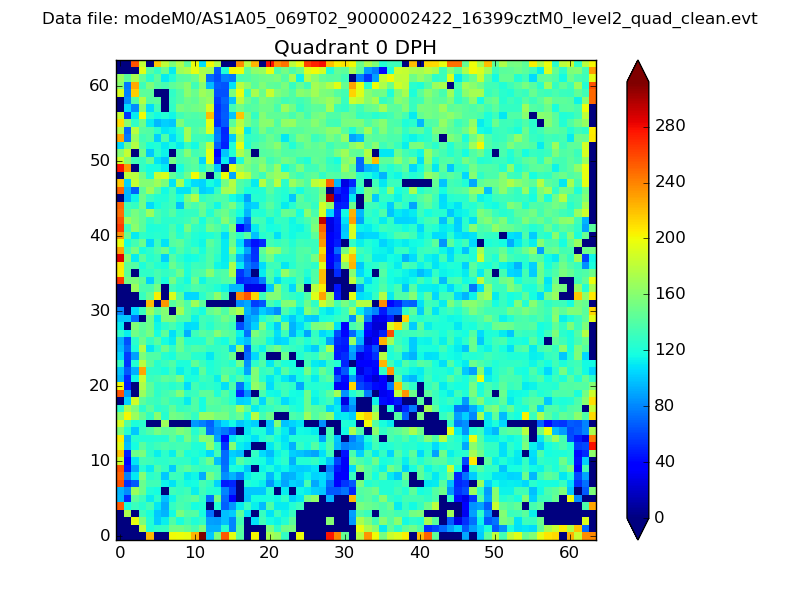 |
 |
Quadrant B |
|---|---|---|---|
| Quadrant D | 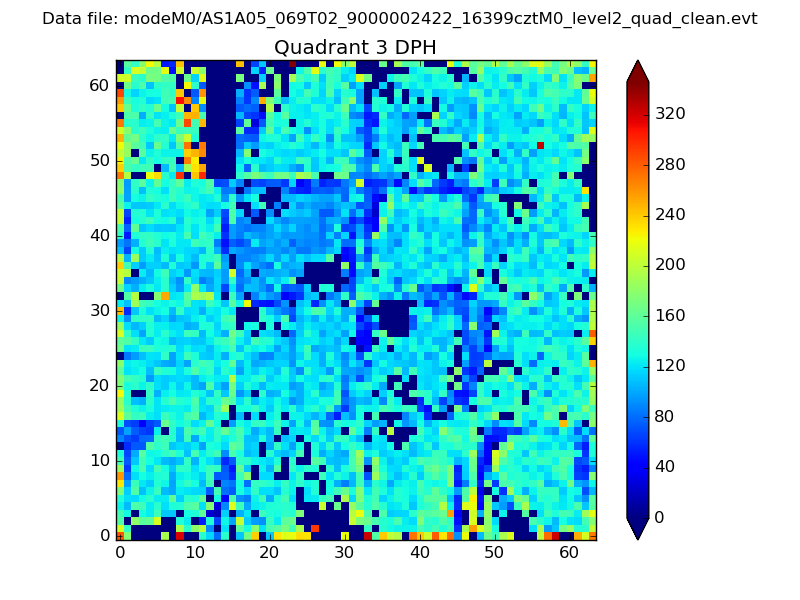 |
 |
Quadrant C |
| Plot type | Count rate plots | Images |
|---|---|---|
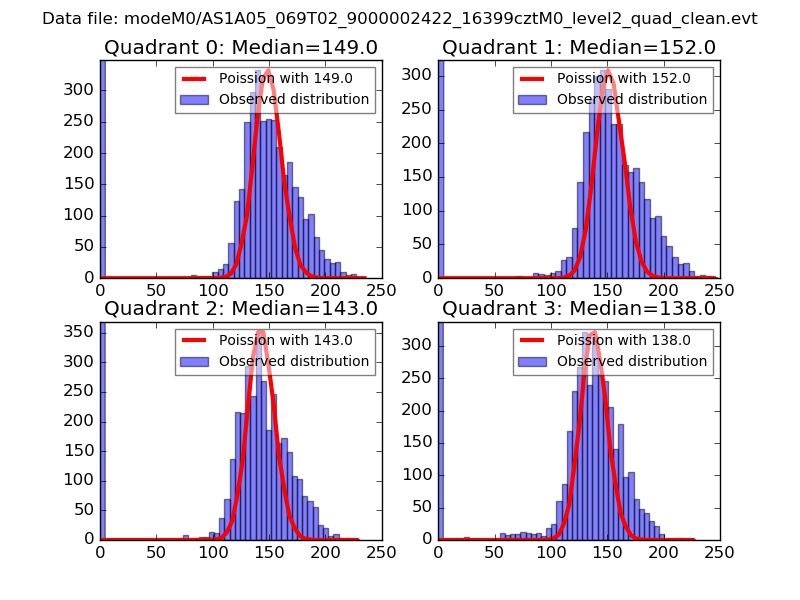
| Comparison with Poisson distribution Blue bars denote a histogram of data divided into 1 sec bins. Red curve is a Poisson curve with rate = median count rate of data. |
 |
 |
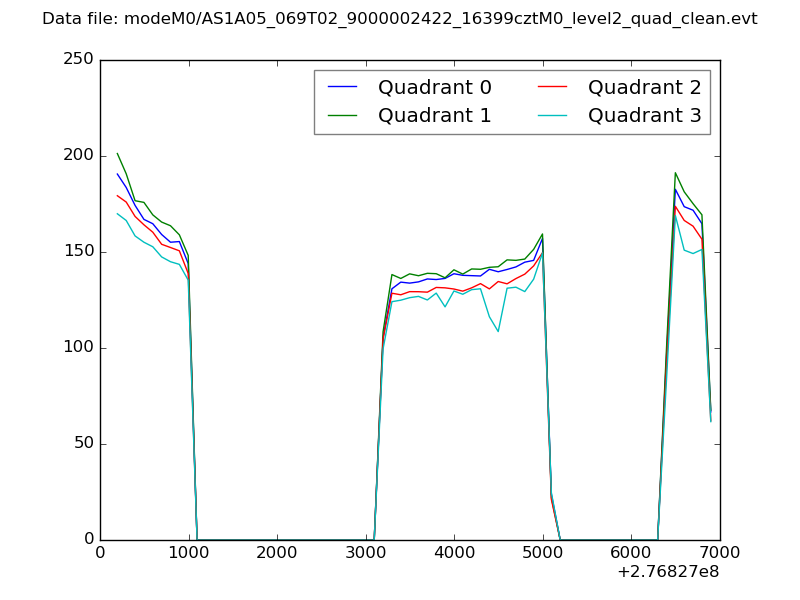
| Quadrant-wise count rates Data is divided into 100 sec bins |
 |
|
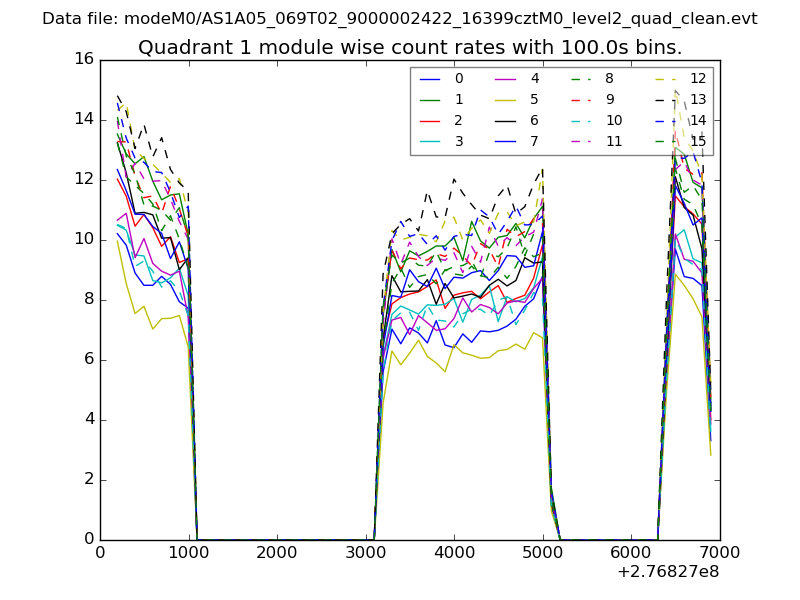
| Module-wise count rates for Quadrant A Data is divided into 100 sec bins |
 |
 |
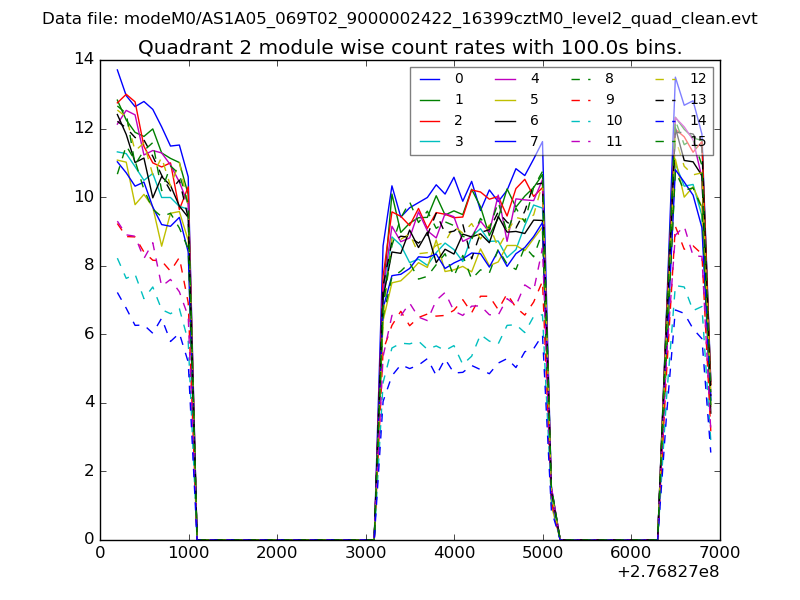
| Module-wise count rates for Quadrant B Data is divided into 100 sec bins |
 |
 |
| Module-wise count rates for Quadrant C Data is divided into 100 sec bins |
 |
 |
| Module-wise count rates for Quadrant D Data is divided into 100 sec bins |
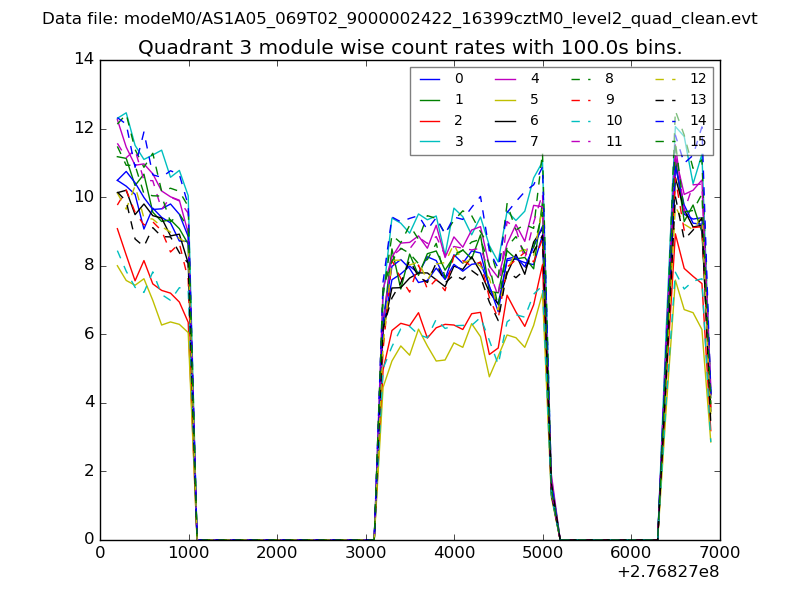 |
 |
| Parameter | Plot |
|---|---|
| CZT HV Monitor | 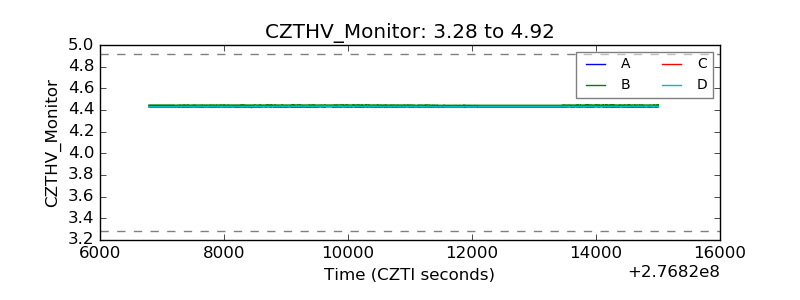 |
| D_VDD | 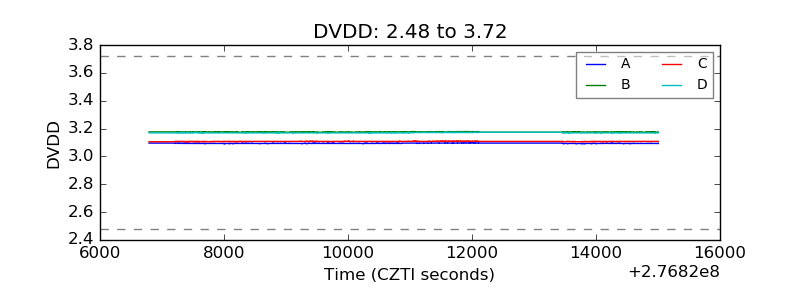 |
| Temperature 1 | 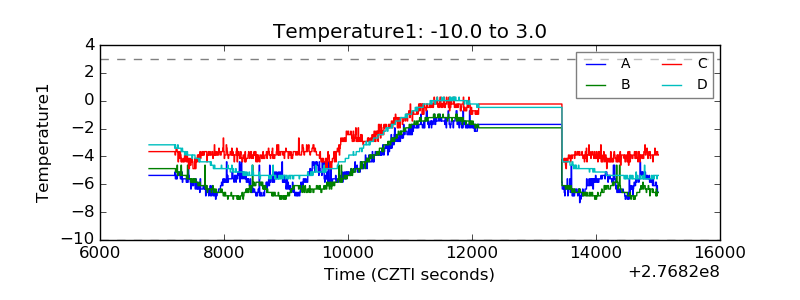 |
| Veto HV Monitor | 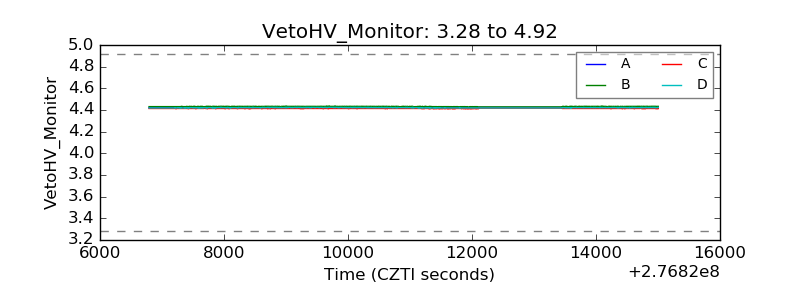 |
| Veto LLD | 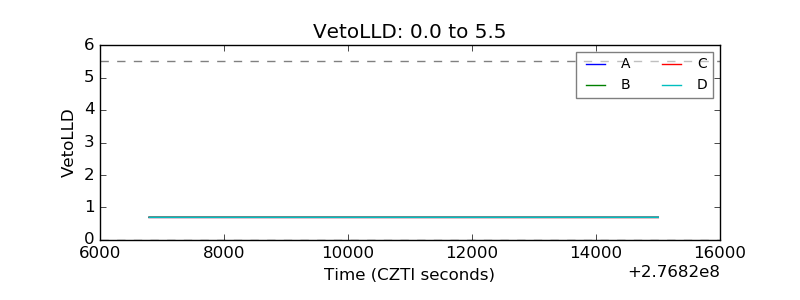 |
| Alpha Counter | 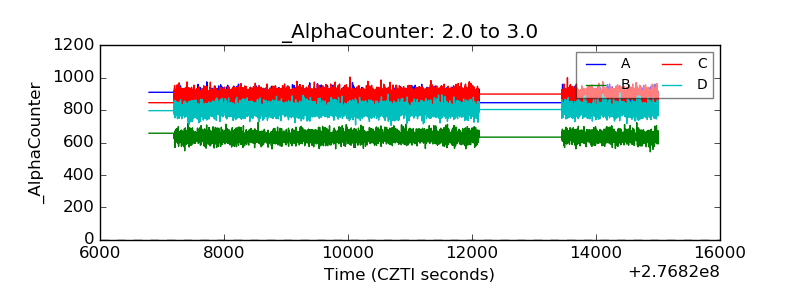 |
| _CPM_Rate |  |
| CZT Counter | 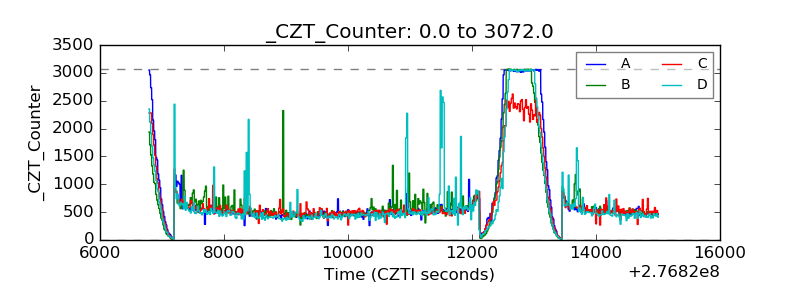 |
| +2.5 Volts monitor |  |
| +5 Volts monitor |  |
| _ROLL_ROT |  |
| _Roll_DEC | 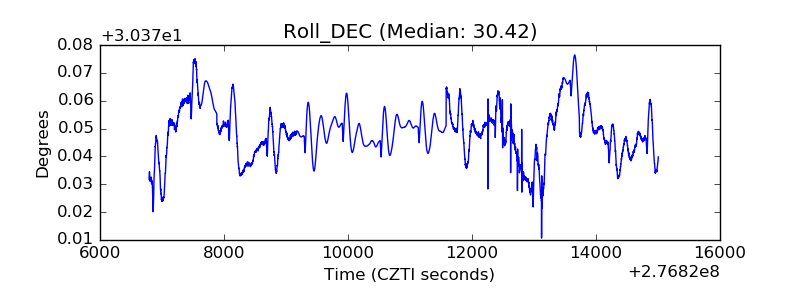 |
| _Roll_RA | 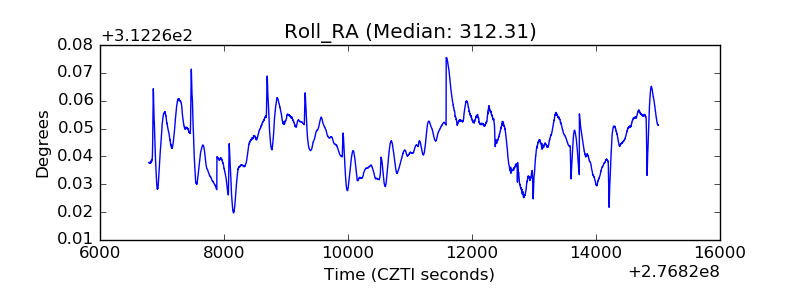 |
| Veto Counter |  |