| Param | Original file | Final file |
|---|---|---|
| Filename | modeM0/AS1A05_069T02_9000002422_16400cztM0_level2.evt | modeM0/AS1A05_069T02_9000002422_16400cztM0_level2_quad_clean.evt |
| Size (bytes) | 498,867,840 | 67,101,120 |
| Size | 475.8 MB | 64.0 MB |
| Events in quadrant A | 3,720,998 | 402,275 |
| Events in quadrant B | 3,861,221 | 417,348 |
| Events in quadrant C | 3,484,398 | 396,064 |
| Events in quadrant D | 3,615,474 | 377,446 |
| Mode SS | |||
|---|---|---|---|
| Quadrant | BADHDUFLAG | Total packets | Discarded packets |
| A | 0 | 128 | 0 |
| B | 0 | 128 | 0 |
| C | 0 | 128 | 0 |
| D | 0 | 128 | 0 |
| Mode M0 | |||
|---|---|---|---|
| Quadrant | BADHDUFLAG | Total packets | Discarded packets |
| A | 0 | 14800 | 3 |
| B | 0 | 15260 | 2 |
| C | 0 | 14088 | 2 |
| D | 0 | 14882 | 2 |
| Mode M9 | |||
|---|---|---|---|
| Quadrant | BADHDUFLAG | Total packets | Discarded packets |
| A | 0 | 17 | 0 |
| B | 0 | 17 | 0 |
| C | 0 | 17 | 0 |
| D | 0 | 18 | 0 |
| Quadrant | Total seconds | Saturated seconds | Saturation percentage |
|---|---|---|---|
| A | 6278 | 251 | 3.998089% |
| B | 6278 | 192 | 3.058299% |
| C | 6278 | 56 | 0.892004% |
| D | 6278 | 115 | 1.831794% |
Noise dominated data is calculated using 1-second bins in cleaned event files. If a bin has >2000 counts, and if more than 50% of those come from <1% of pixels, then it is considered to be noise-dominated and hence unusable.
| Quadrant | # 1 sec bins | Bins with >0 counts | Bins with >2000 counts | High rate bins dominated by noise | Noise dominated (total time) | Noise dominated (detector-on time) | Marked lightcurve |
|---|---|---|---|---|---|---|---|
| A | 7654 | 6280 | 177 | 177 | 2.31% | 2.82% | 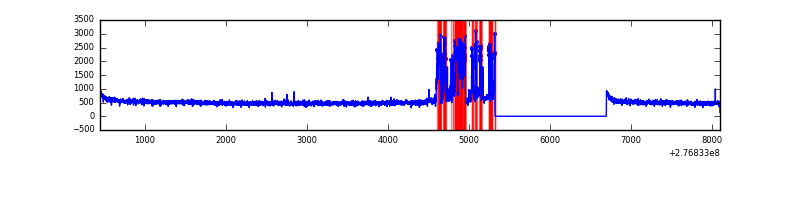 |
| B | 7654 | 6280 | 95 | 95 | 1.24% | 1.51% | 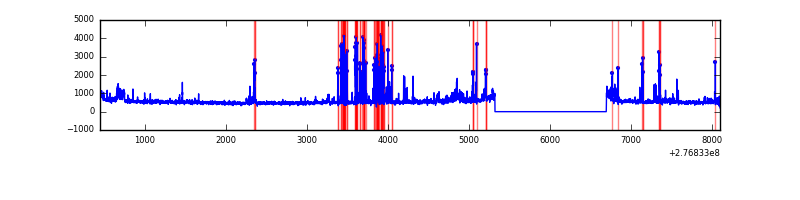 |
| C | 7654 | 6280 | 0 | 0 | 0.00% | 0.00% | 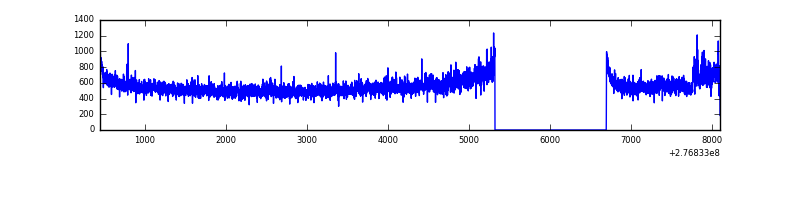 |
| D | 7654 | 6280 | 77 | 77 | 1.01% | 1.23% | 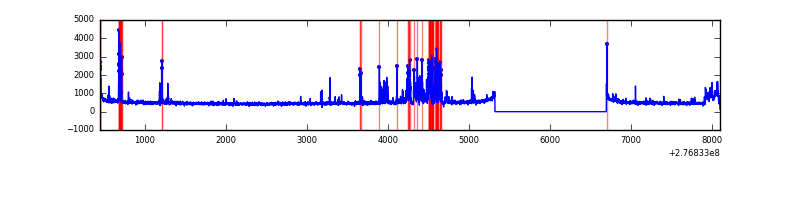 |
Top three noisy pixels from each quadrant. If the there are fewer than three noisy pixels in the level2.evt file, extra rows are filled as -1
| Pixel properties | Quadrant properties | ||||||
|---|---|---|---|---|---|---|---|
| Quadrant | DetID | PixID | Counts | Sigma | Mean | Median | Sigma |
| A | 15 | 174 | 595585 | 3710.98 | 804 | 791 | 160.3 |
| A | 15 | 223 | 28279 | 171.5 | 804 | 791 | 160.3 |
| A | 15 | 239 | 10372 | 59.78 | 804 | 791 | 160.3 |
| B | 0 | 229 | 351619 | 2287.71 | 815 | 797 | 153.4 |
| B | 15 | 35 | 78985 | 509.86 | 815 | 797 | 153.4 |
| B | 4 | 216 | 51126 | 328.19 | 815 | 797 | 153.4 |
| C | 3 | 233 | 331425 | 1856.28 | 774 | 780 | 178.1 |
| C | 14 | 238 | 123381 | 688.3 | 774 | 780 | 178.1 |
| C | 13 | 61 | 5593 | 27.02 | 774 | 780 | 178.1 |
| D | 12 | 218 | 473519 | 2544.79 | 772 | 752 | 185.8 |
| D | 2 | 16 | 94063 | 502.27 | 772 | 752 | 185.8 |
| D | 10 | 70 | 47452 | 251.37 | 772 | 752 | 185.8 |
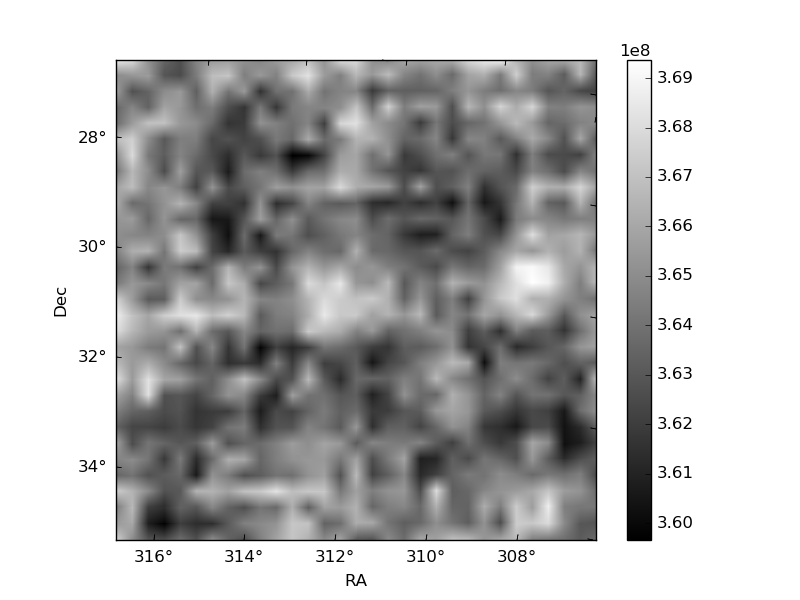
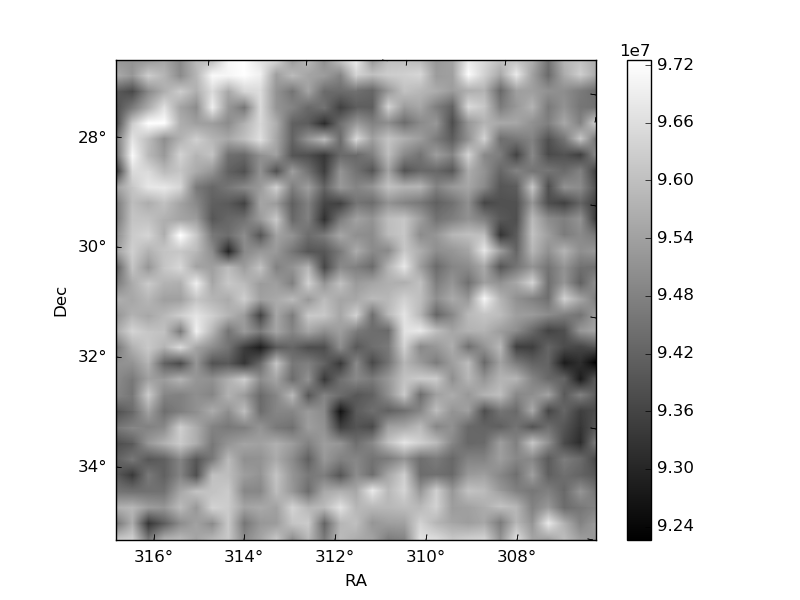
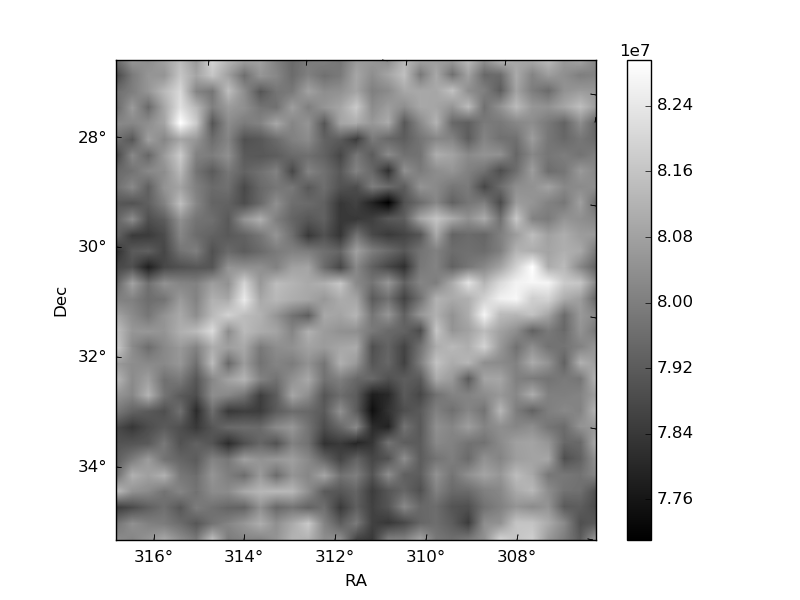
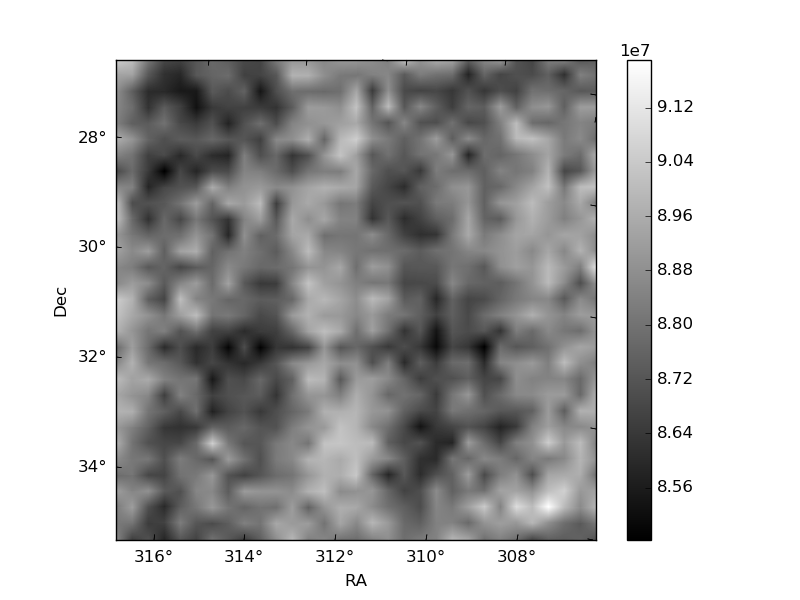
Histogram calculated using DETX and DETY for each event in the final _common_clean file
| Quadrant A | 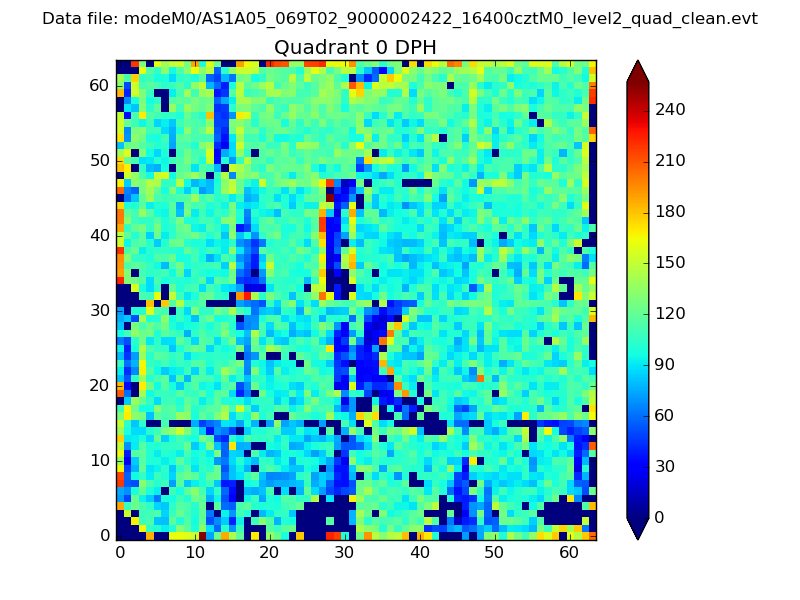 |
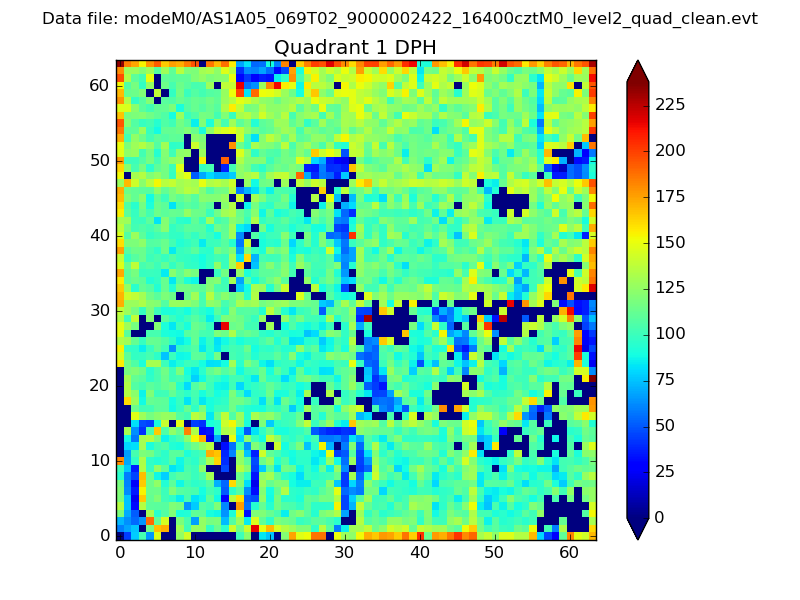 |
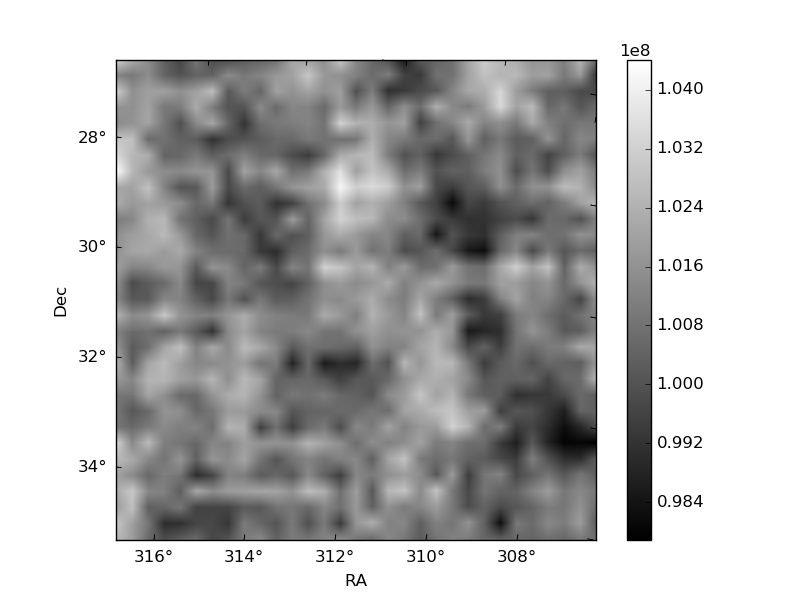
Quadrant B |
|---|---|---|---|
| Quadrant D | 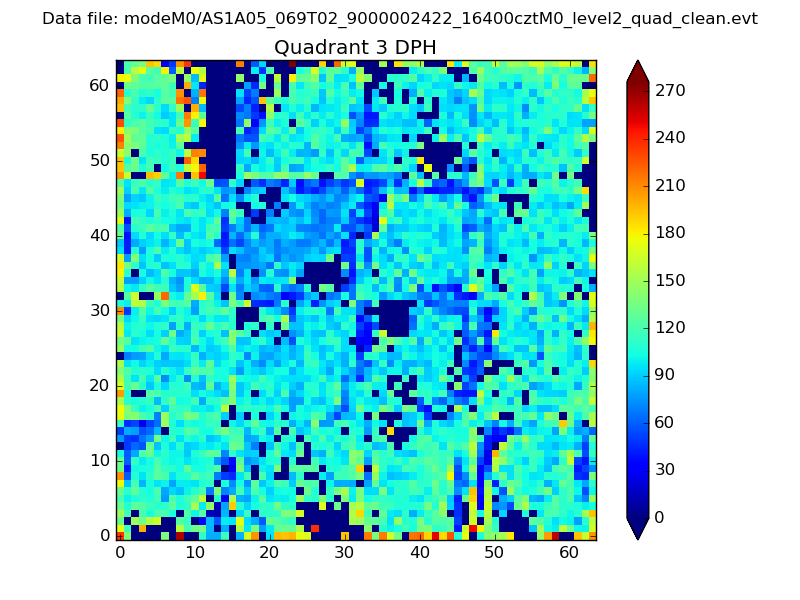 |
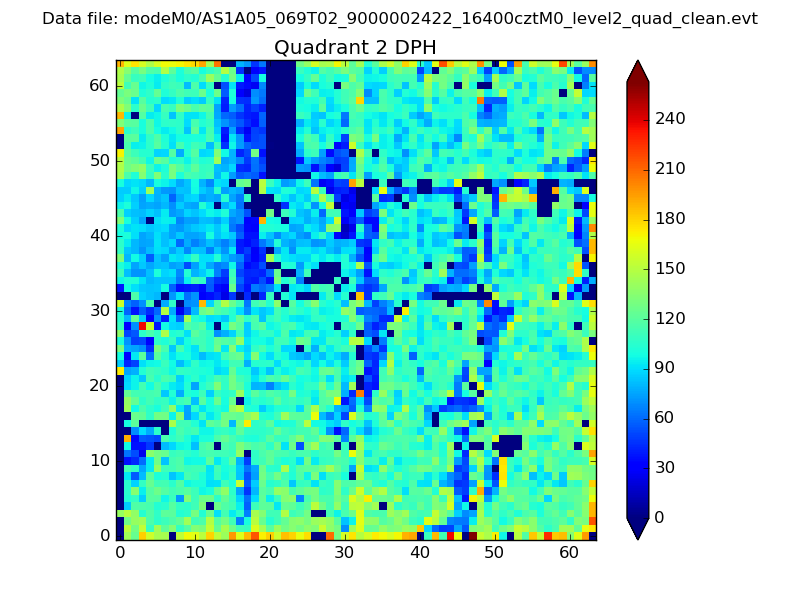 |
Quadrant C |
| Plot type | Count rate plots | Images |
|---|---|---|
| Comparison with Poisson distribution Blue bars denote a histogram of data divided into 1 sec bins. Red curve is a Poisson curve with rate = median count rate of data. |
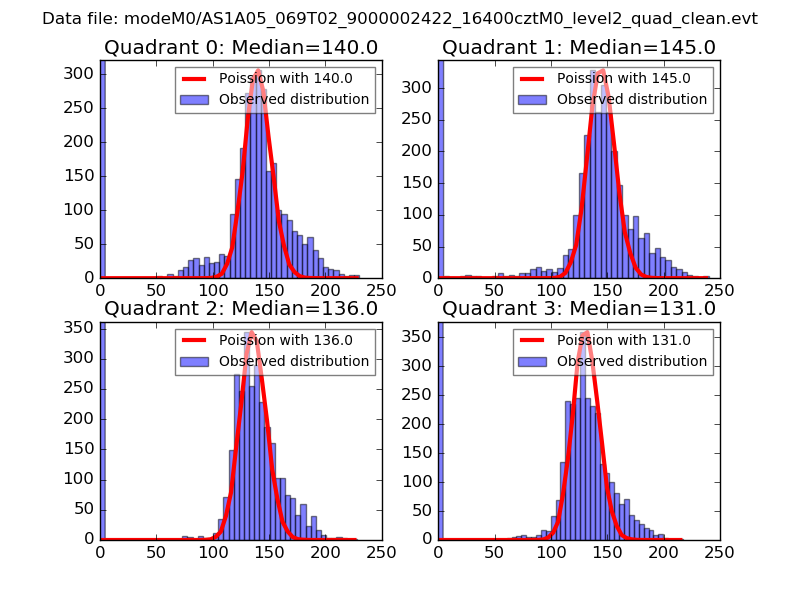 |
 |
| Quadrant-wise count rates Data is divided into 100 sec bins |
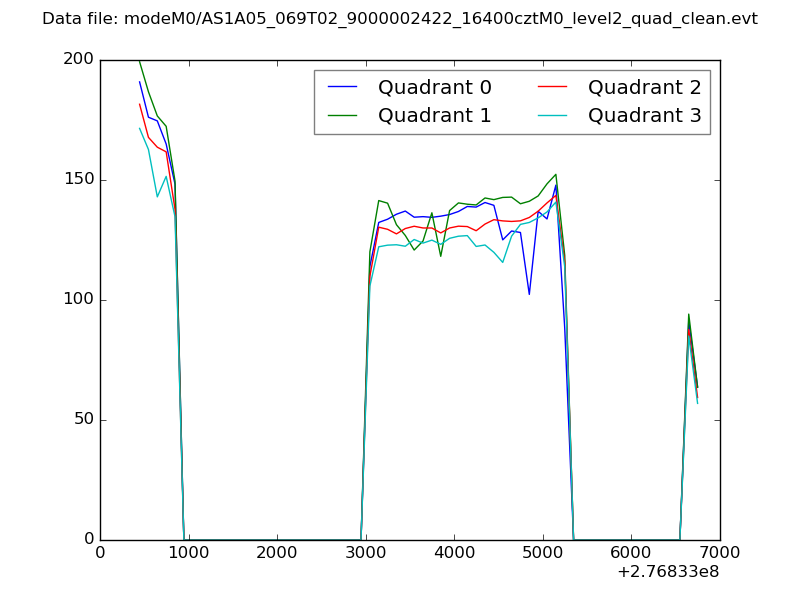 |
|
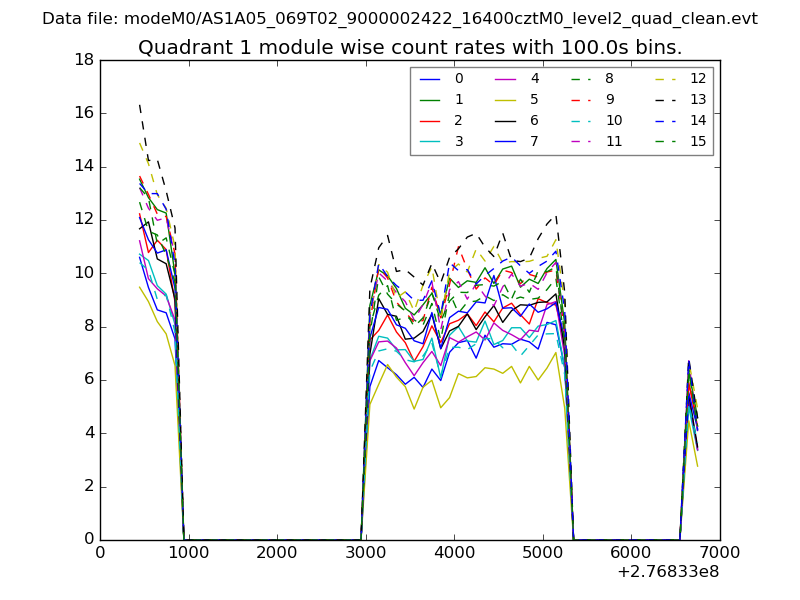
| Module-wise count rates for Quadrant A Data is divided into 100 sec bins |
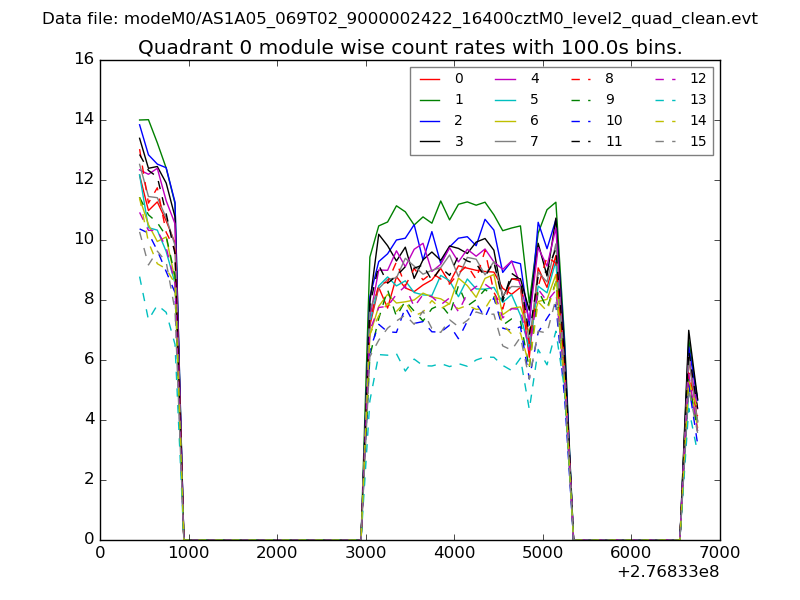 |
 |
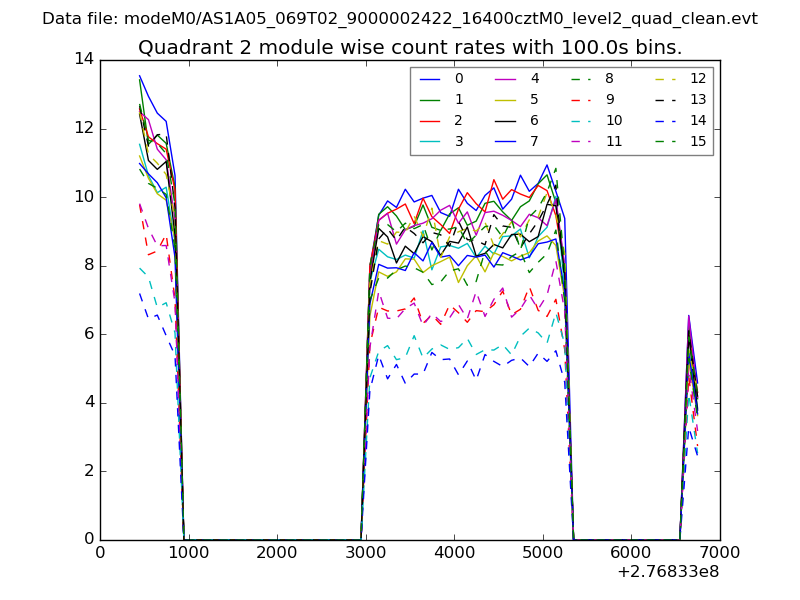
| Module-wise count rates for Quadrant B Data is divided into 100 sec bins |
 |
 |
| Module-wise count rates for Quadrant C Data is divided into 100 sec bins |
 |
 |
| Module-wise count rates for Quadrant D Data is divided into 100 sec bins |
 |
 |
| Parameter | Plot |
|---|---|
| CZT HV Monitor |  |
| D_VDD | 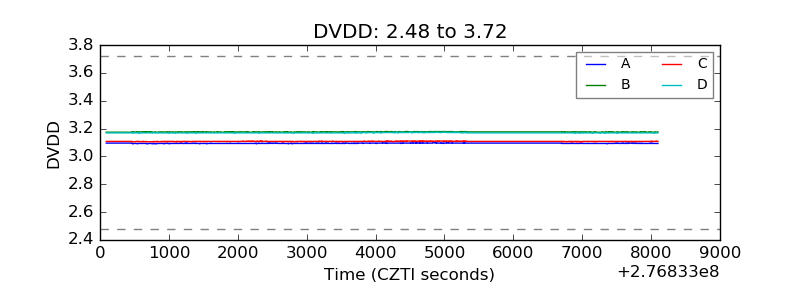 |
| Temperature 1 | 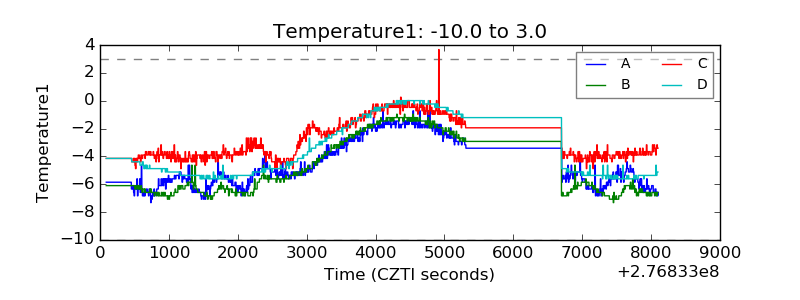 |
| Veto HV Monitor | 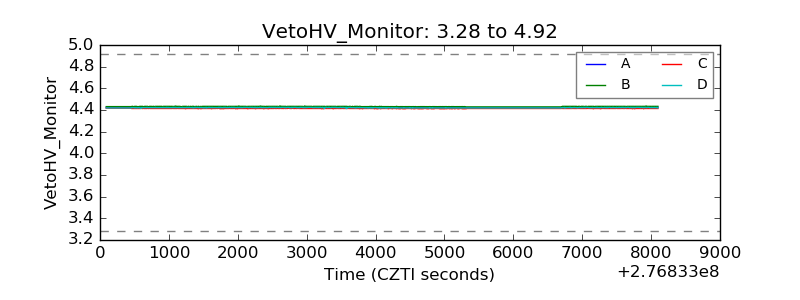 |
| Veto LLD | 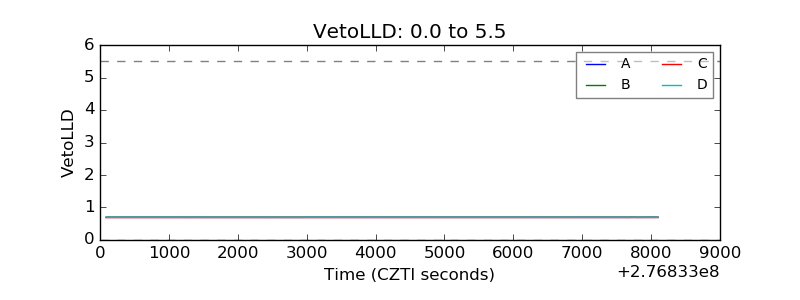 |
| Alpha Counter | 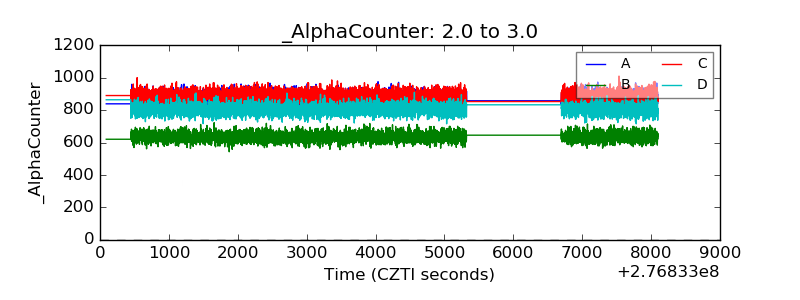 |
| _CPM_Rate | 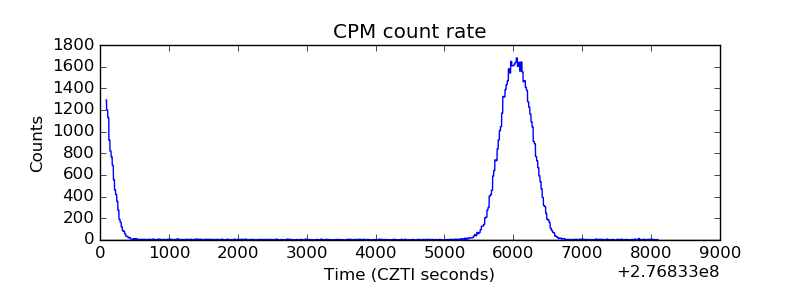 |
| CZT Counter | 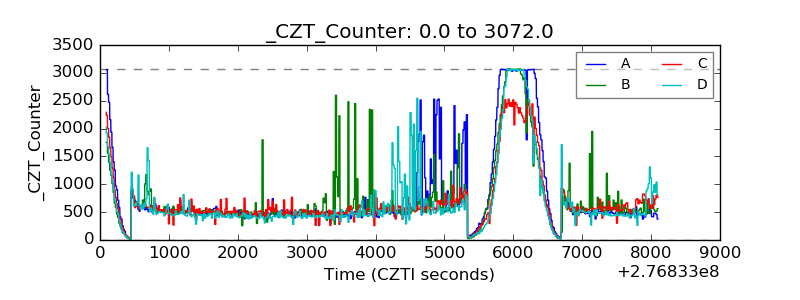 |
| +2.5 Volts monitor |  |
| +5 Volts monitor |  |
| _ROLL_ROT | 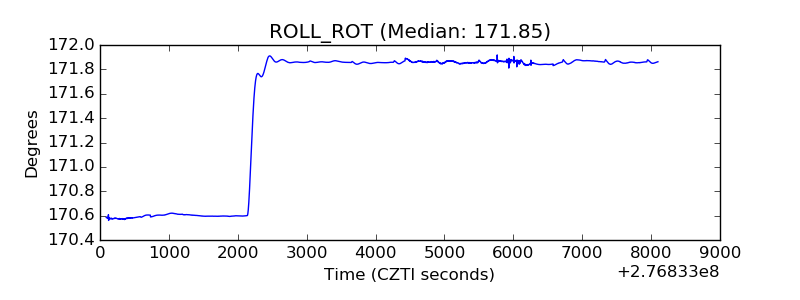 |
| _Roll_DEC |  |
| _Roll_RA | 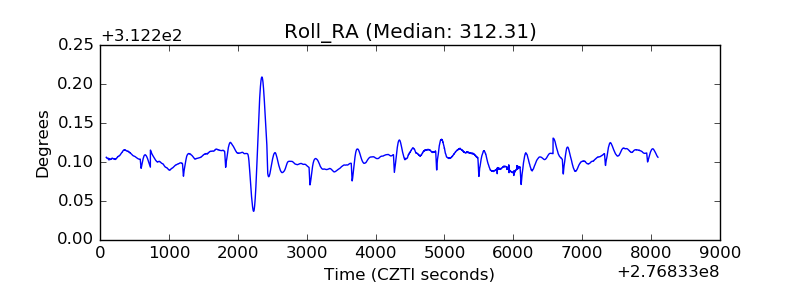 |
| Veto Counter | 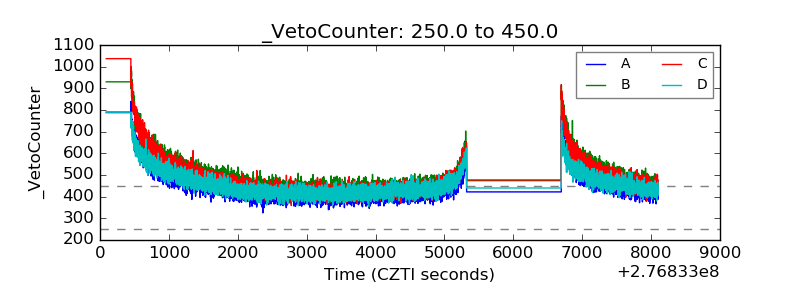 |