| Param | Original file | Final file |
|---|---|---|
| Filename | modeM0/AS1A05_069T02_9000002422_16405cztM0_level2.evt | modeM0/AS1A05_069T02_9000002422_16405cztM0_level2_quad_clean.evt |
| Size (bytes) | 492,022,080 | 93,637,440 |
| Size | 469.2 MB | 89.3 MB |
| Events in quadrant A | 3,311,410 | 605,366 |
| Events in quadrant B | 3,765,296 | 615,839 |
| Events in quadrant C | 3,252,616 | 588,097 |
| Events in quadrant D | 4,107,965 | 550,939 |
| Mode SS | |||
|---|---|---|---|
| Quadrant | BADHDUFLAG | Total packets | Discarded packets |
| A | 0 | 140 | 0 |
| B | 0 | 140 | 0 |
| C | 0 | 140 | 0 |
| D | 0 | 140 | 0 |
| Mode M0 | |||
|---|---|---|---|
| Quadrant | BADHDUFLAG | Total packets | Discarded packets |
| A | 0 | 14264 | 2 |
| B | 0 | 15465 | 1 |
| C | 0 | 14087 | 1 |
| D | 0 | 16844 | 1 |
| Mode M9 | |||
|---|---|---|---|
| Quadrant | BADHDUFLAG | Total packets | Discarded packets |
| A | 0 | 3 | 0 |
| B | 0 | 3 | 0 |
| C | 0 | 3 | 0 |
| D | 0 | 3 | 0 |
| Quadrant | Total seconds | Saturated seconds | Saturation percentage |
|---|---|---|---|
| A | 6816 | 121 | 1.775235% |
| B | 6816 | 157 | 2.303404% |
| C | 6816 | 123 | 1.804577% |
| D | 6816 | 402 | 5.897887% |
Noise dominated data is calculated using 1-second bins in cleaned event files. If a bin has >2000 counts, and if more than 50% of those come from <1% of pixels, then it is considered to be noise-dominated and hence unusable.
| Quadrant | # 1 sec bins | Bins with >0 counts | Bins with >2000 counts | High rate bins dominated by noise | Noise dominated (total time) | Noise dominated (detector-on time) | Marked lightcurve |
|---|---|---|---|---|---|---|---|
| A | 7117 | 6818 | 10 | 10 | 0.14% | 0.15% | 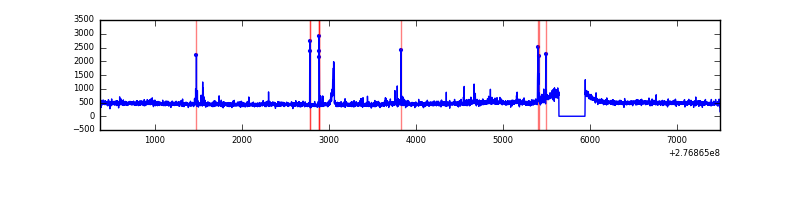 |
| B | 7117 | 6817 | 26 | 26 | 0.37% | 0.38% | 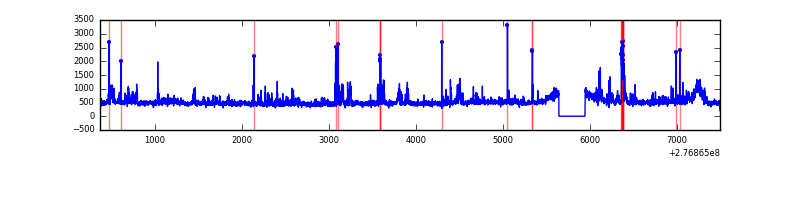 |
| C | 7117 | 6818 | 9 | 9 | 0.13% | 0.13% | 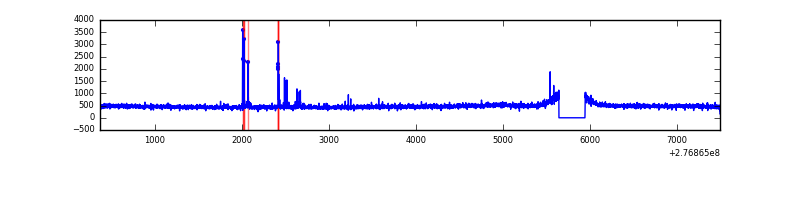 |
| D | 7117 | 6818 | 309 | 309 | 4.34% | 4.53% | 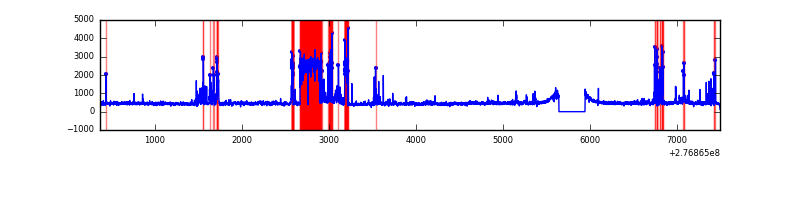 |
Top three noisy pixels from each quadrant. If the there are fewer than three noisy pixels in the level2.evt file, extra rows are filled as -1
| Pixel properties | Quadrant properties | ||||||
|---|---|---|---|---|---|---|---|
| Quadrant | DetID | PixID | Counts | Sigma | Mean | Median | Sigma |
| A | 9 | 143 | 66701 | 396.16 | 818 | 801 | 166.3 |
| A | 15 | 174 | 66446 | 394.62 | 818 | 801 | 166.3 |
| A | 15 | 223 | 27032 | 157.69 | 818 | 801 | 166.3 |
| B | 15 | 35 | 137162 | 863.9 | 815 | 793 | 157.9 |
| B | 0 | 189 | 123775 | 779.09 | 815 | 793 | 157.9 |
| B | 4 | 173 | 98405 | 618.37 | 815 | 793 | 157.9 |
| C | 14 | 238 | 120522 | 647.09 | 782 | 785 | 185.0 |
| C | 0 | 207 | 49096 | 261.09 | 782 | 785 | 185.0 |
| C | 3 | 233 | 17011 | 87.69 | 782 | 785 | 185.0 |
| D | 10 | 70 | 887001 | 4648.38 | 778 | 756 | 190.7 |
| D | 12 | 218 | 172822 | 902.49 | 778 | 756 | 190.7 |
| D | 1 | 52 | 63061 | 326.79 | 778 | 756 | 190.7 |
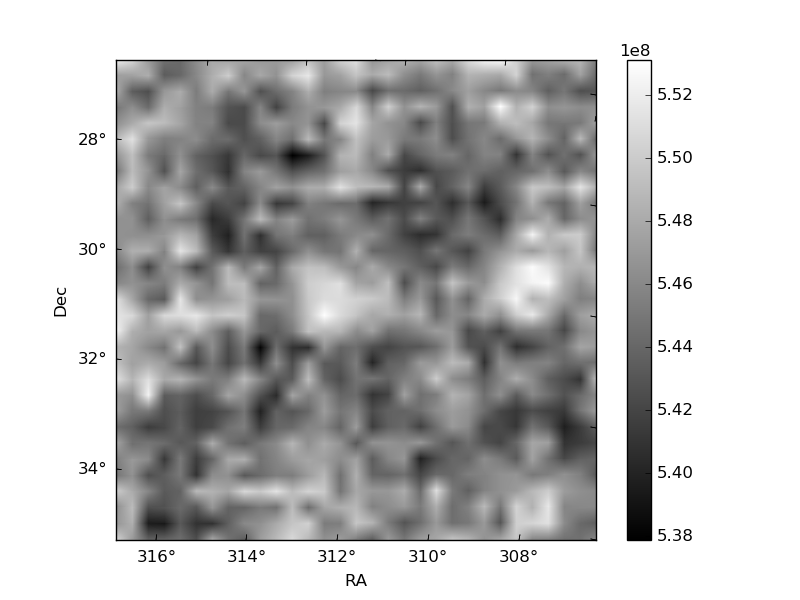
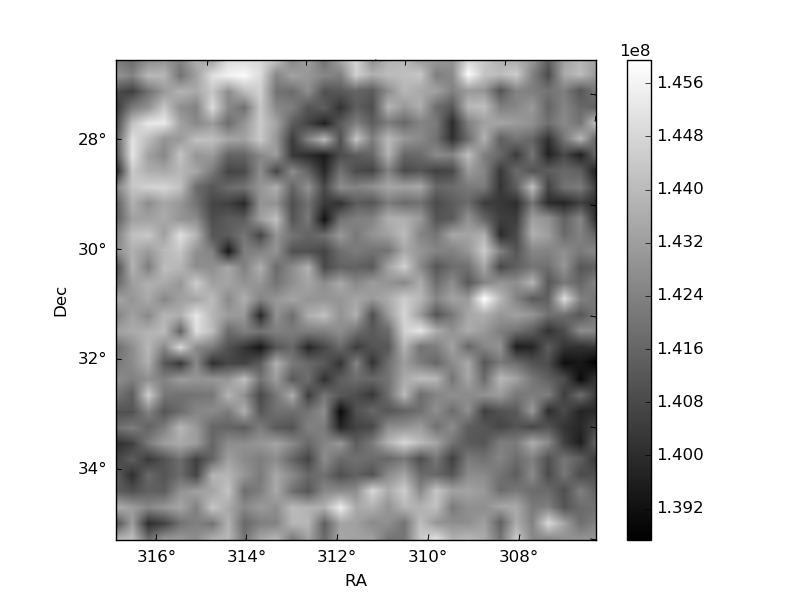
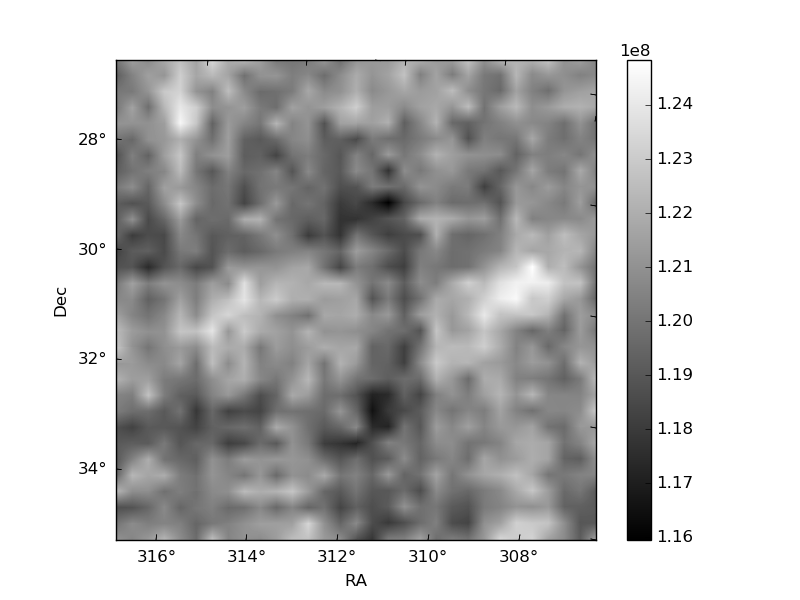
Histogram calculated using DETX and DETY for each event in the final _common_clean file
| Quadrant A | 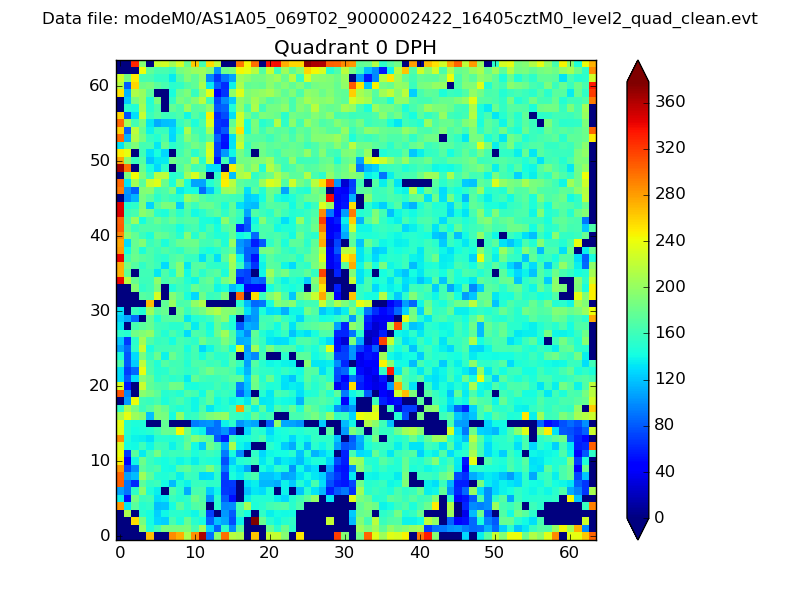 |
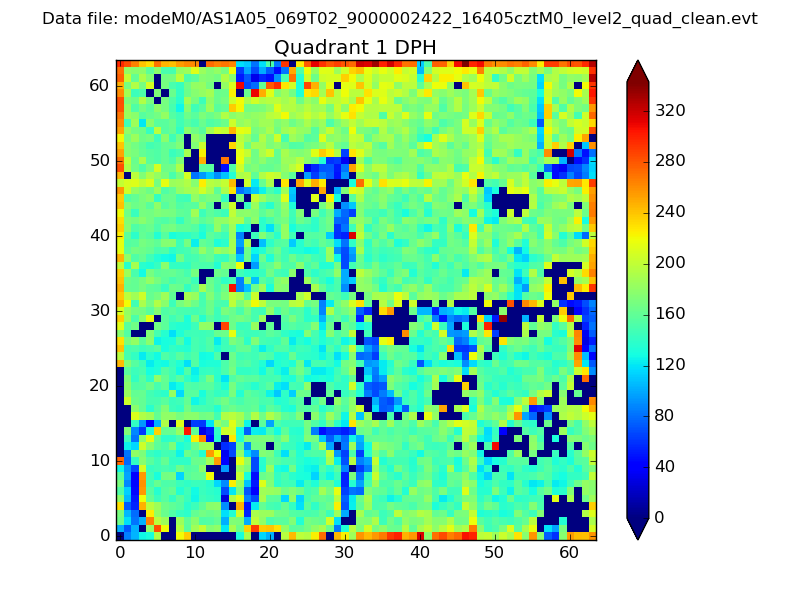 |
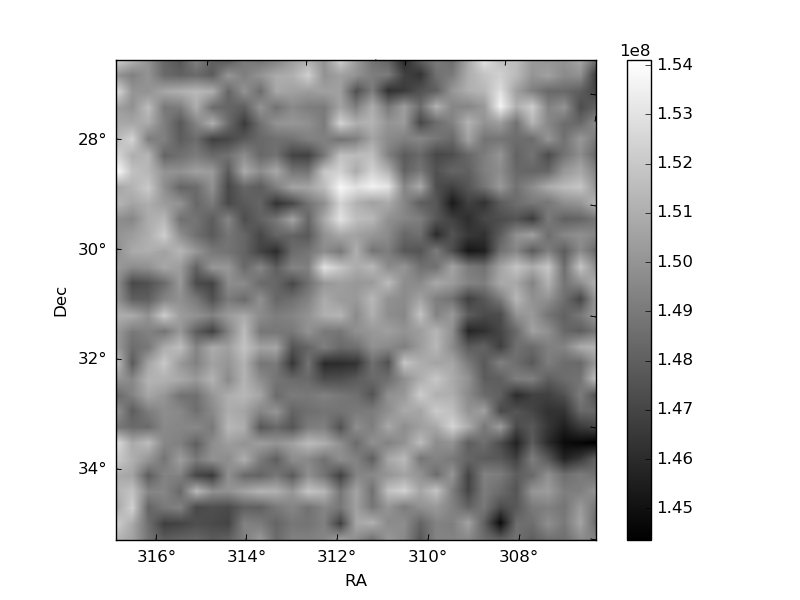
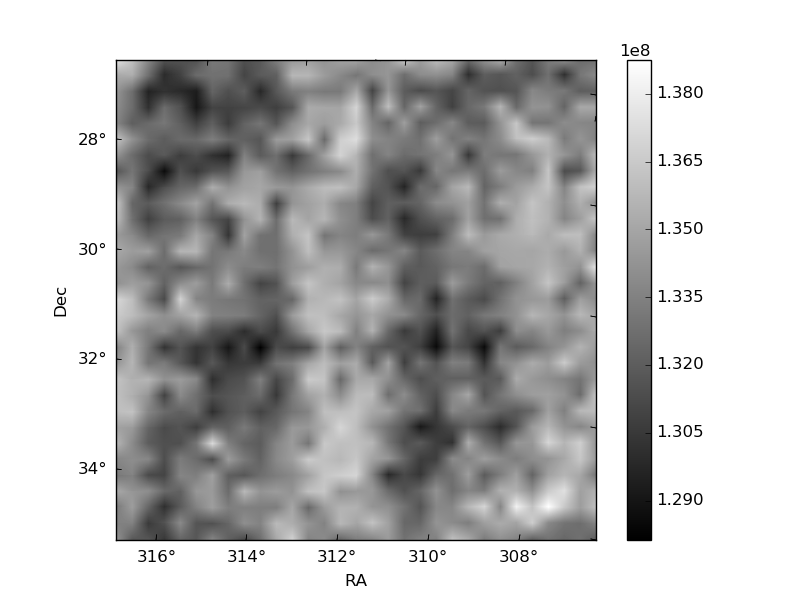
Quadrant B |
|---|---|---|---|
| Quadrant D | 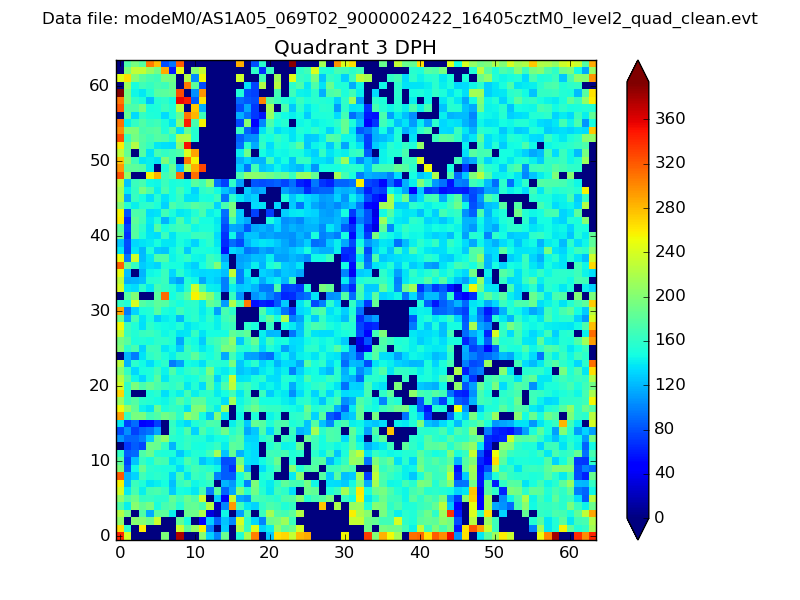 |
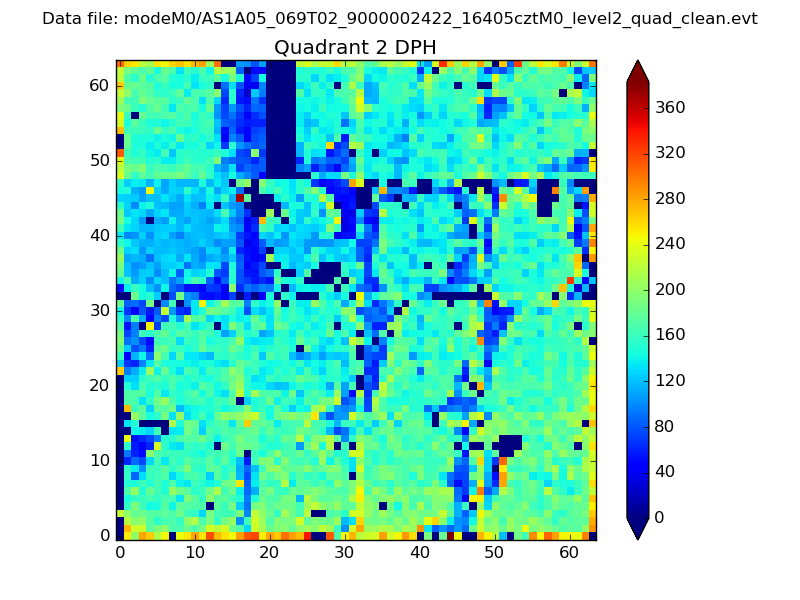 |
Quadrant C |
| Plot type | Count rate plots | Images |
|---|---|---|
| Comparison with Poisson distribution Blue bars denote a histogram of data divided into 1 sec bins. Red curve is a Poisson curve with rate = median count rate of data. |
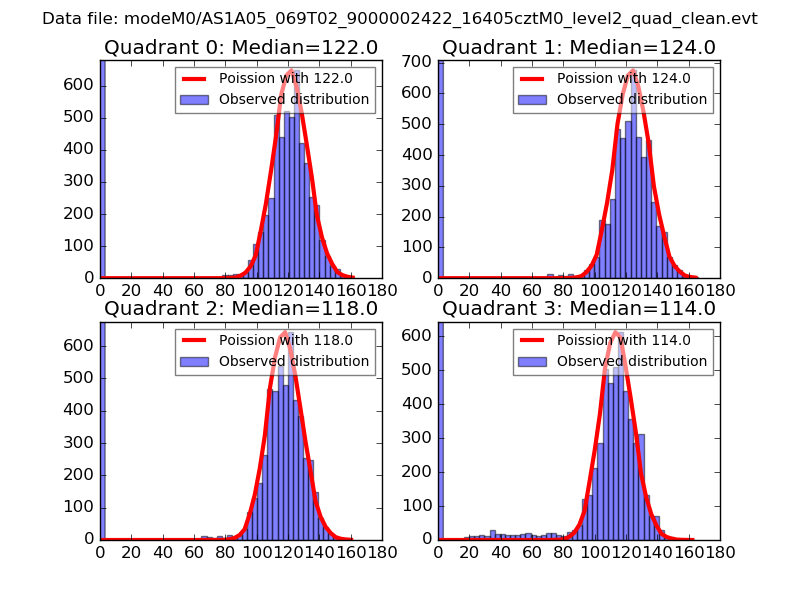 |
 |
| Quadrant-wise count rates Data is divided into 100 sec bins |
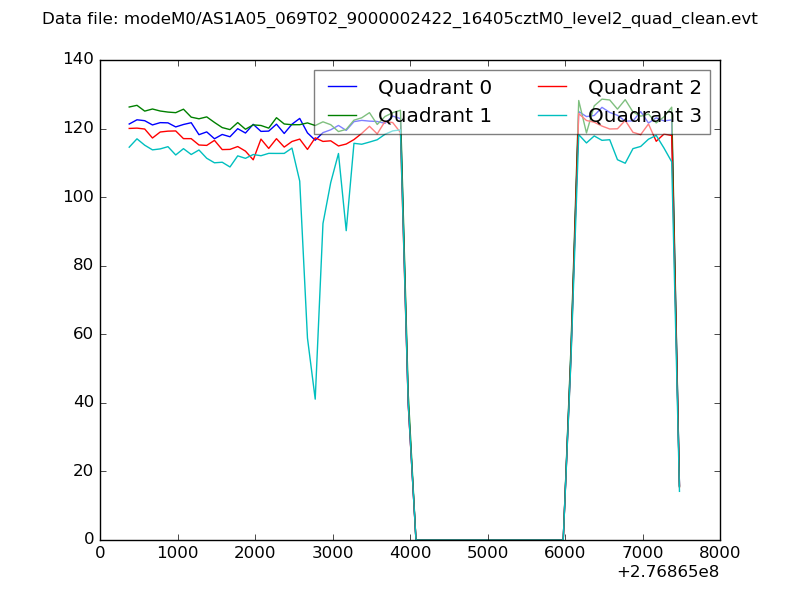 |
|
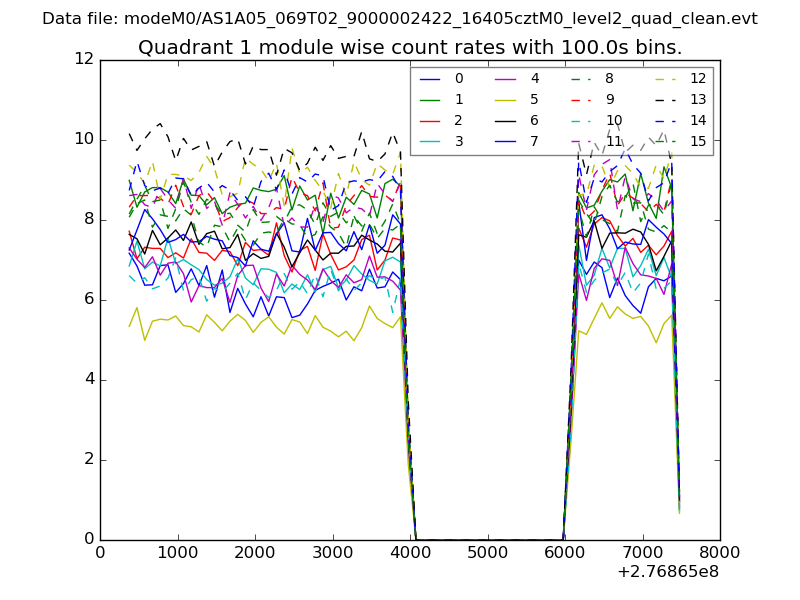
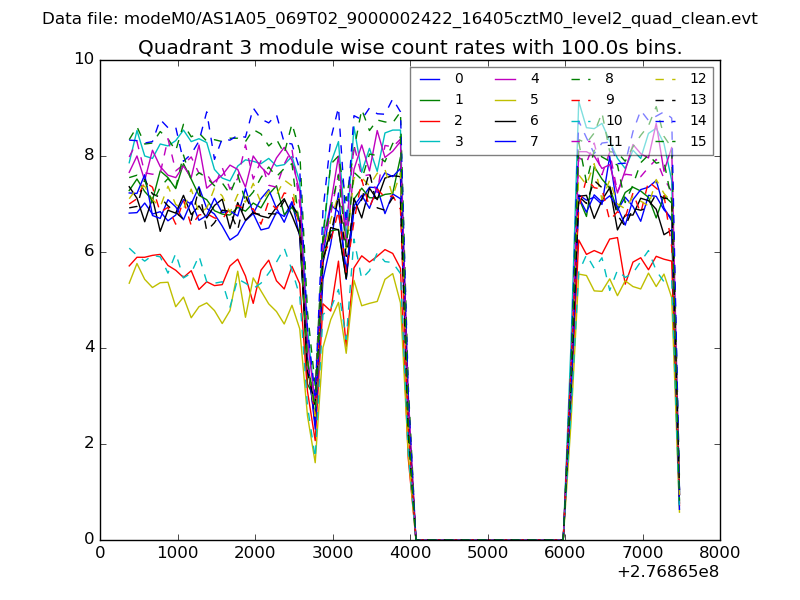
| Module-wise count rates for Quadrant A Data is divided into 100 sec bins |
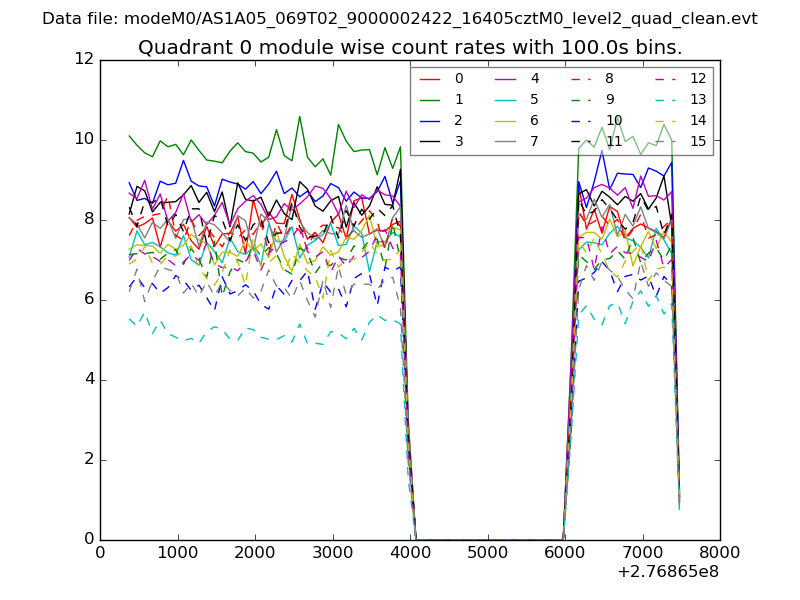 |
 |
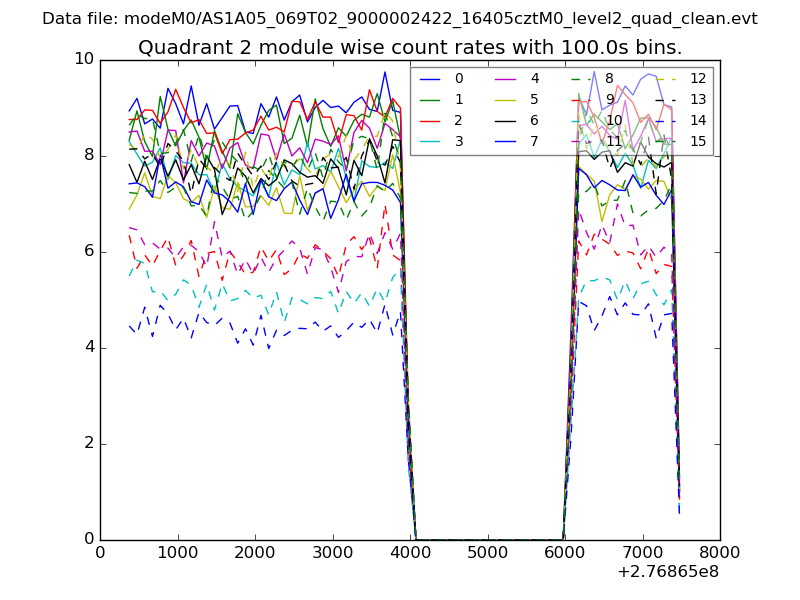
| Module-wise count rates for Quadrant B Data is divided into 100 sec bins |
 |
 |
| Module-wise count rates for Quadrant C Data is divided into 100 sec bins |
 |
 |
| Module-wise count rates for Quadrant D Data is divided into 100 sec bins |
 |
 |
| Parameter | Plot |
|---|---|
| CZT HV Monitor | 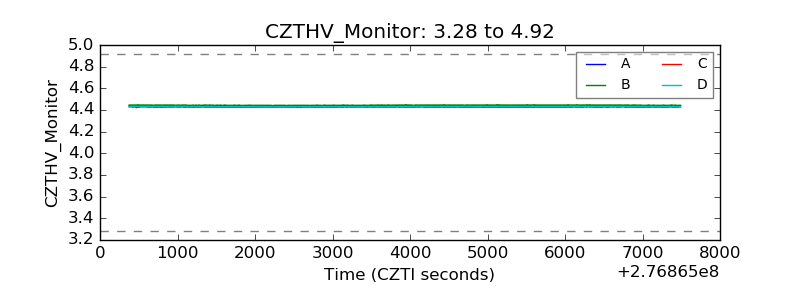 |
| D_VDD | 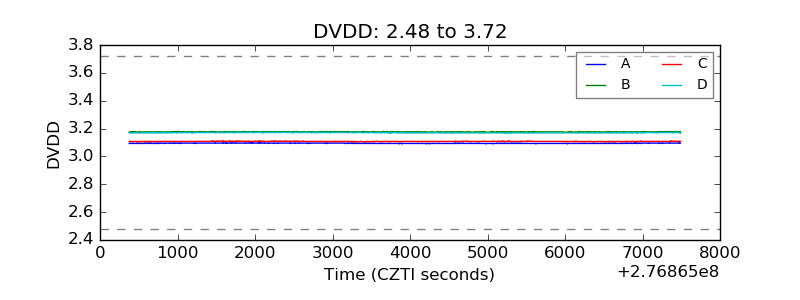 |
| Temperature 1 | 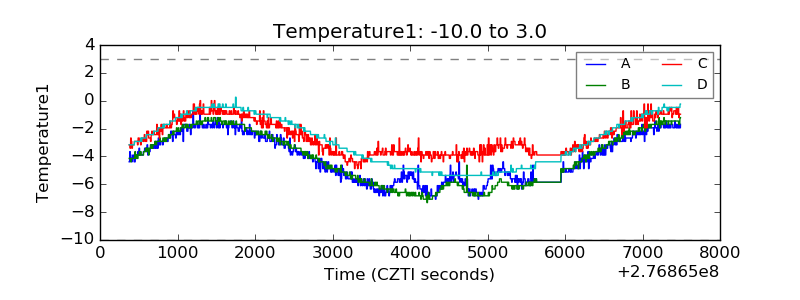 |
| Veto HV Monitor | 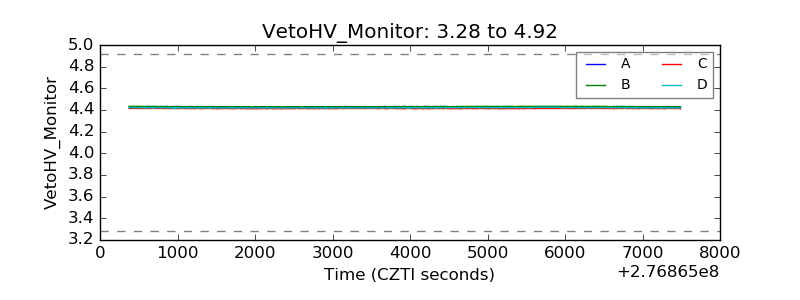 |
| Veto LLD | 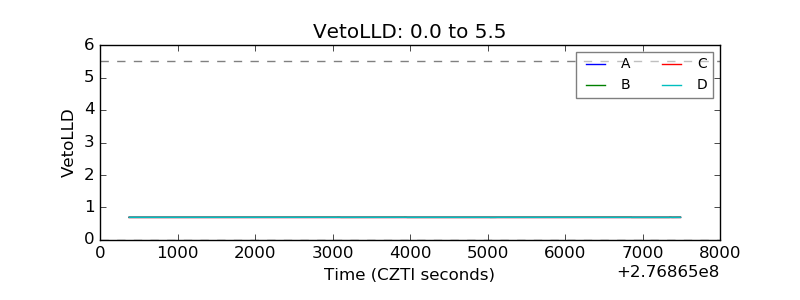 |
| Alpha Counter | 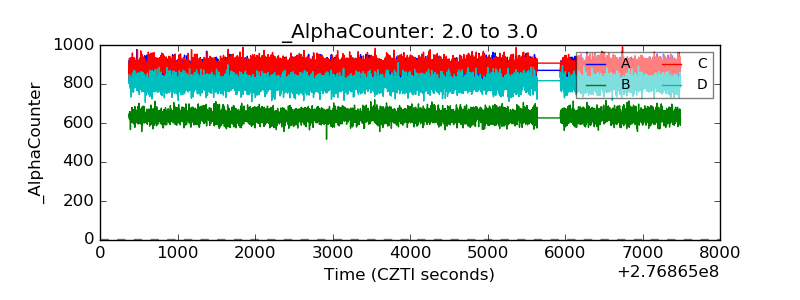 |
| _CPM_Rate | 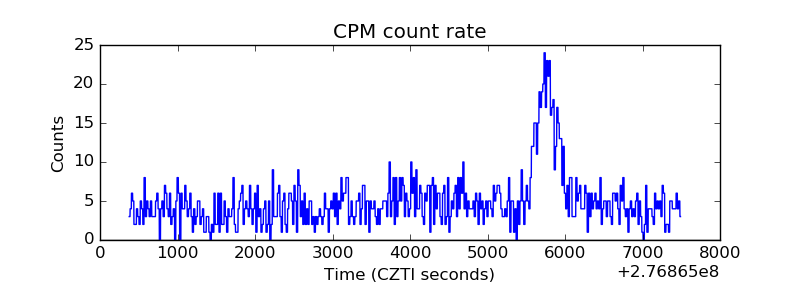 |
| CZT Counter | 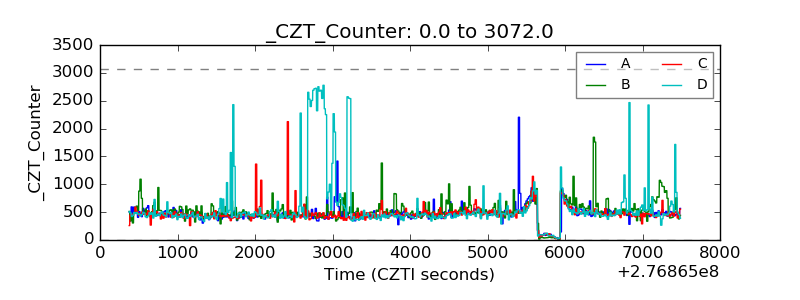 |
| +2.5 Volts monitor |  |
| +5 Volts monitor |  |
| _ROLL_ROT | 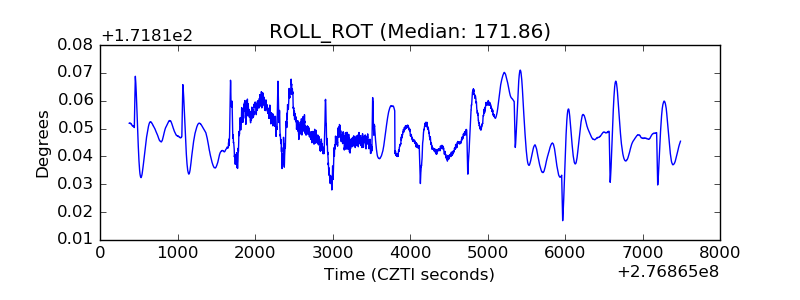 |
| _Roll_DEC | 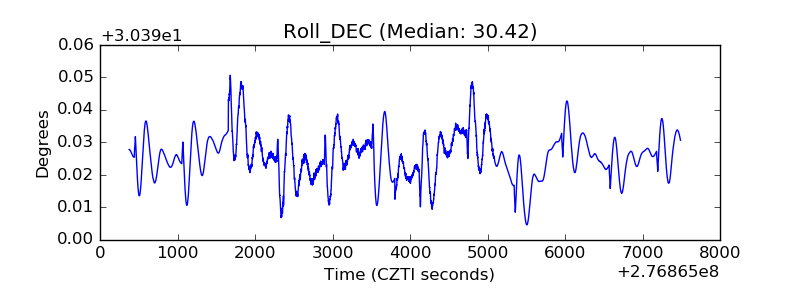 |
| _Roll_RA | 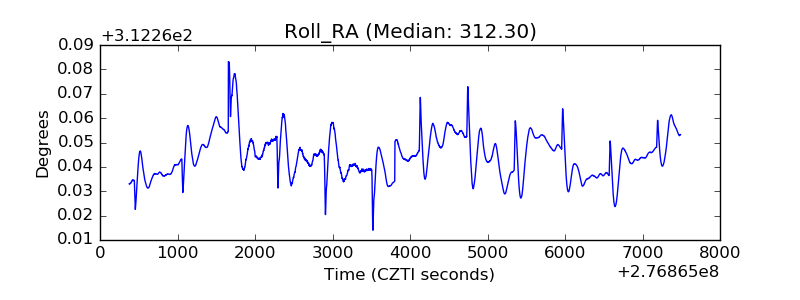 |
| Veto Counter | 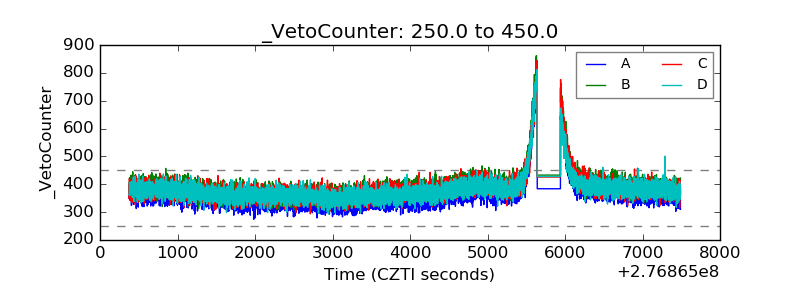 |