| Param | Original file | Final file |
|---|---|---|
| Filename | modeM0/AS1A05_069T02_9000002422_16407cztM0_level2.evt | modeM0/AS1A05_069T02_9000002422_16407cztM0_level2_quad_clean.evt |
| Size (bytes) | 579,018,240 | 101,727,360 |
| Size | 552.2 MB | 97.0 MB |
| Events in quadrant A | 4,063,745 | 652,987 |
| Events in quadrant B | 3,933,315 | 668,830 |
| Events in quadrant C | 3,583,731 | 640,371 |
| Events in quadrant D | 5,455,238 | 605,410 |
| Mode SS | |||
|---|---|---|---|
| Quadrant | BADHDUFLAG | Total packets | Discarded packets |
| A | 0 | 148 | 0 |
| B | 0 | 148 | 0 |
| C | 0 | 148 | 0 |
| D | 0 | 148 | 0 |
| Mode M0 | |||
|---|---|---|---|
| Quadrant | BADHDUFLAG | Total packets | Discarded packets |
| A | 0 | 16935 | 1 |
| B | 0 | 16352 | 1 |
| C | 0 | 15377 | 1 |
| D | 0 | 21473 | 1 |
| Mode M9 | |||
|---|---|---|---|
| Quadrant | BADHDUFLAG | Total packets | Discarded packets |
| A | 0 | 5 | 0 |
| B | 0 | 5 | 0 |
| C | 0 | 5 | 0 |
| D | 0 | 5 | 0 |
| Quadrant | Total seconds | Saturated seconds | Saturation percentage |
|---|---|---|---|
| A | 7375 | 229 | 3.105085% |
| B | 7375 | 98 | 1.328814% |
| C | 7375 | 110 | 1.491525% |
| D | 7375 | 367 | 4.976271% |
Noise dominated data is calculated using 1-second bins in cleaned event files. If a bin has >2000 counts, and if more than 50% of those come from <1% of pixels, then it is considered to be noise-dominated and hence unusable.
| Quadrant | # 1 sec bins | Bins with >0 counts | Bins with >2000 counts | High rate bins dominated by noise | Noise dominated (total time) | Noise dominated (detector-on time) | Marked lightcurve |
|---|---|---|---|---|---|---|---|
| A | 7857 | 7376 | 134 | 134 | 1.71% | 1.82% | 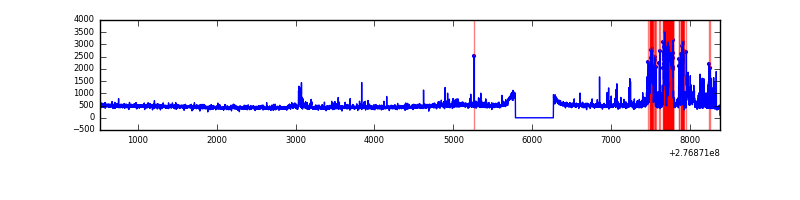 |
| B | 7857 | 7376 | 20 | 20 | 0.25% | 0.27% | 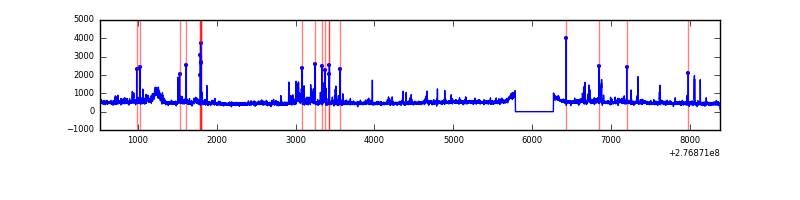 |
| C | 7857 | 7376 | 27 | 27 | 0.34% | 0.37% | 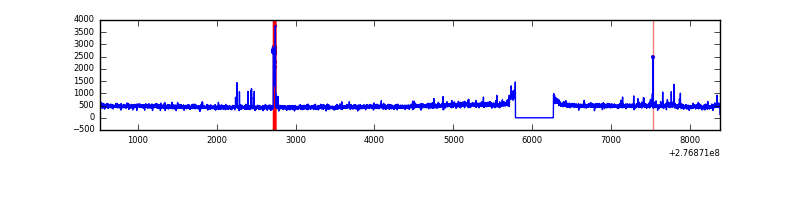 |
| D | 7857 | 7376 | 281 | 281 | 3.58% | 3.81% | 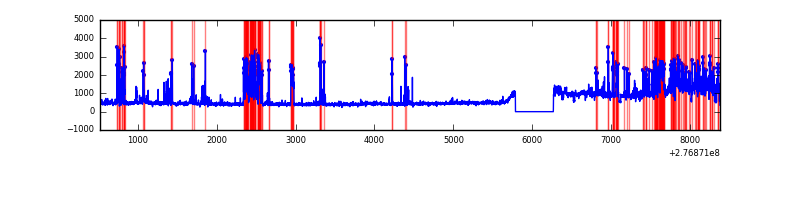 |
Top three noisy pixels from each quadrant. If the there are fewer than three noisy pixels in the level2.evt file, extra rows are filled as -1
| Pixel properties | Quadrant properties | ||||||
|---|---|---|---|---|---|---|---|
| Quadrant | DetID | PixID | Counts | Sigma | Mean | Median | Sigma |
| A | 15 | 174 | 618269 | 3483.78 | 869 | 852 | 177.2 |
| A | 9 | 143 | 71135 | 396.57 | 869 | 852 | 177.2 |
| A | 15 | 223 | 26958 | 147.3 | 869 | 852 | 177.2 |
| B | 10 | 16 | 115682 | 687.64 | 871 | 849 | 167.0 |
| B | 0 | 189 | 109607 | 651.27 | 871 | 849 | 167.0 |
| B | 0 | 198 | 75077 | 444.49 | 871 | 849 | 167.0 |
| C | 14 | 238 | 128579 | 648.08 | 837 | 844 | 197.1 |
| C | 10 | 169 | 83773 | 420.75 | 837 | 844 | 197.1 |
| C | 3 | 233 | 65859 | 329.86 | 837 | 844 | 197.1 |
| D | 1 | 20 | 1298162 | 6330.22 | 841 | 817 | 204.9 |
| D | 10 | 70 | 490206 | 2387.9 | 841 | 817 | 204.9 |
| D | 12 | 218 | 213655 | 1038.51 | 841 | 817 | 204.9 |
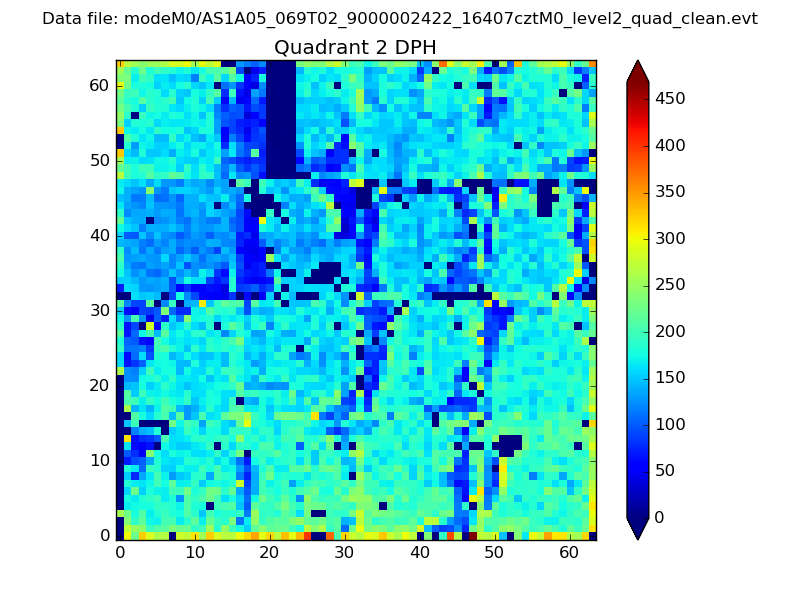
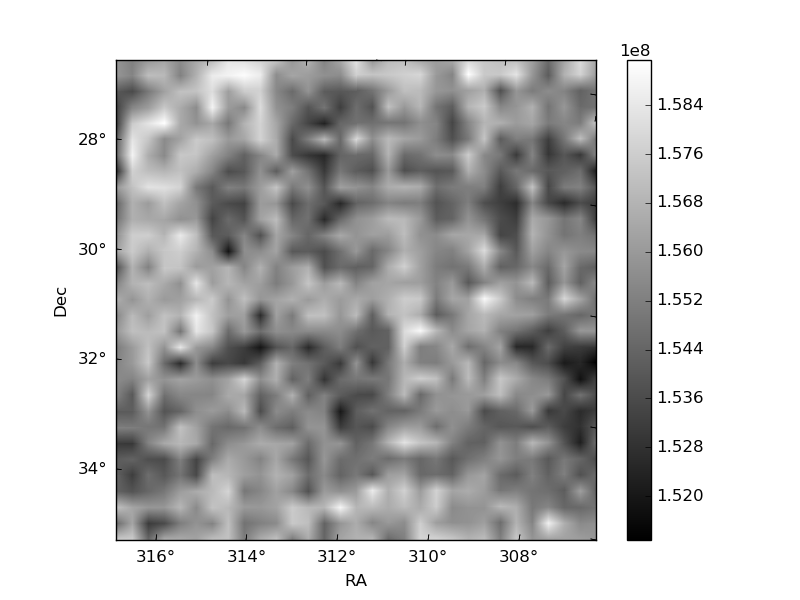
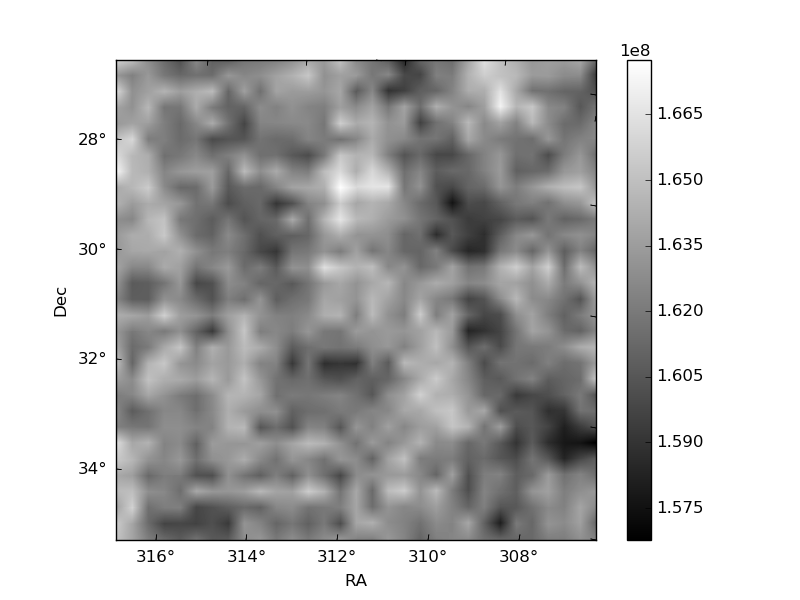
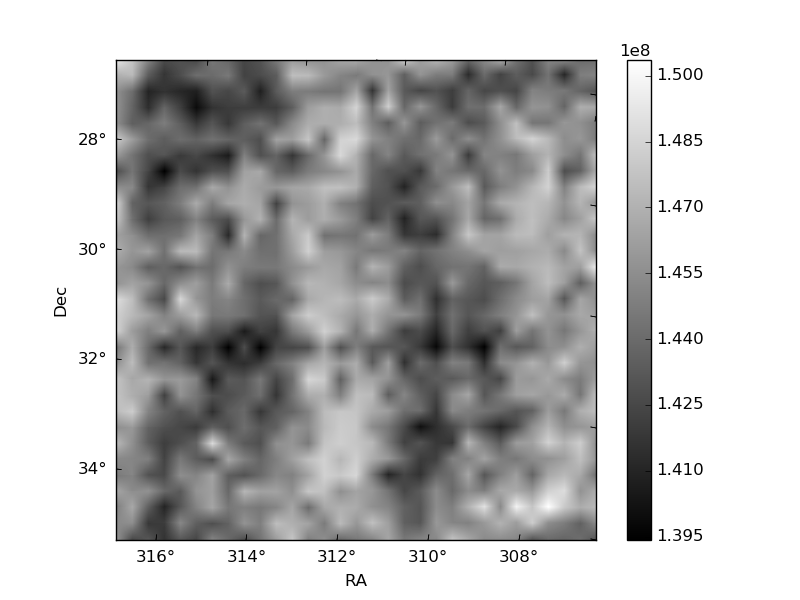
Histogram calculated using DETX and DETY for each event in the final _common_clean file
| Quadrant A |  |
 |
Quadrant B |
|---|---|---|---|
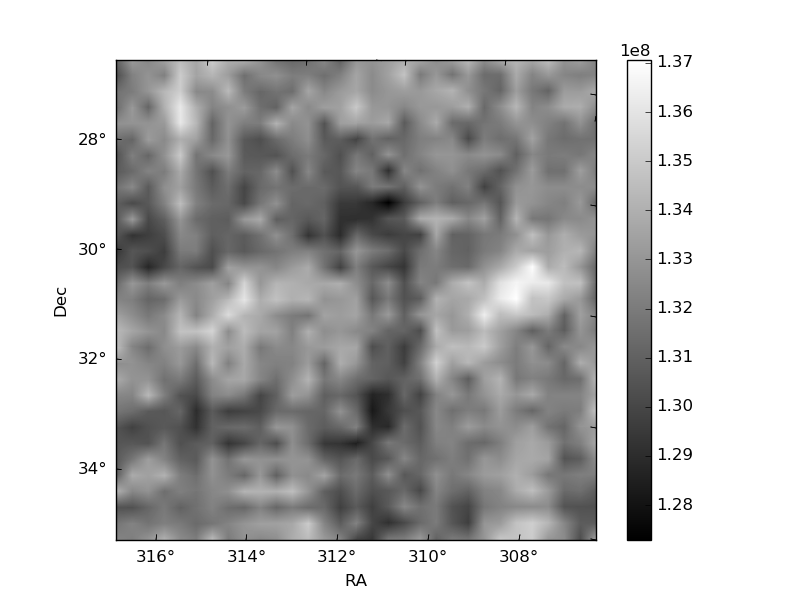
| Quadrant D | 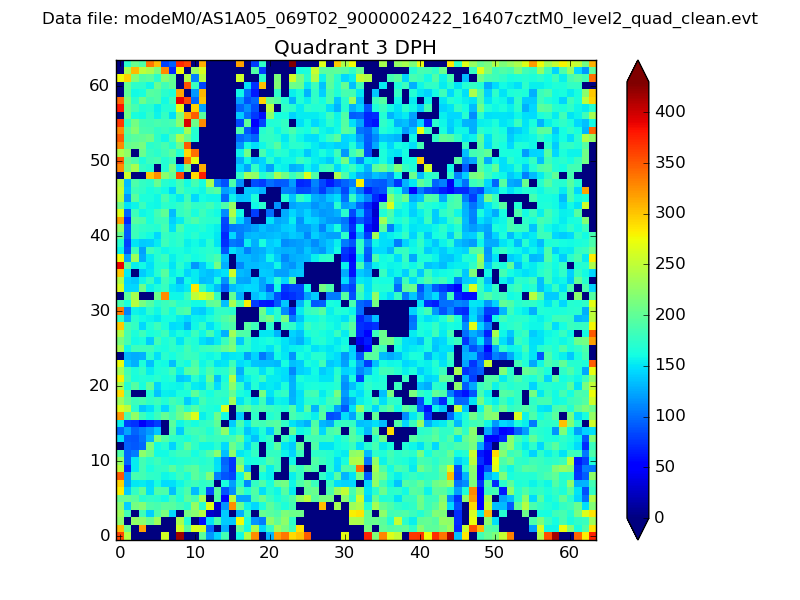 |
 |
Quadrant C |
| Plot type | Count rate plots | Images |
|---|---|---|
| Comparison with Poisson distribution Blue bars denote a histogram of data divided into 1 sec bins. Red curve is a Poisson curve with rate = median count rate of data. |
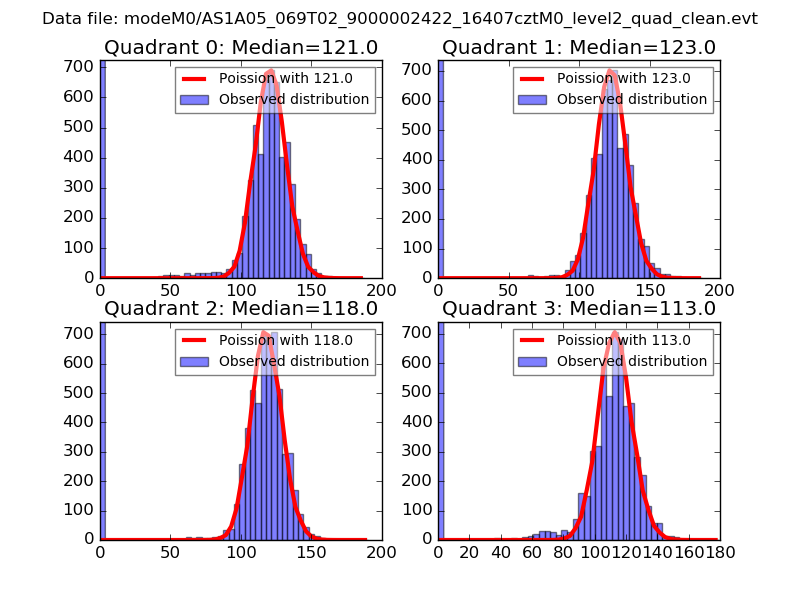 |
 |
| Quadrant-wise count rates Data is divided into 100 sec bins |
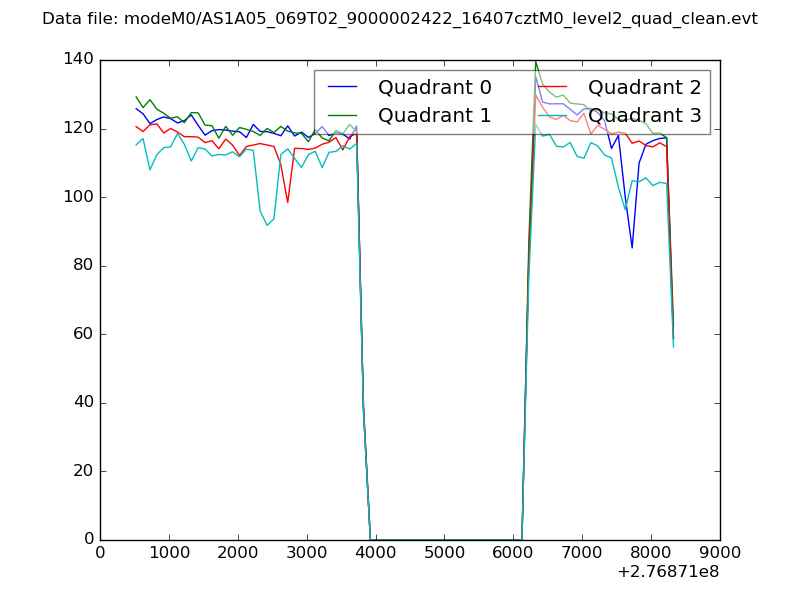 |
|
| Module-wise count rates for Quadrant A Data is divided into 100 sec bins |
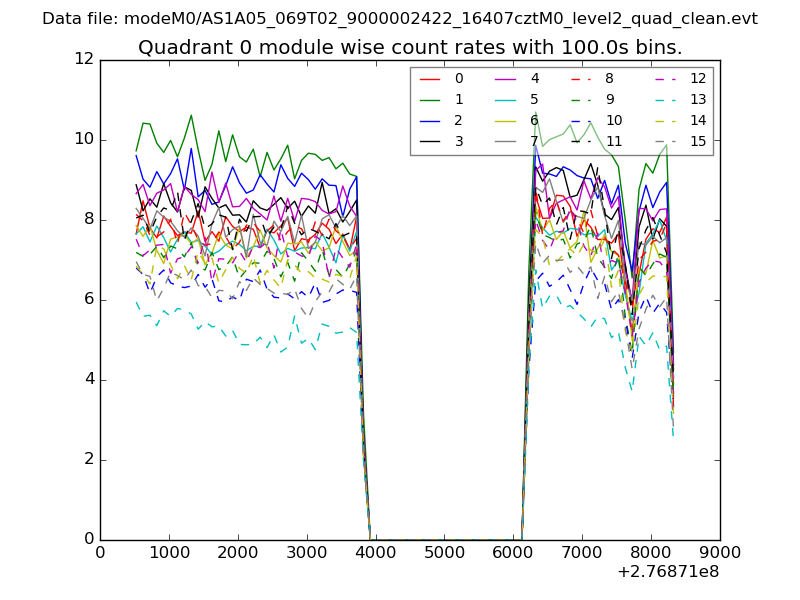 |
 |
| Module-wise count rates for Quadrant B Data is divided into 100 sec bins |
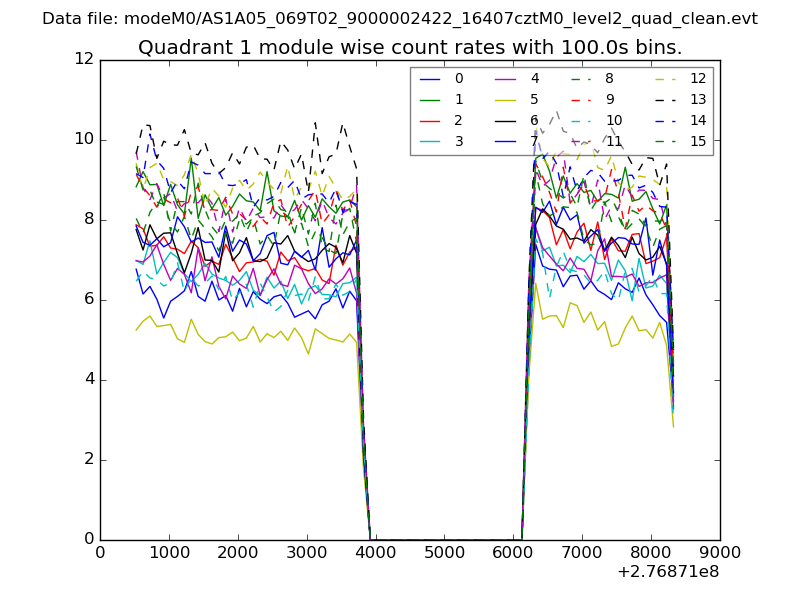 |
 |
| Module-wise count rates for Quadrant C Data is divided into 100 sec bins |
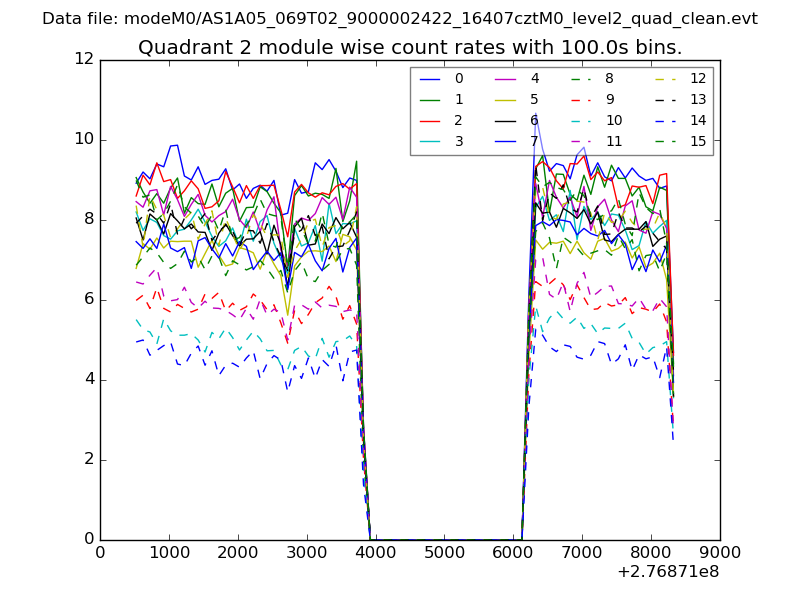 |
 |
| Module-wise count rates for Quadrant D Data is divided into 100 sec bins |
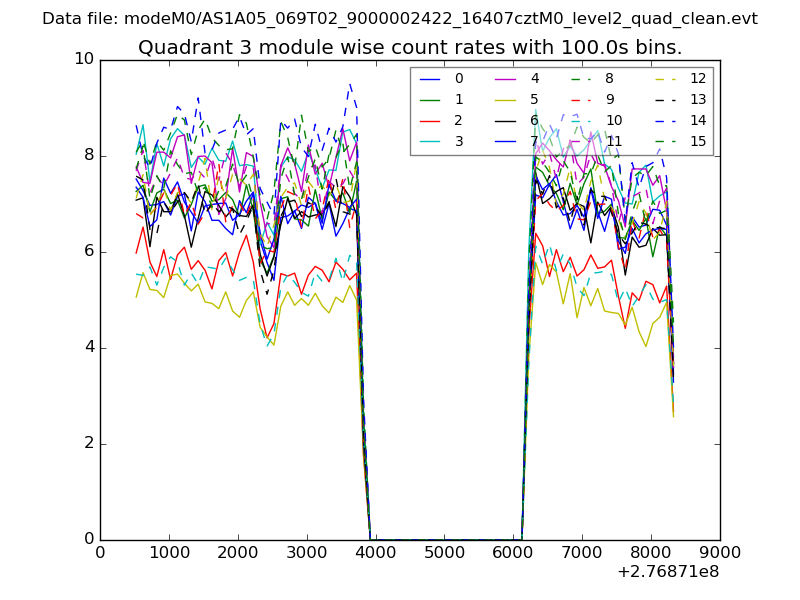 |
 |
| Parameter | Plot |
|---|---|
| CZT HV Monitor | 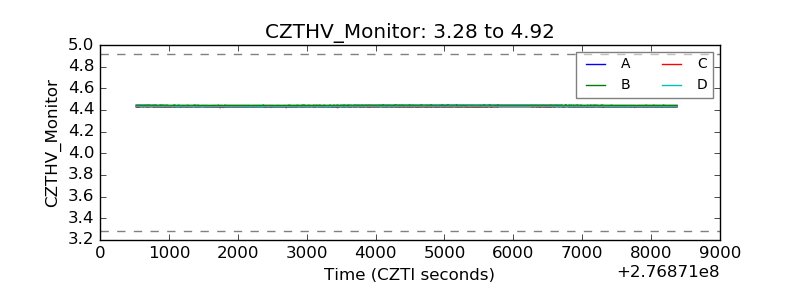 |
| D_VDD | 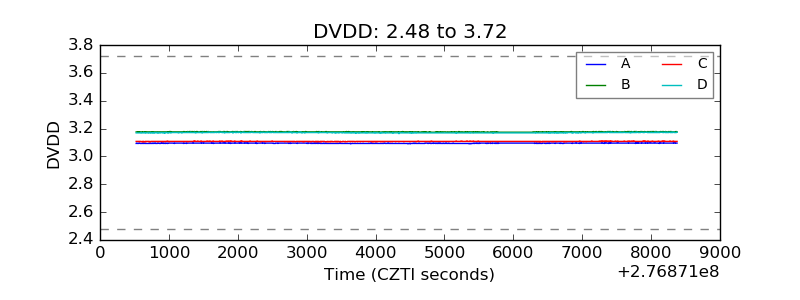 |
| Temperature 1 |  |
| Veto HV Monitor | 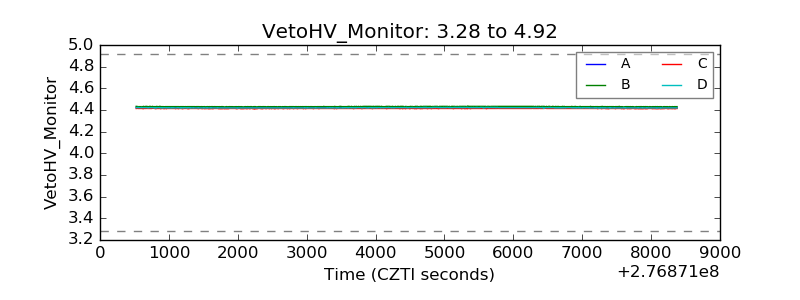 |
| Veto LLD | 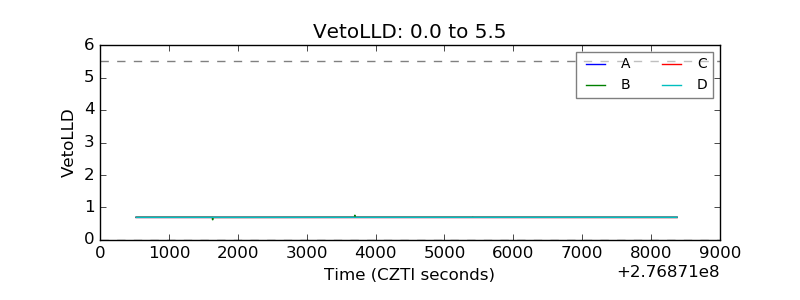 |
| Alpha Counter | 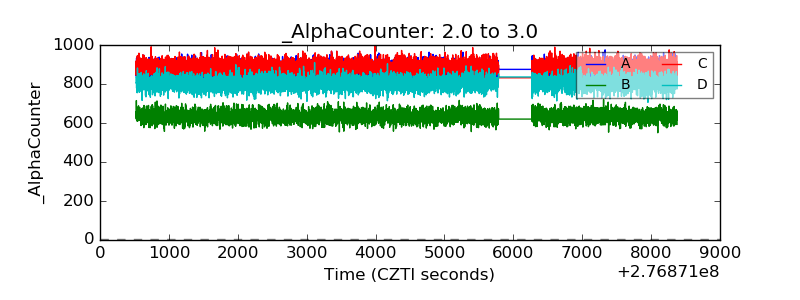 |
| _CPM_Rate | 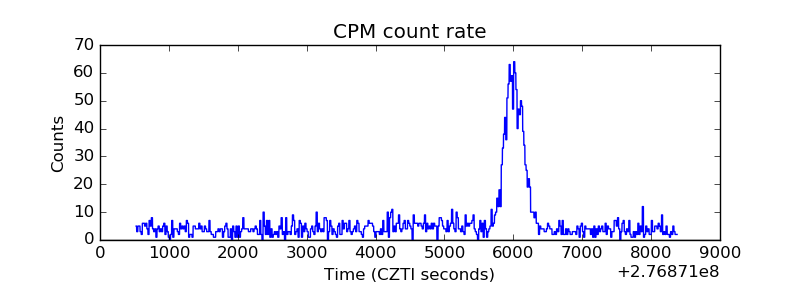 |
| CZT Counter | 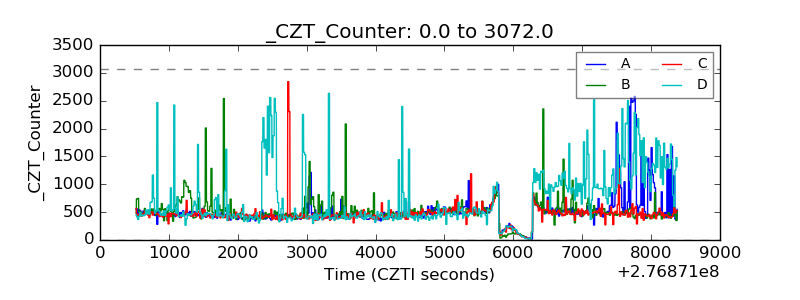 |
| +2.5 Volts monitor |  |
| +5 Volts monitor | 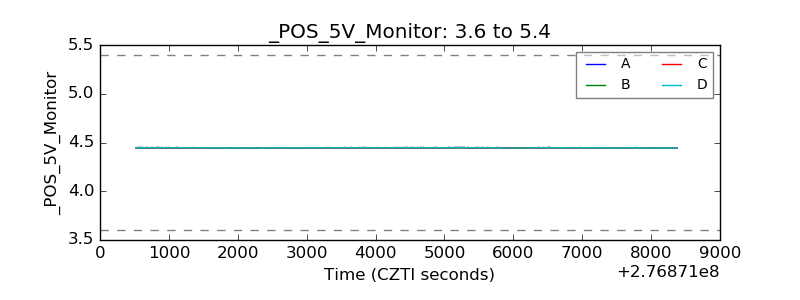 |
| _ROLL_ROT | 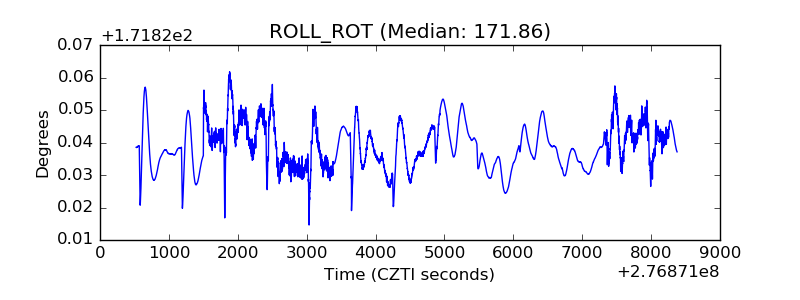 |
| _Roll_DEC | 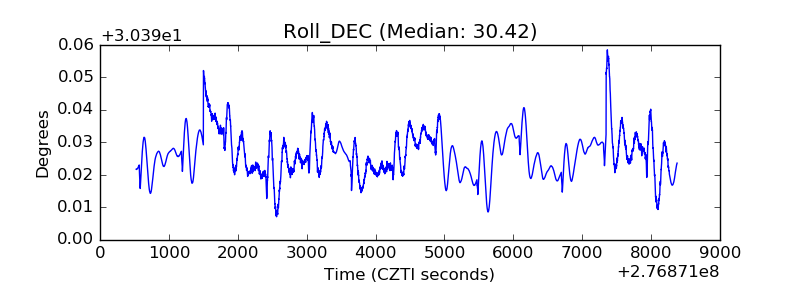 |
| _Roll_RA | 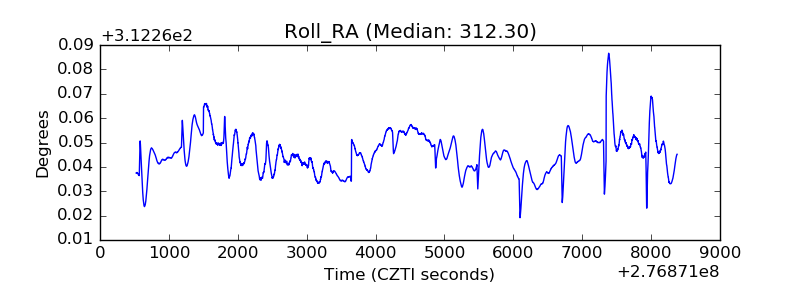 |
| Veto Counter | 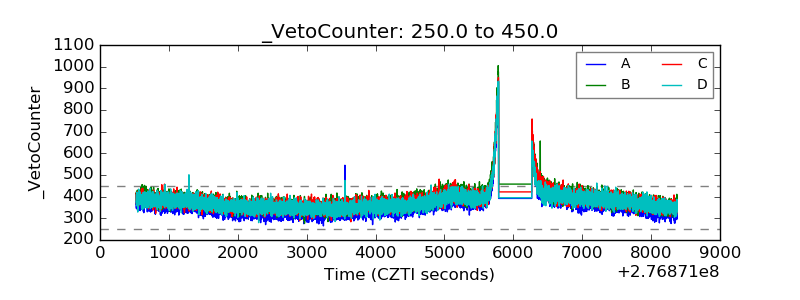 |