| Param | Original file | Final file |
|---|---|---|
| Filename | modeM0/AS1A05_069T01_9000002424_16407cztM0_level2.evt | modeM0/AS1A05_069T01_9000002424_16407cztM0_level2_quad_clean.evt |
| Size (bytes) | 337,812,480 | 51,848,640 |
| Size | 322.2 MB | 49.4 MB |
| Events in quadrant A | 2,300,194 | 316,303 |
| Events in quadrant B | 2,655,797 | 318,168 |
| Events in quadrant C | 2,399,348 | 306,432 |
| Events in quadrant D | 2,554,992 | 298,485 |
| Mode M0 | |||
|---|---|---|---|
| Quadrant | BADHDUFLAG | Total packets | Discarded packets |
| A | 0 | 9896 | 2 |
| B | 0 | 10926 | 1 |
| C | 0 | 9999 | 1 |
| D | 0 | 10903 | 1 |
| Mode M9 | |||
|---|---|---|---|
| Quadrant | BADHDUFLAG | Total packets | Discarded packets |
| A | 0 | 6 | 0 |
| B | 0 | 6 | 0 |
| C | 0 | 6 | 0 |
| D | 0 | 6 | 0 |
| Mode SS | |||
|---|---|---|---|
| Quadrant | BADHDUFLAG | Total packets | Discarded packets |
| A | 0 | 96 | 0 |
| B | 0 | 96 | 0 |
| C | 0 | 96 | 0 |
| D | 0 | 96 | 0 |
| Quadrant | Total seconds | Saturated seconds | Saturation percentage |
|---|---|---|---|
| A | 4700 | 64 | 1.361702% |
| B | 4700 | 84 | 1.787234% |
| C | 4700 | 86 | 1.829787% |
| D | 4700 | 98 | 2.085106% |
Noise dominated data is calculated using 1-second bins in cleaned event files. If a bin has >2000 counts, and if more than 50% of those come from <1% of pixels, then it is considered to be noise-dominated and hence unusable.
| Quadrant | # 1 sec bins | Bins with >0 counts | Bins with >2000 counts | High rate bins dominated by noise | Noise dominated (total time) | Noise dominated (detector-on time) | Marked lightcurve |
|---|---|---|---|---|---|---|---|
| A | 5361 | 4701 | 8 | 8 | 0.15% | 0.17% | 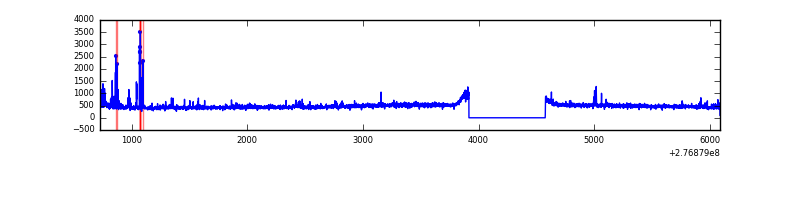 |
| B | 5361 | 4701 | 4 | 4 | 0.07% | 0.09% | 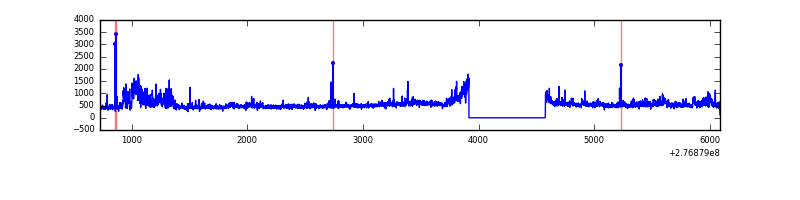 |
| C | 5361 | 4702 | 8 | 8 | 0.15% | 0.17% | 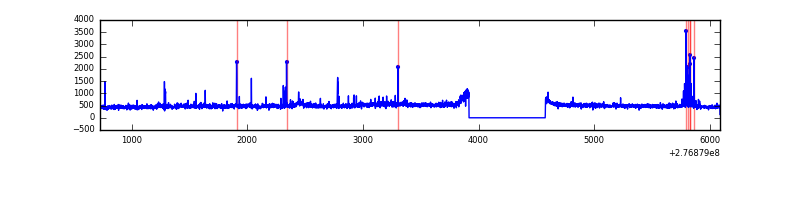 |
| D | 5361 | 4701 | 33 | 33 | 0.62% | 0.70% | 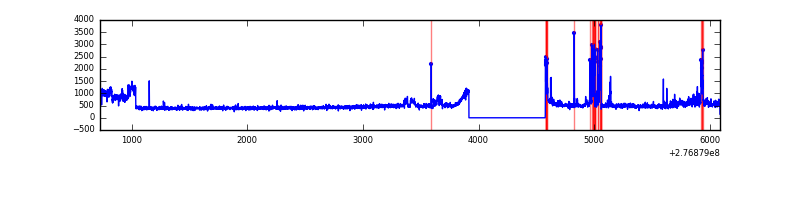 |
Top three noisy pixels from each quadrant. If the there are fewer than three noisy pixels in the level2.evt file, extra rows are filled as -1
| Pixel properties | Quadrant properties | ||||||
|---|---|---|---|---|---|---|---|
| Quadrant | DetID | PixID | Counts | Sigma | Mean | Median | Sigma |
| A | 9 | 143 | 55466 | 475.4 | 565 | 552 | 115.5 |
| A | 15 | 174 | 49791 | 426.27 | 565 | 552 | 115.5 |
| A | 15 | 223 | 12882 | 106.74 | 565 | 552 | 115.5 |
| B | 15 | 35 | 203628 | 1861.84 | 565 | 549 | 109.1 |
| B | 10 | 16 | 81233 | 739.72 | 565 | 549 | 109.1 |
| B | 4 | 216 | 61398 | 557.87 | 565 | 549 | 109.1 |
| C | 3 | 233 | 157699 | 1216.7 | 542 | 545 | 129.2 |
| C | 14 | 238 | 81735 | 628.58 | 542 | 545 | 129.2 |
| C | 0 | 207 | 33794 | 257.42 | 542 | 545 | 129.2 |
| D | 1 | 20 | 205114 | 1520.48 | 548 | 531 | 134.6 |
| D | 12 | 218 | 107837 | 797.51 | 548 | 531 | 134.6 |
| D | 2 | 122 | 90206 | 666.47 | 548 | 531 | 134.6 |
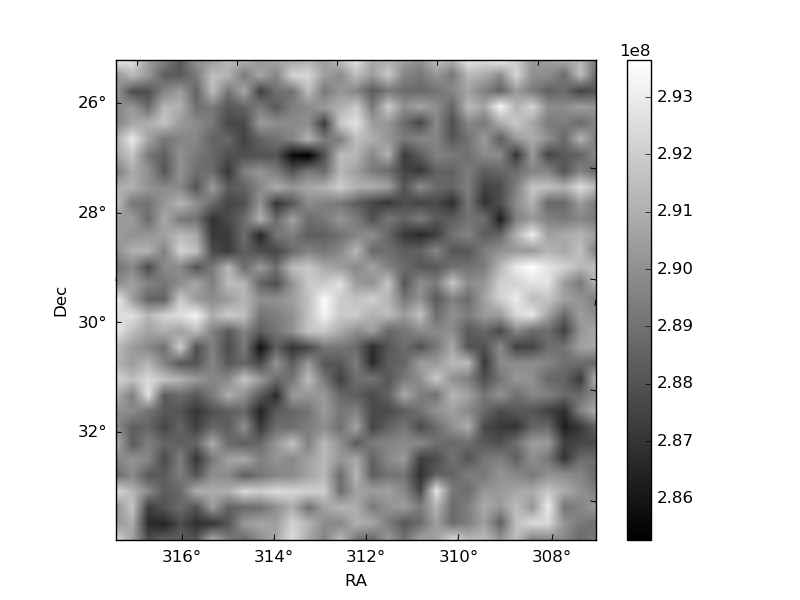
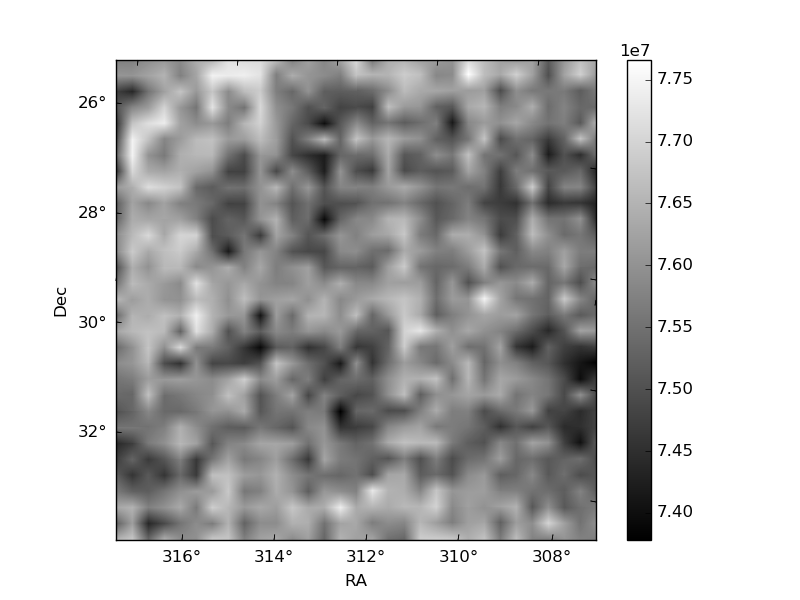
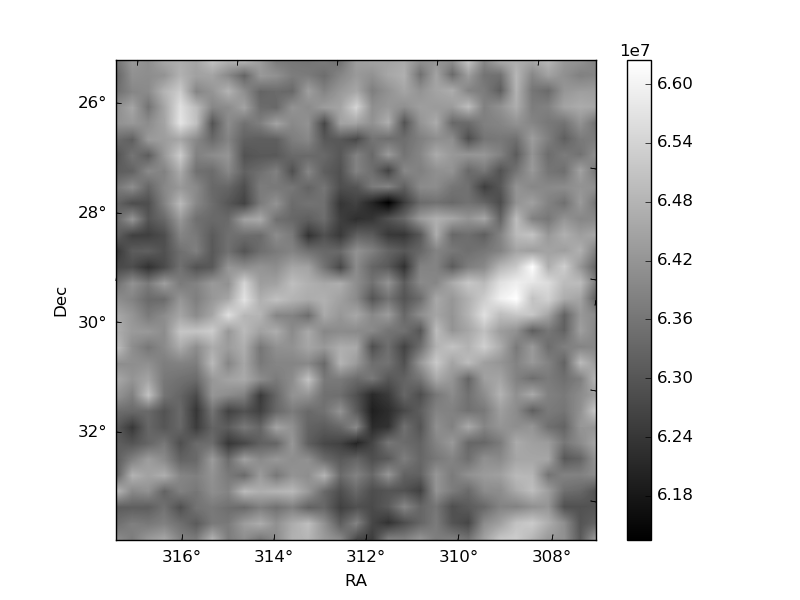
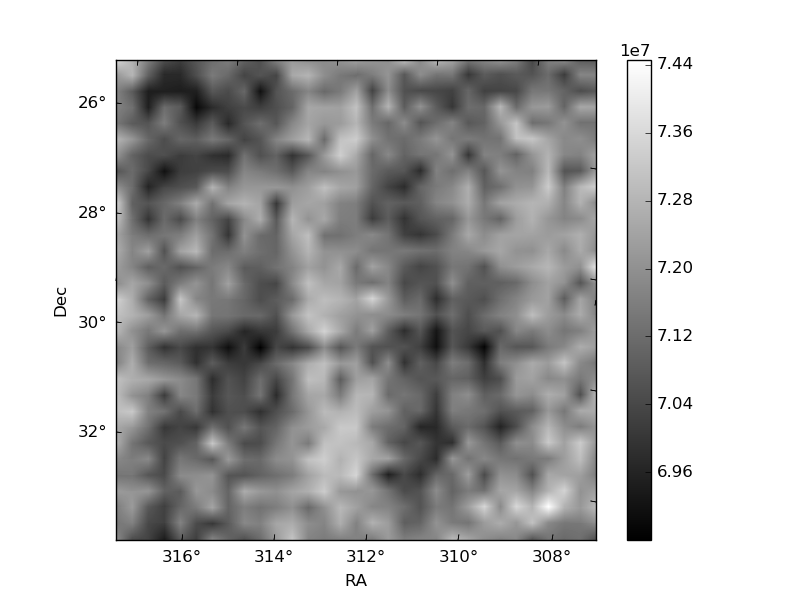
Histogram calculated using DETX and DETY for each event in the final _common_clean file
| Quadrant A | 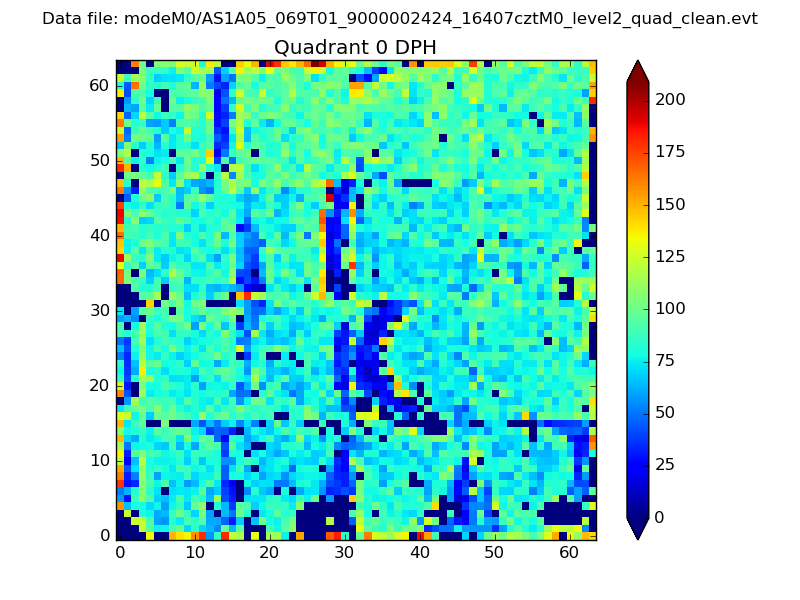 |
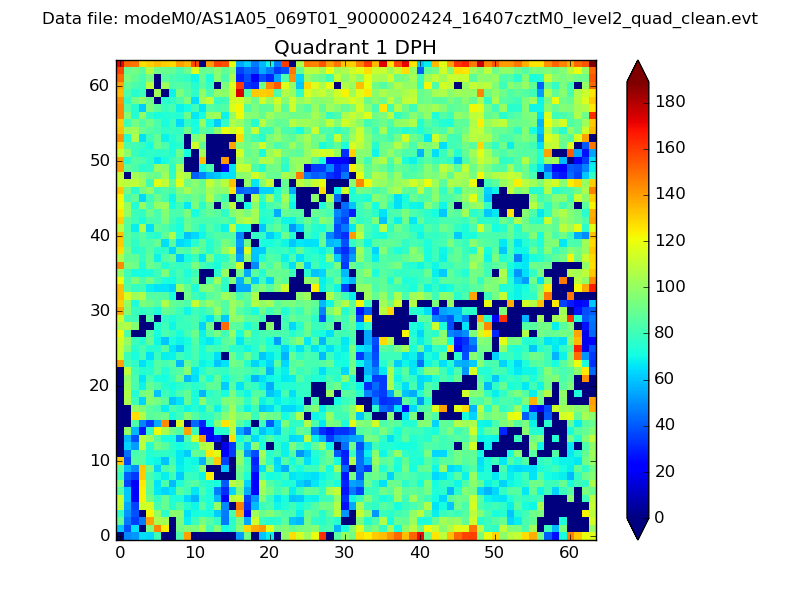 |
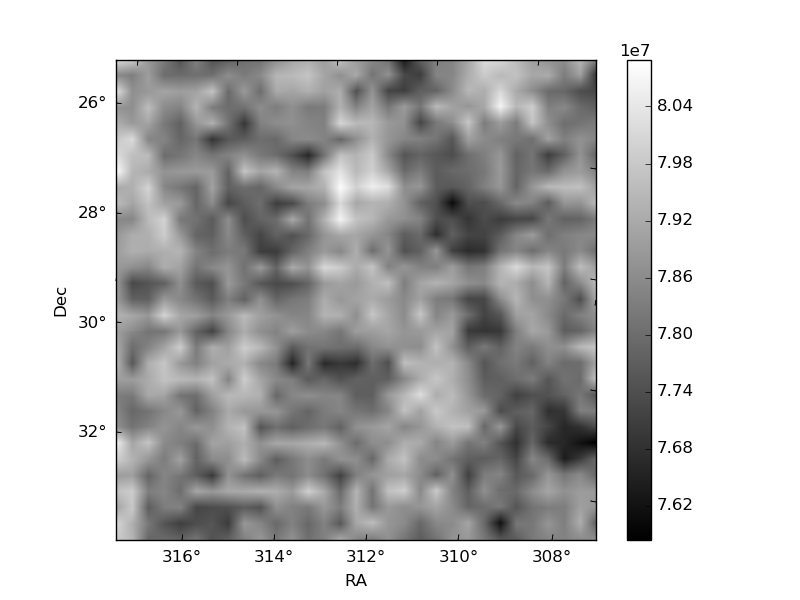
Quadrant B |
|---|---|---|---|
| Quadrant D | 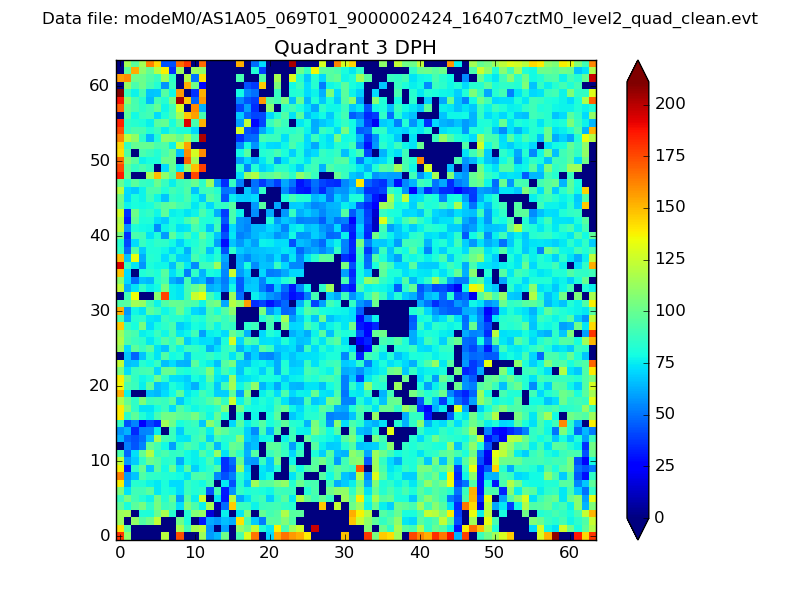 |
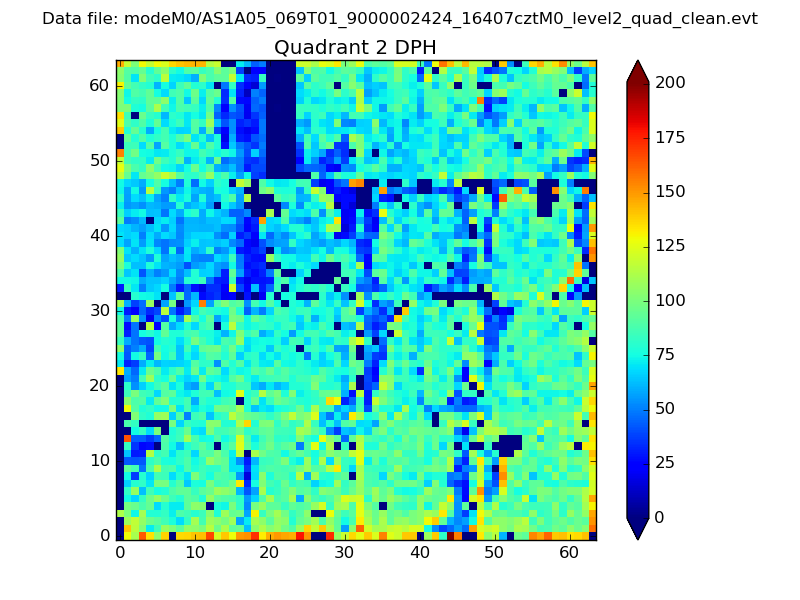 |
Quadrant C |
| Plot type | Count rate plots | Images |
|---|---|---|
| Comparison with Poisson distribution Blue bars denote a histogram of data divided into 1 sec bins. Red curve is a Poisson curve with rate = median count rate of data. |
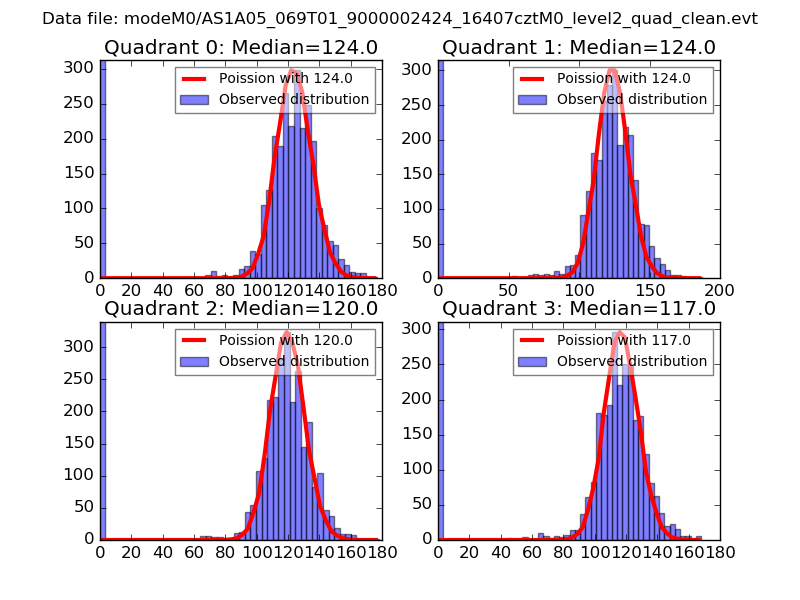 |
 |
| Quadrant-wise count rates Data is divided into 100 sec bins |
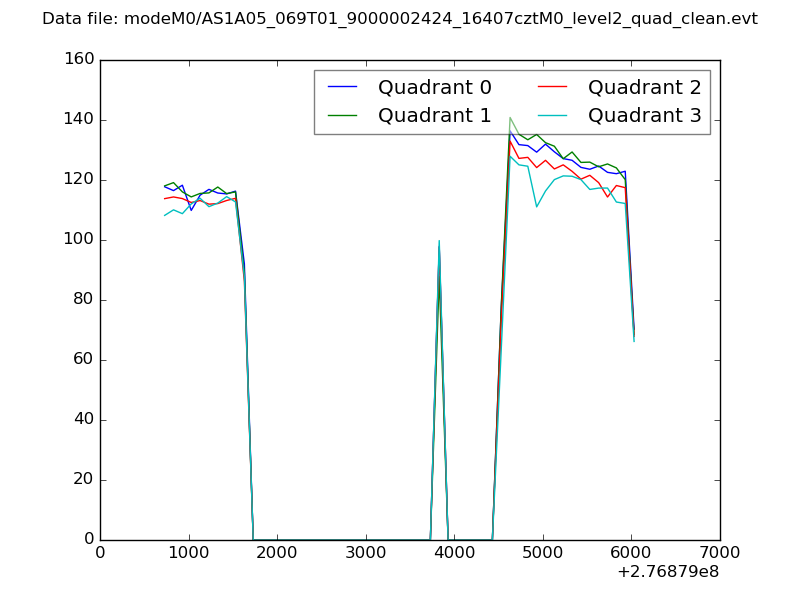 |
|
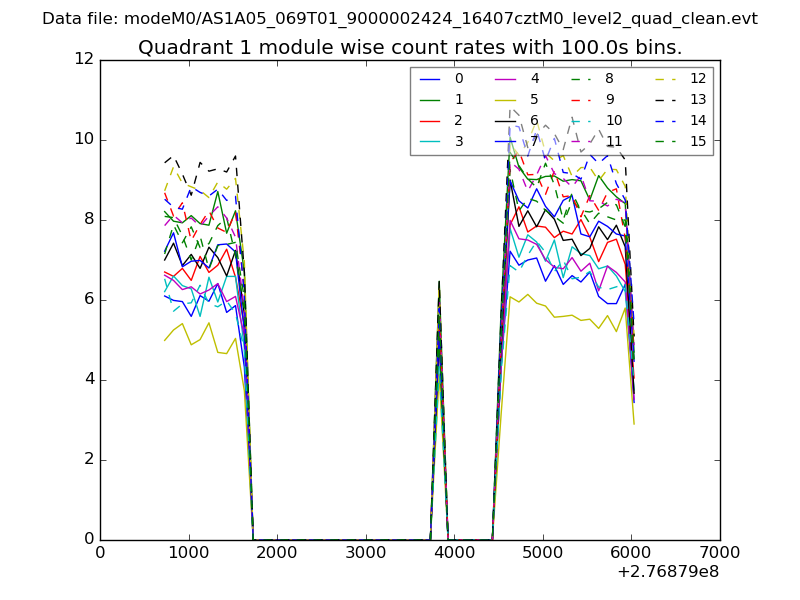
| Module-wise count rates for Quadrant A Data is divided into 100 sec bins |
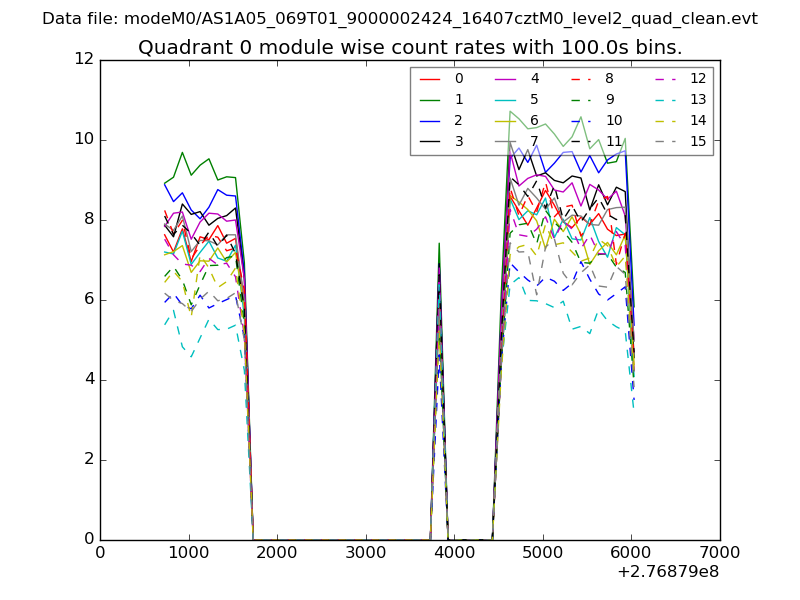 |
 |
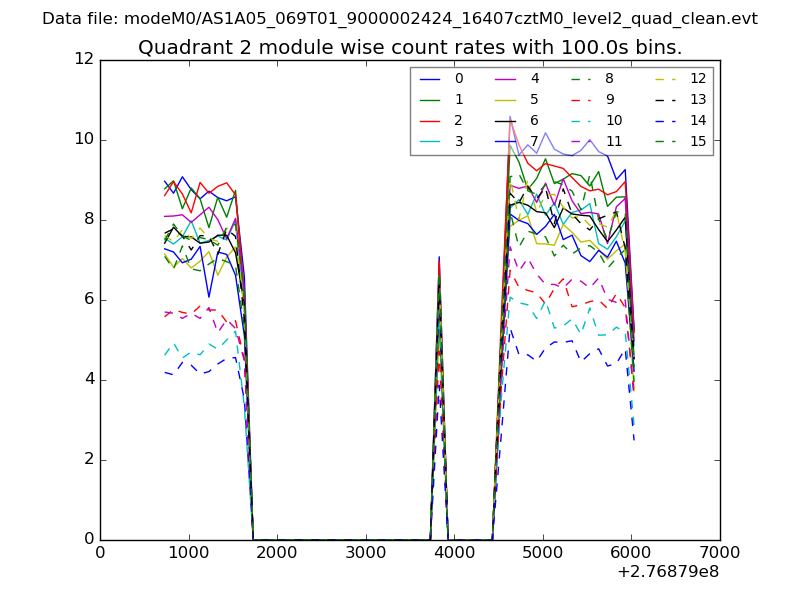
| Module-wise count rates for Quadrant B Data is divided into 100 sec bins |
 |
 |
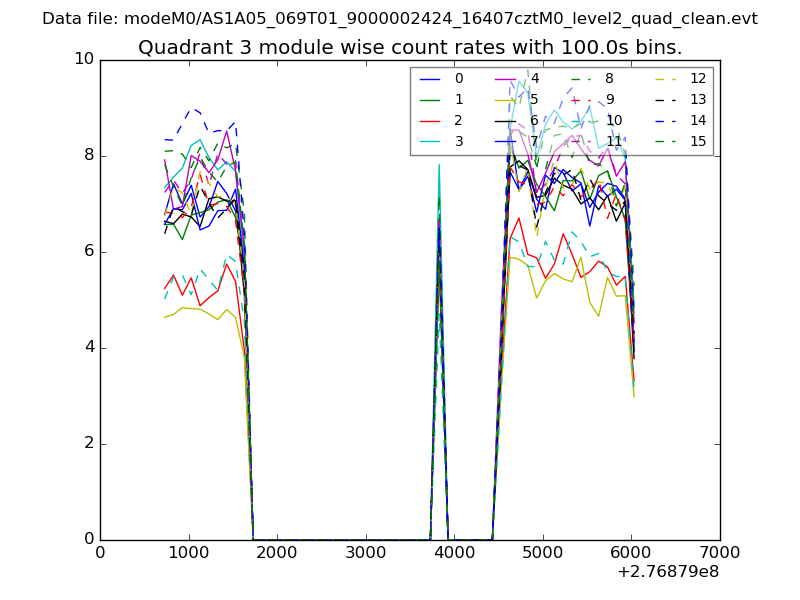
| Module-wise count rates for Quadrant C Data is divided into 100 sec bins |
 |
 |
| Module-wise count rates for Quadrant D Data is divided into 100 sec bins |
 |
 |
| Parameter | Plot |
|---|---|
| CZT HV Monitor | 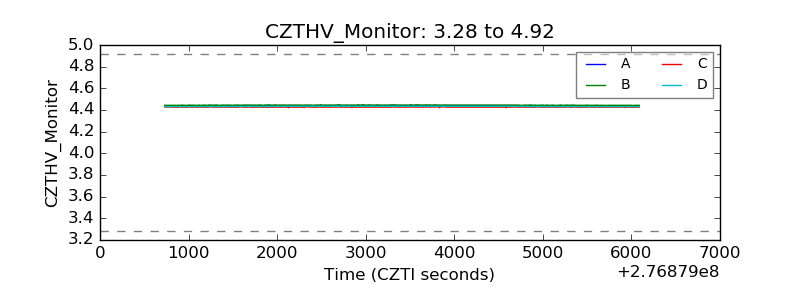 |
| D_VDD | 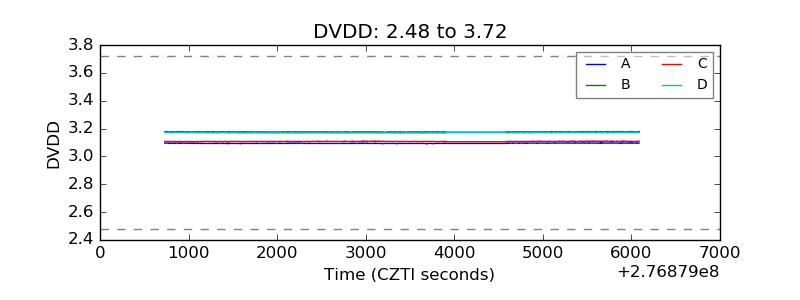 |
| Temperature 1 | 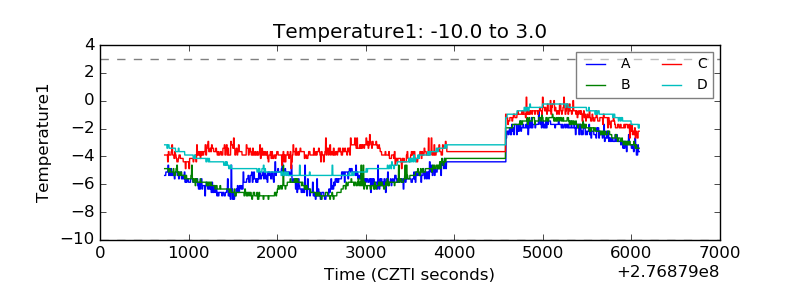 |
| Veto HV Monitor |  |
| Veto LLD | 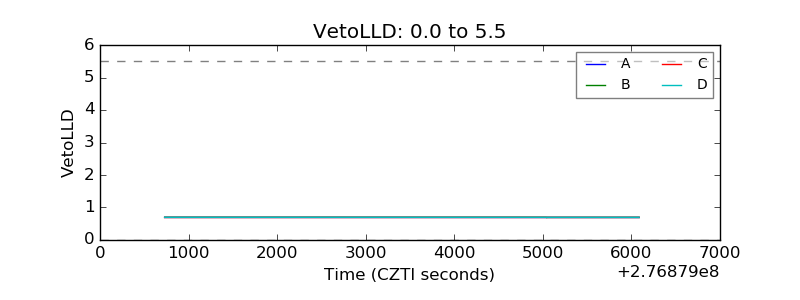 |
| Alpha Counter | 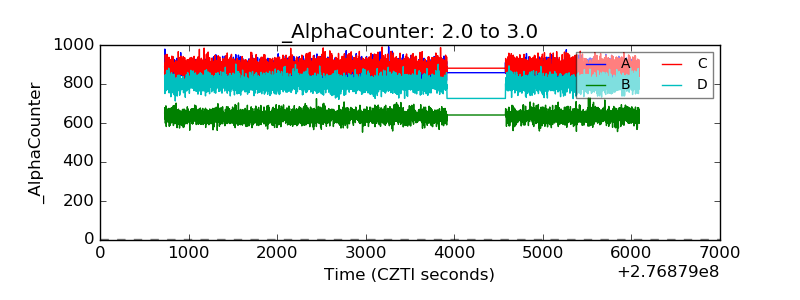 |
| _CPM_Rate | 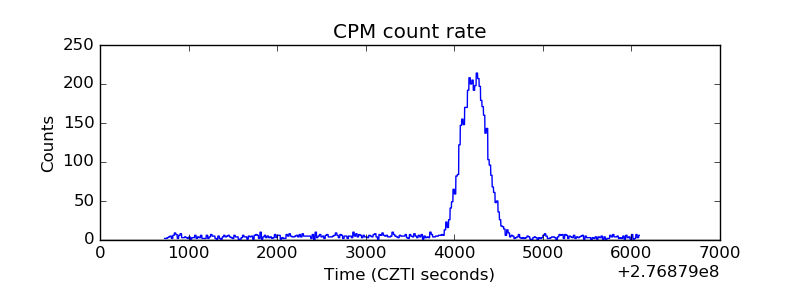 |
| CZT Counter | 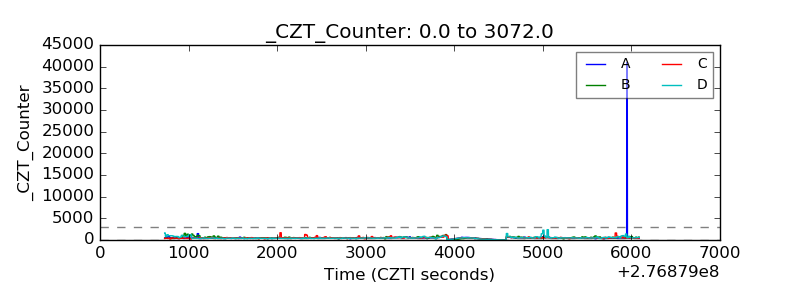 |
| +2.5 Volts monitor |  |
| +5 Volts monitor |  |
| _ROLL_ROT | 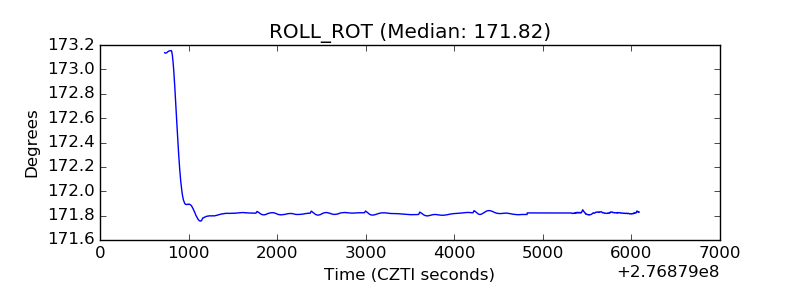 |
| _Roll_DEC |  |
| _Roll_RA | 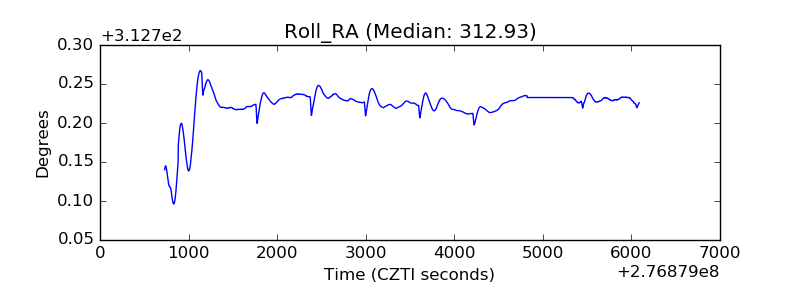 |
| Veto Counter | 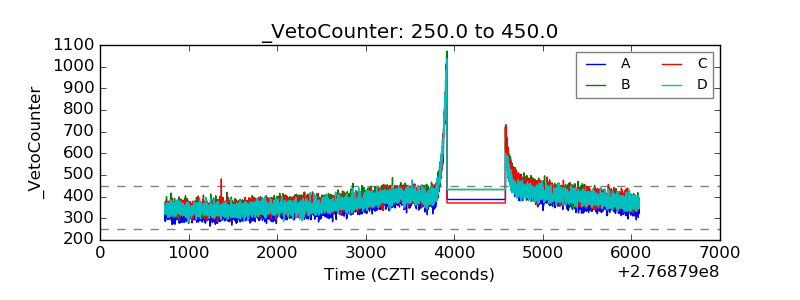 |