| Param | Original file | Final file |
|---|---|---|
| Filename | modeM0/AS1A05_069T01_9000002424_16411cztM0_level2.evt | modeM0/AS1A05_069T01_9000002424_16411cztM0_level2_quad_clean.evt |
| Size (bytes) | 496,598,400 | 91,411,200 |
| Size | 473.6 MB | 87.2 MB |
| Events in quadrant A | 3,141,230 | 595,179 |
| Events in quadrant B | 3,674,766 | 606,843 |
| Events in quadrant C | 3,376,533 | 578,573 |
| Events in quadrant D | 4,407,907 | 536,379 |
| Mode M0 | |||
|---|---|---|---|
| Quadrant | BADHDUFLAG | Total packets | Discarded packets |
| A | 0 | 13680 | 3 |
| B | 0 | 15140 | 2 |
| C | 0 | 14309 | 2 |
| D | 0 | 17586 | 2 |
| Mode M9 | |||
|---|---|---|---|
| Quadrant | BADHDUFLAG | Total packets | Discarded packets |
| A | 0 | 17 | 0 |
| B | 0 | 17 | 0 |
| C | 0 | 17 | 0 |
| D | 0 | 18 | 0 |
| Mode SS | |||
|---|---|---|---|
| Quadrant | BADHDUFLAG | Total packets | Discarded packets |
| A | 0 | 132 | 0 |
| B | 0 | 132 | 0 |
| C | 0 | 132 | 0 |
| D | 0 | 132 | 0 |
| Quadrant | Total seconds | Saturated seconds | Saturation percentage |
|---|---|---|---|
| A | 6464 | 29 | 0.448639% |
| B | 6464 | 143 | 2.212252% |
| C | 6464 | 74 | 1.144802% |
| D | 6464 | 363 | 5.615718% |
Noise dominated data is calculated using 1-second bins in cleaned event files. If a bin has >2000 counts, and if more than 50% of those come from <1% of pixels, then it is considered to be noise-dominated and hence unusable.
| Quadrant | # 1 sec bins | Bins with >0 counts | Bins with >2000 counts | High rate bins dominated by noise | Noise dominated (total time) | Noise dominated (detector-on time) | Marked lightcurve |
|---|---|---|---|---|---|---|---|
| A | 7605 | 6466 | 2 | 2 | 0.03% | 0.03% | 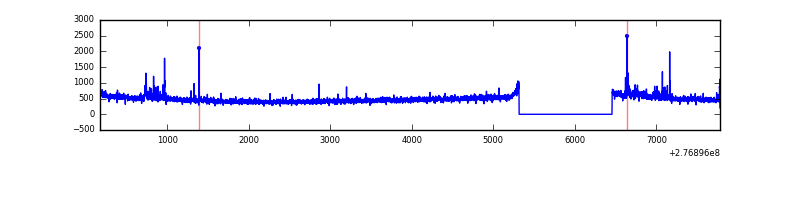 |
| B | 7605 | 6466 | 75 | 75 | 0.99% | 1.16% | 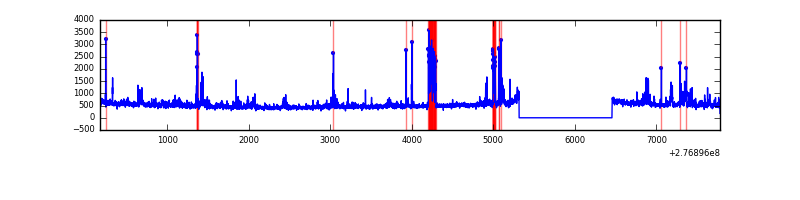 |
| C | 7605 | 6466 | 1 | 1 | 0.01% | 0.02% | 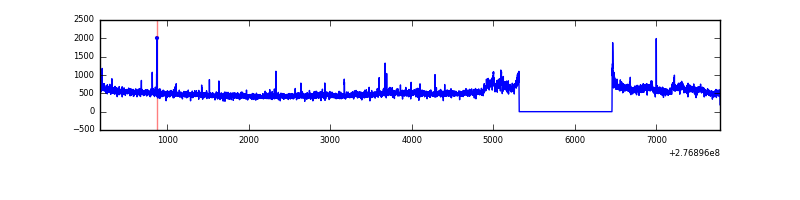 |
| D | 7605 | 6466 | 304 | 304 | 4.00% | 4.70% | 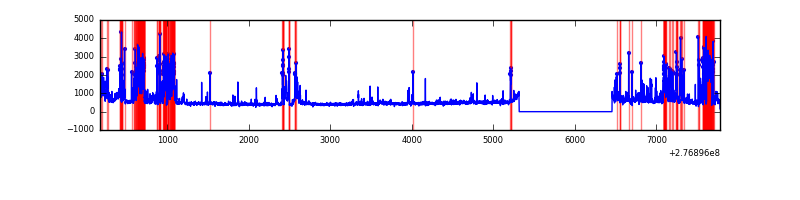 |
Top three noisy pixels from each quadrant. If the there are fewer than three noisy pixels in the level2.evt file, extra rows are filled as -1
| Pixel properties | Quadrant properties | ||||||
|---|---|---|---|---|---|---|---|
| Quadrant | DetID | PixID | Counts | Sigma | Mean | Median | Sigma |
| A | 15 | 174 | 63077 | 392.72 | 786 | 769 | 158.7 |
| A | 9 | 143 | 44322 | 274.51 | 786 | 769 | 158.7 |
| A | 15 | 223 | 14215 | 84.75 | 786 | 769 | 158.7 |
| B | 10 | 16 | 268490 | 1781.5 | 787 | 766 | 150.3 |
| B | 15 | 35 | 80007 | 527.29 | 787 | 766 | 150.3 |
| B | 0 | 189 | 73893 | 486.6 | 787 | 766 | 150.3 |
| C | 3 | 233 | 270257 | 1523.35 | 760 | 767 | 176.9 |
| C | 14 | 238 | 117311 | 658.79 | 760 | 767 | 176.9 |
| C | 7 | 247 | 12471 | 66.16 | 760 | 767 | 176.9 |
| D | 12 | 218 | 704709 | 3877.48 | 747 | 726 | 181.6 |
| D | 15 | 0 | 273994 | 1505.14 | 747 | 726 | 181.6 |
| D | 2 | 122 | 261467 | 1436.14 | 747 | 726 | 181.6 |
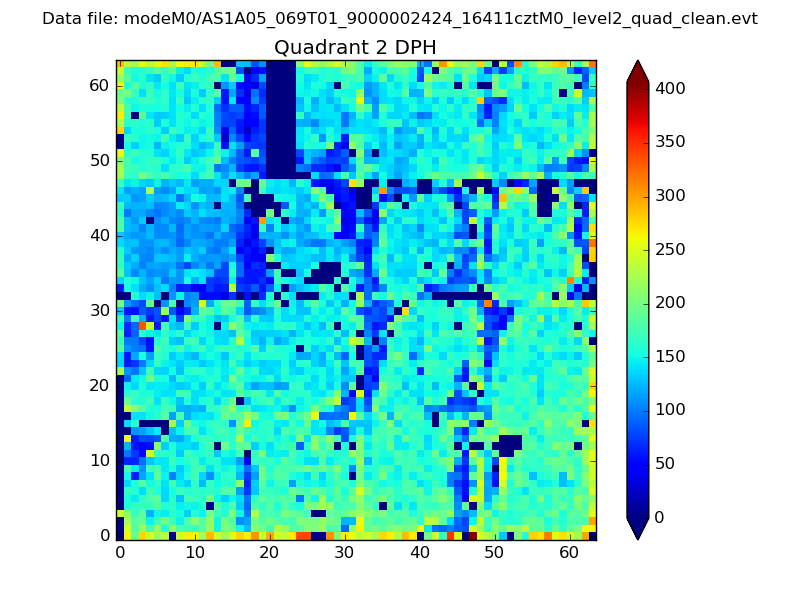
Histogram calculated using DETX and DETY for each event in the final _common_clean file
| Quadrant A | 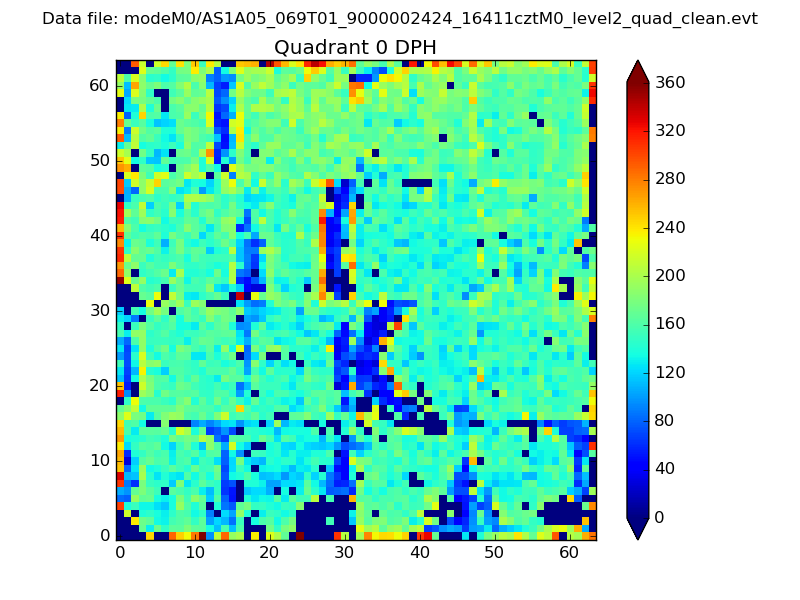 |
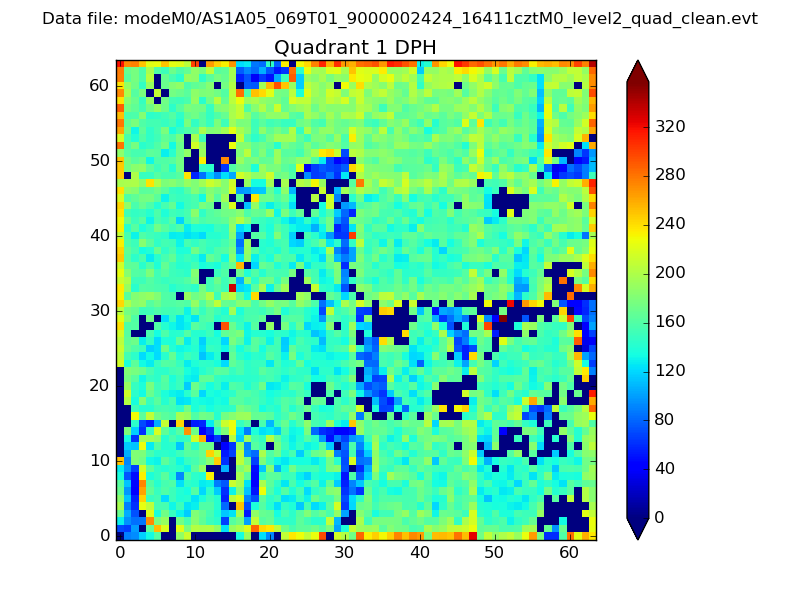 |
Quadrant B |
|---|---|---|---|
| Quadrant D | 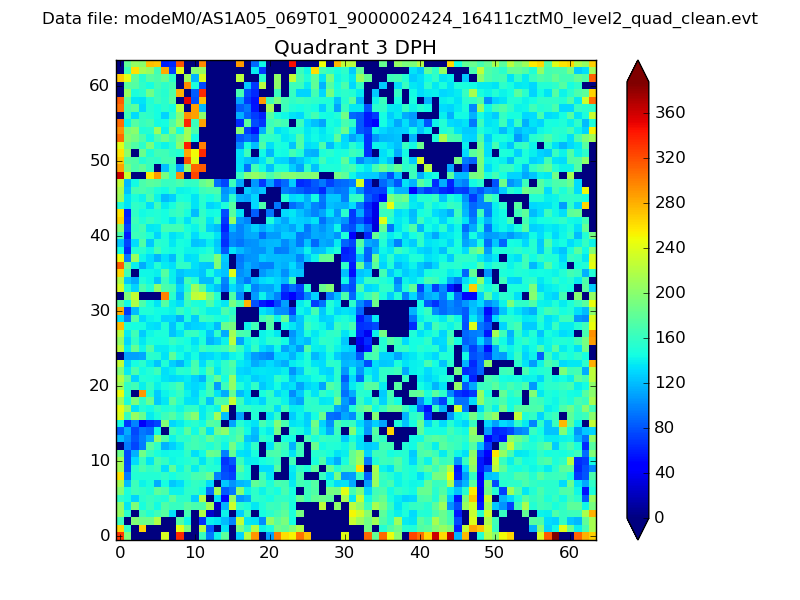 |
 |
Quadrant C |
| Plot type | Count rate plots | Images |
|---|---|---|
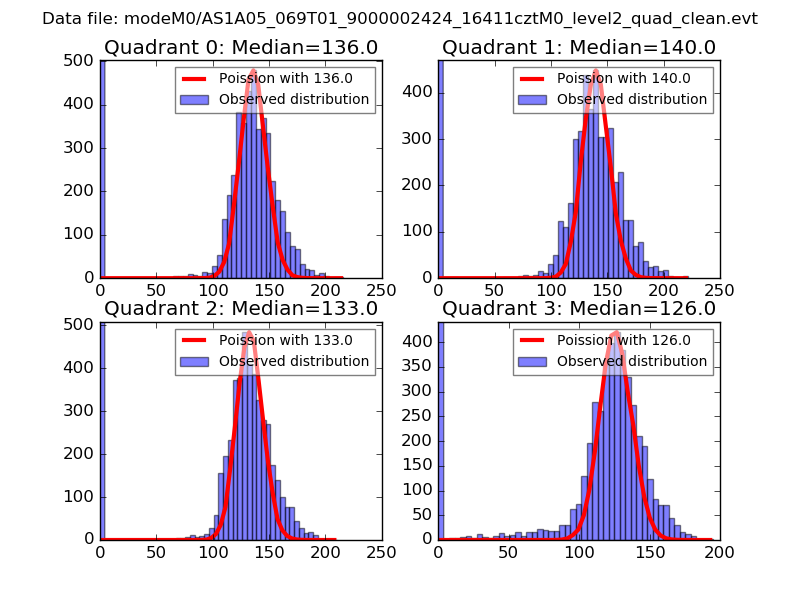
| Comparison with Poisson distribution Blue bars denote a histogram of data divided into 1 sec bins. Red curve is a Poisson curve with rate = median count rate of data. |
 |
 |
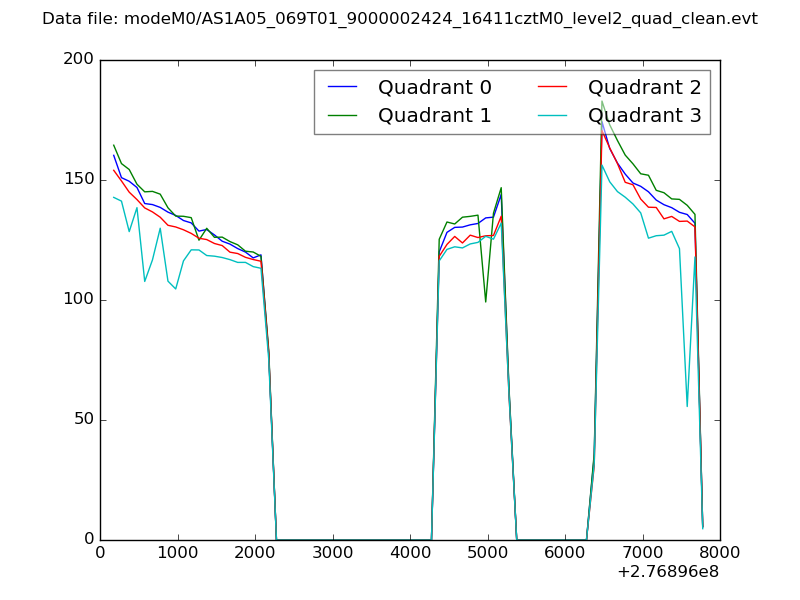
| Quadrant-wise count rates Data is divided into 100 sec bins |
 |
|
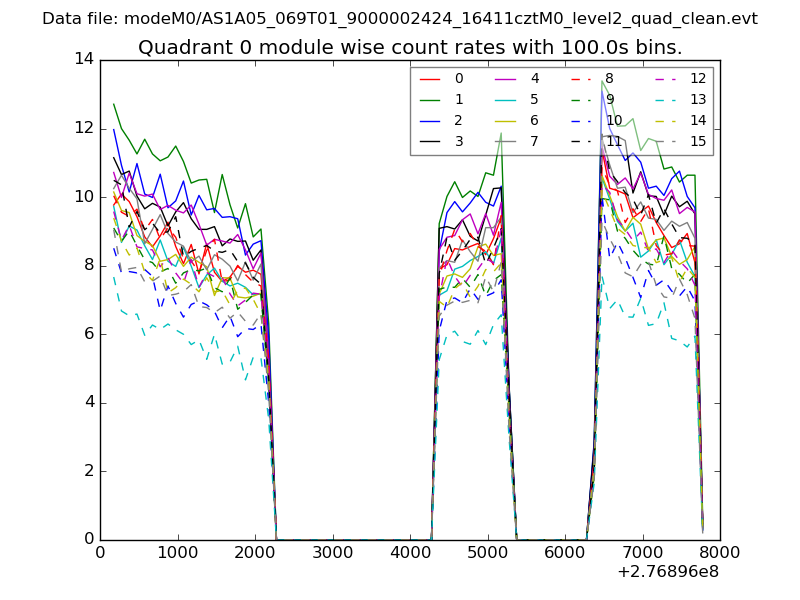
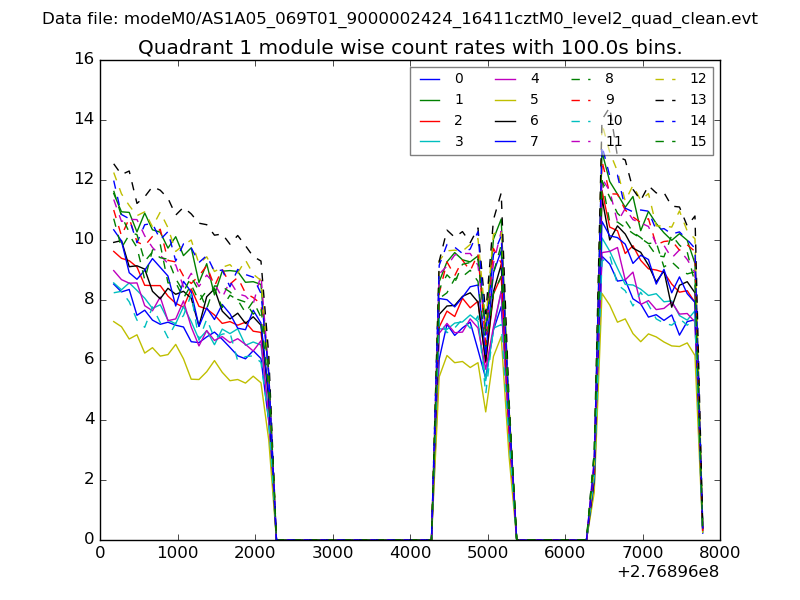
| Module-wise count rates for Quadrant A Data is divided into 100 sec bins |
 |
 |
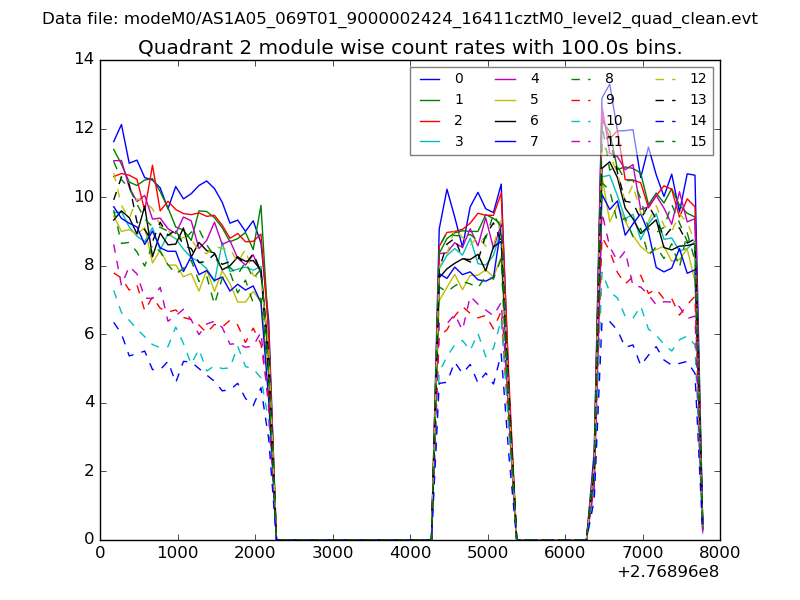
| Module-wise count rates for Quadrant B Data is divided into 100 sec bins |
 |
 |
| Module-wise count rates for Quadrant C Data is divided into 100 sec bins |
 |
 |
| Module-wise count rates for Quadrant D Data is divided into 100 sec bins |
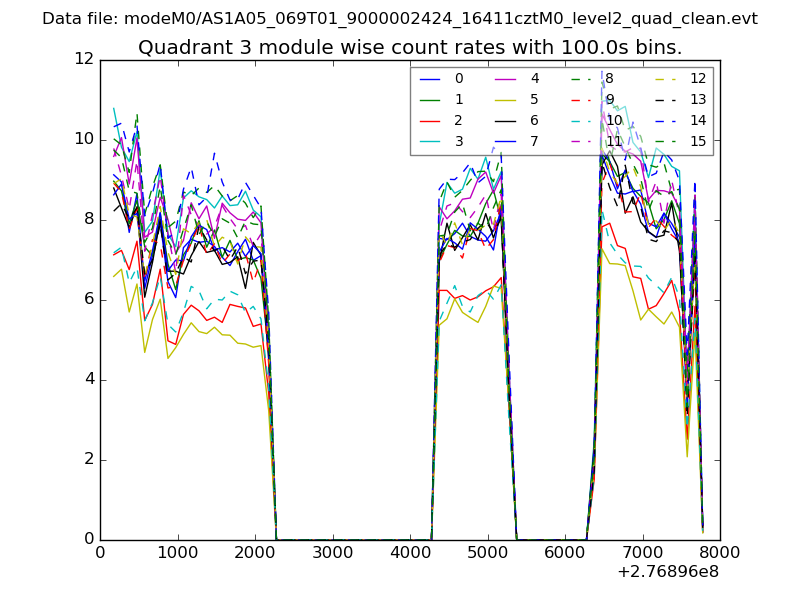 |
 |
| Parameter | Plot |
|---|---|
| CZT HV Monitor | 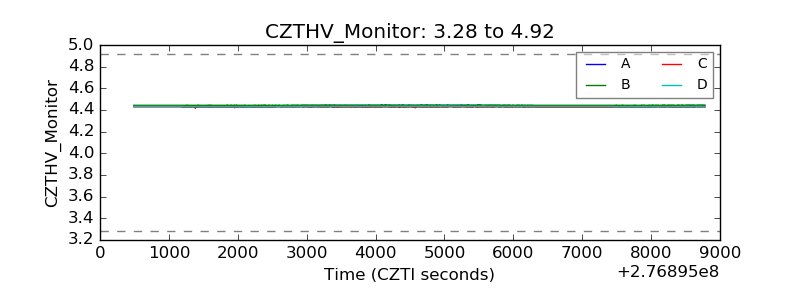 |
| D_VDD | 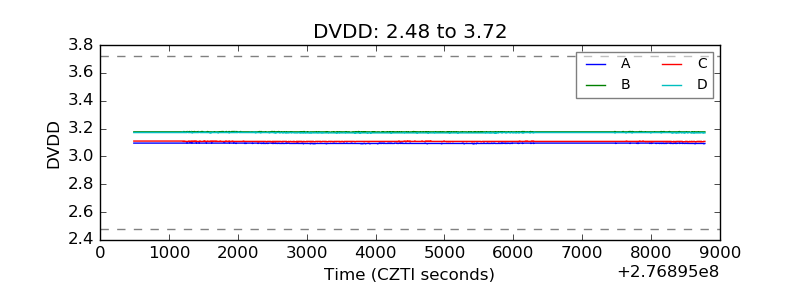 |
| Temperature 1 | 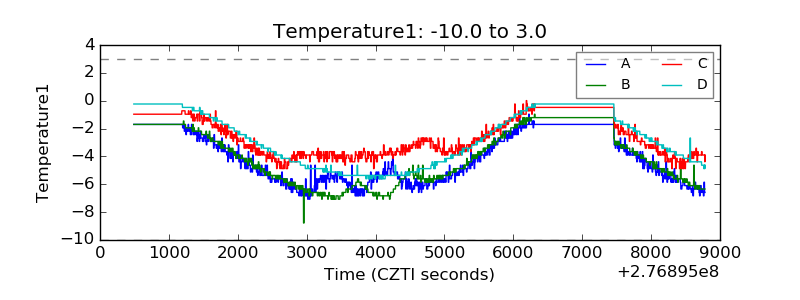 |
| Veto HV Monitor | 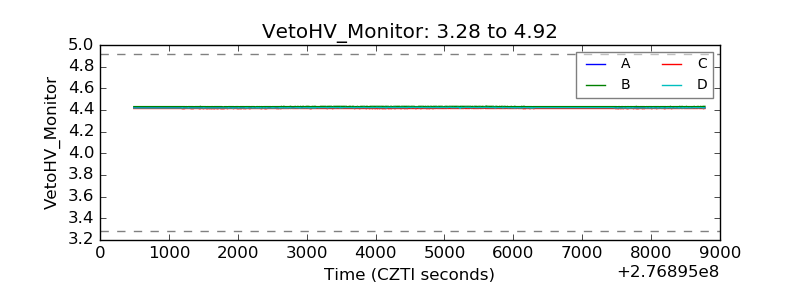 |
| Veto LLD | 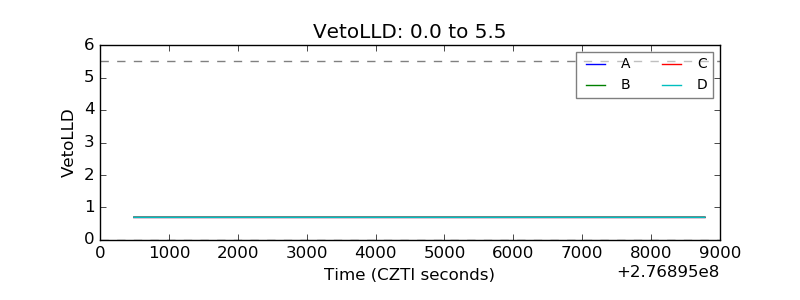 |
| Alpha Counter | 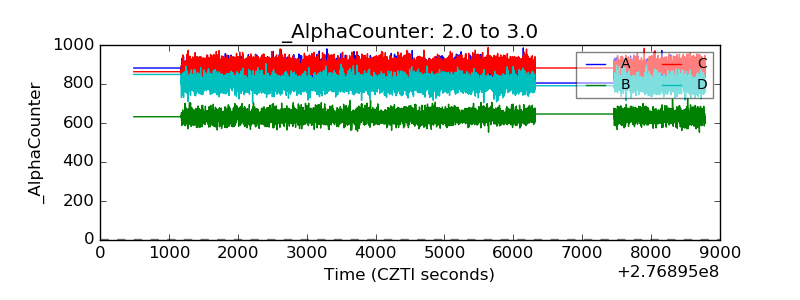 |
| _CPM_Rate | 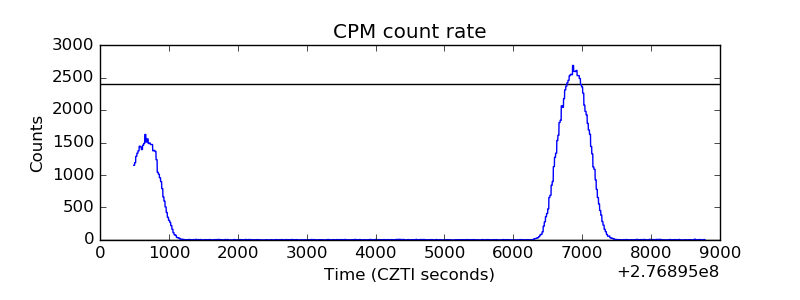 |
| CZT Counter | 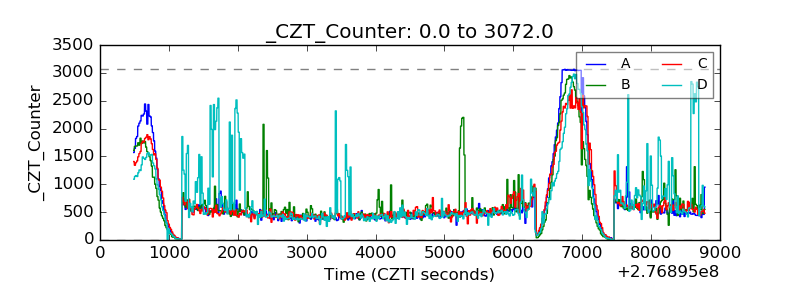 |
| +2.5 Volts monitor | 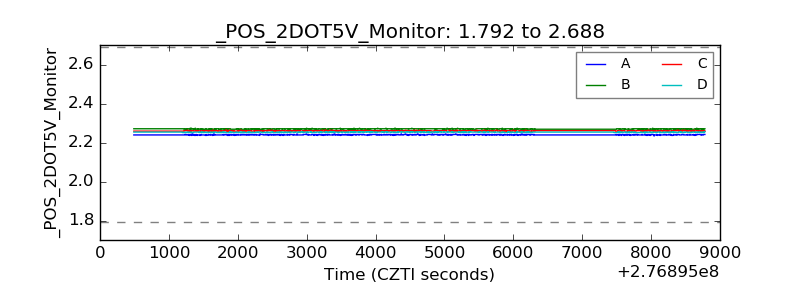 |
| +5 Volts monitor | 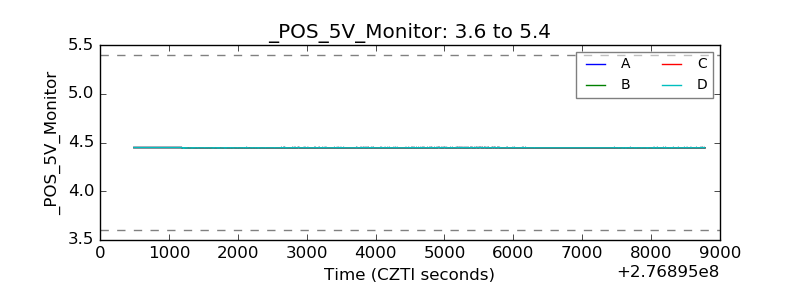 |
| _ROLL_ROT | 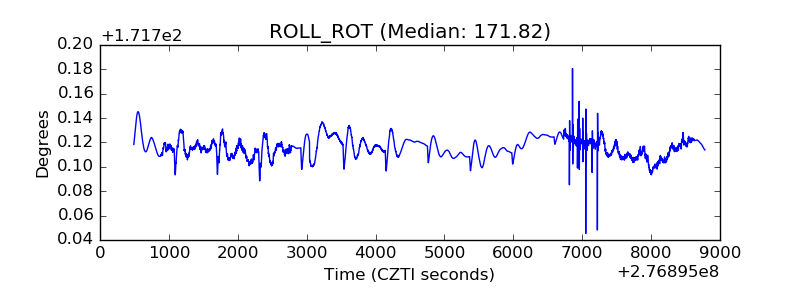 |
| _Roll_DEC | 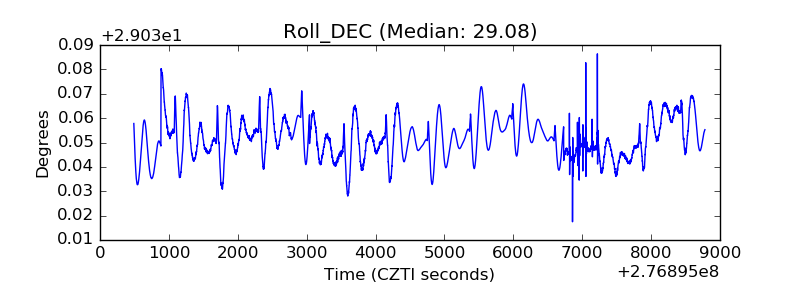 |
| _Roll_RA | 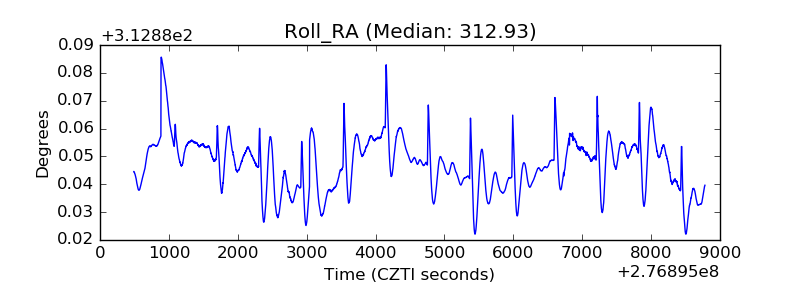 |
| Veto Counter | 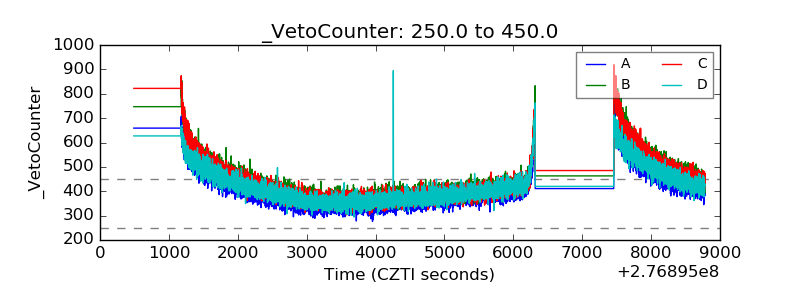 |