| Param | Original file | Final file |
|---|---|---|
| Filename | modeM0/AS1A05_069T01_9000002424_16412cztM0_level2.evt | modeM0/AS1A05_069T01_9000002424_16412cztM0_level2_quad_clean.evt |
| Size (bytes) | 489,458,880 | 90,264,960 |
| Size | 466.8 MB | 86.1 MB |
| Events in quadrant A | 3,432,884 | 582,909 |
| Events in quadrant B | 3,450,991 | 609,862 |
| Events in quadrant C | 3,396,480 | 571,829 |
| Events in quadrant D | 4,122,014 | 535,697 |
| Mode M0 | |||
|---|---|---|---|
| Quadrant | BADHDUFLAG | Total packets | Discarded packets |
| A | 0 | 14233 | 3 |
| B | 0 | 14273 | 2 |
| C | 0 | 13970 | 2 |
| D | 0 | 16485 | 2 |
| Mode M9 | |||
|---|---|---|---|
| Quadrant | BADHDUFLAG | Total packets | Discarded packets |
| A | 0 | 19 | 0 |
| B | 0 | 19 | 0 |
| C | 0 | 19 | 0 |
| D | 0 | 20 | 0 |
| Mode SS | |||
|---|---|---|---|
| Quadrant | BADHDUFLAG | Total packets | Discarded packets |
| A | 0 | 126 | 0 |
| B | 0 | 126 | 0 |
| C | 0 | 126 | 0 |
| D | 0 | 126 | 0 |
| Quadrant | Total seconds | Saturated seconds | Saturation percentage |
|---|---|---|---|
| A | 6205 | 128 | 2.062853% |
| B | 6205 | 30 | 0.483481% |
| C | 6205 | 68 | 1.095890% |
| D | 6205 | 235 | 3.787268% |
Noise dominated data is calculated using 1-second bins in cleaned event files. If a bin has >2000 counts, and if more than 50% of those come from <1% of pixels, then it is considered to be noise-dominated and hence unusable.
| Quadrant | # 1 sec bins | Bins with >0 counts | Bins with >2000 counts | High rate bins dominated by noise | Noise dominated (total time) | Noise dominated (detector-on time) | Marked lightcurve |
|---|---|---|---|---|---|---|---|
| A | 7476 | 6207 | 119 | 119 | 1.59% | 1.92% | 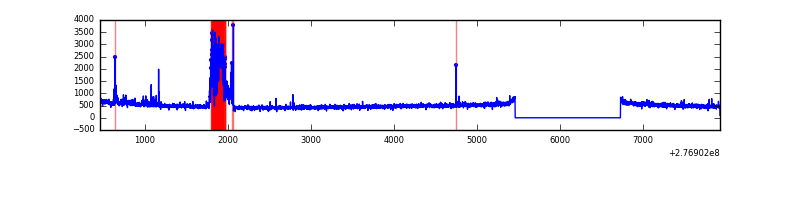 |
| B | 7476 | 6207 | 10 | 10 | 0.13% | 0.16% | 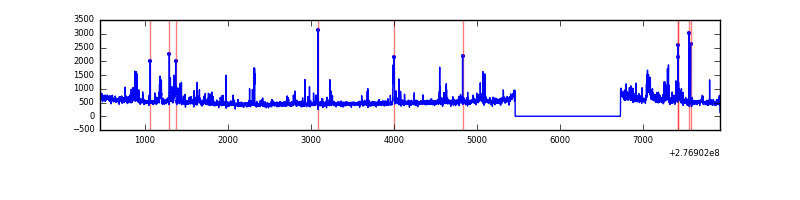 |
| C | 7476 | 6207 | 11 | 11 | 0.15% | 0.18% | 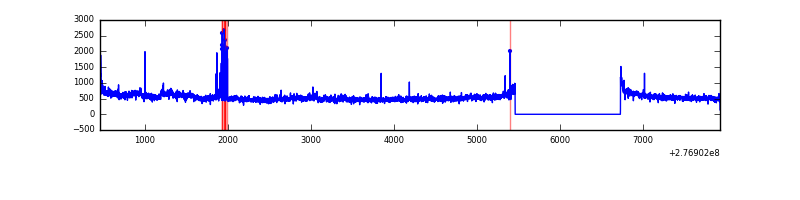 |
| D | 7476 | 6207 | 204 | 204 | 2.73% | 3.29% | 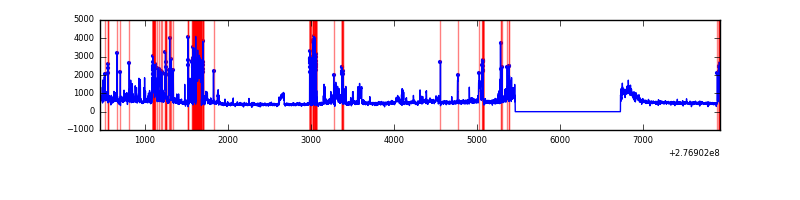 |
Top three noisy pixels from each quadrant. If the there are fewer than three noisy pixels in the level2.evt file, extra rows are filled as -1
| Pixel properties | Quadrant properties | ||||||
|---|---|---|---|---|---|---|---|
| Quadrant | DetID | PixID | Counts | Sigma | Mean | Median | Sigma |
| A | 15 | 174 | 439510 | 2852.7 | 766 | 751 | 153.8 |
| A | 9 | 143 | 33299 | 211.62 | 766 | 751 | 153.8 |
| A | 15 | 223 | 15538 | 96.14 | 766 | 751 | 153.8 |
| B | 10 | 16 | 107623 | 725.66 | 781 | 762 | 147.3 |
| B | 15 | 35 | 107209 | 722.85 | 781 | 762 | 147.3 |
| B | 0 | 189 | 48403 | 323.52 | 781 | 762 | 147.3 |
| C | 3 | 233 | 349966 | 2001.49 | 746 | 754 | 174.5 |
| C | 14 | 238 | 115468 | 657.48 | 746 | 754 | 174.5 |
| C | 7 | 247 | 11660 | 62.51 | 746 | 754 | 174.5 |
| D | 15 | 0 | 489191 | 2734.49 | 735 | 714 | 178.6 |
| D | 2 | 122 | 486924 | 2721.8 | 735 | 714 | 178.6 |
| D | 12 | 218 | 204150 | 1138.83 | 735 | 714 | 178.6 |
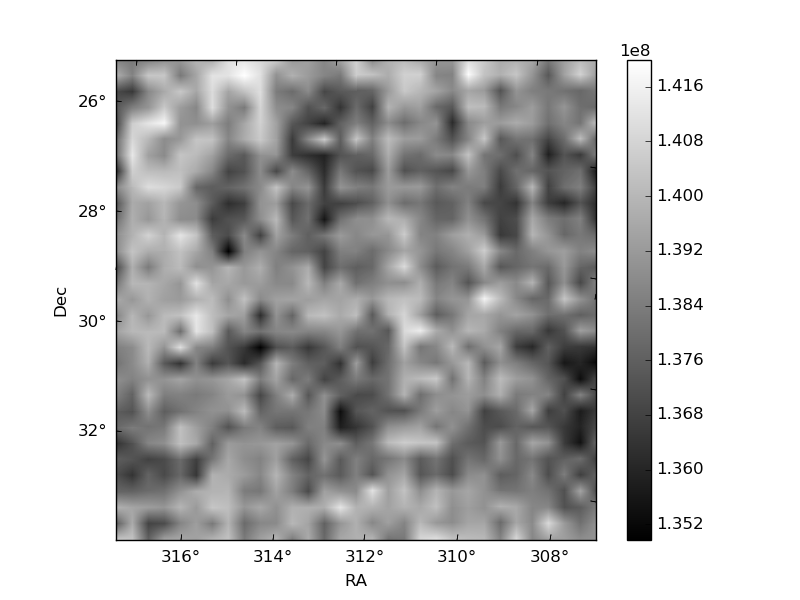
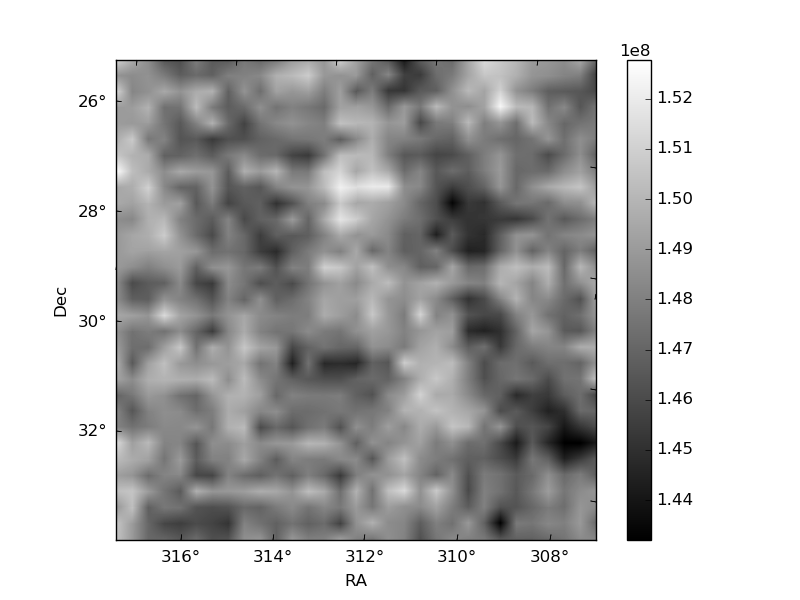
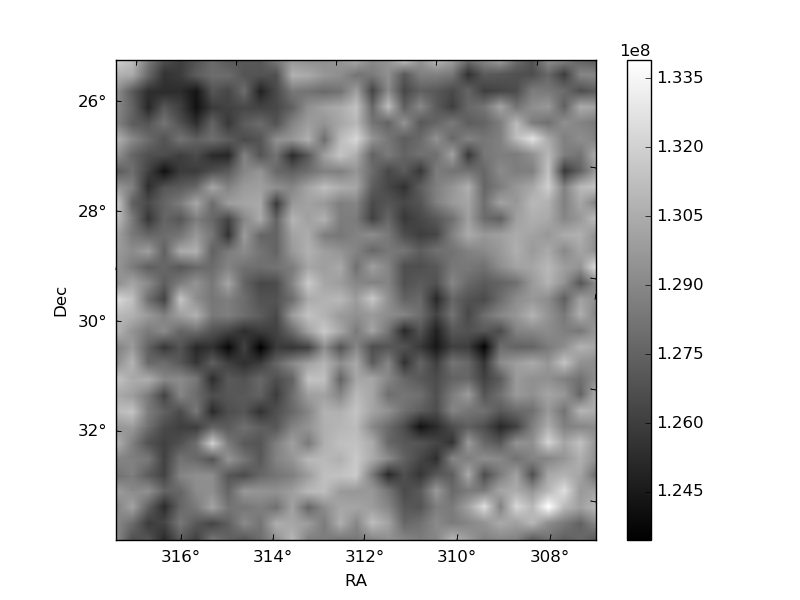
Histogram calculated using DETX and DETY for each event in the final _common_clean file
| Quadrant A | 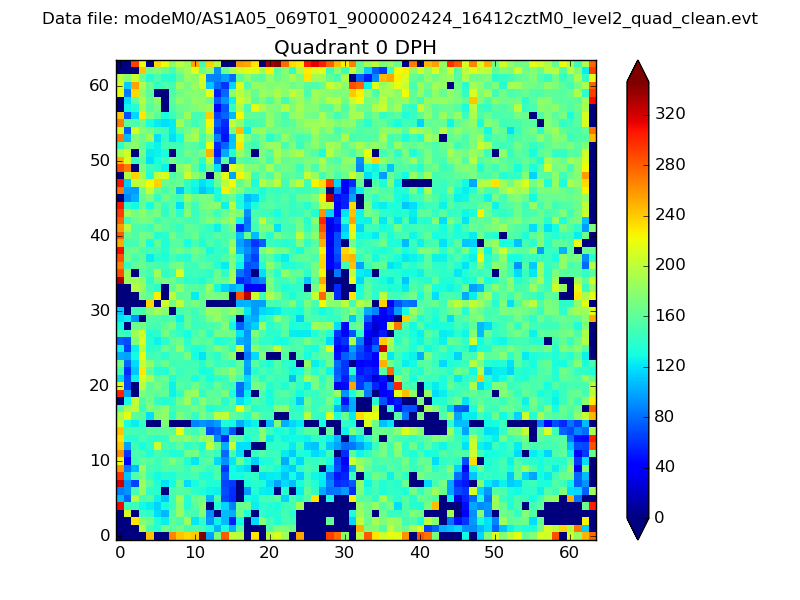 |
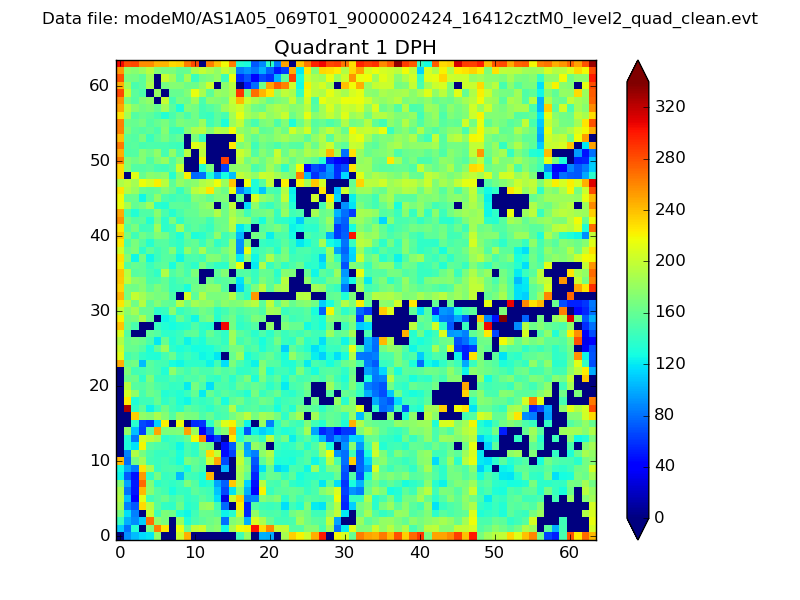 |
Quadrant B |
|---|---|---|---|
| Quadrant D | 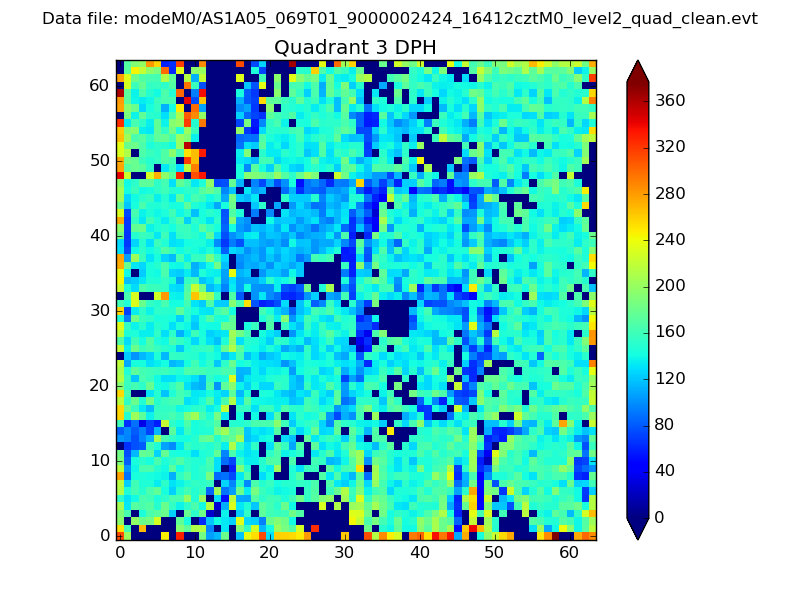 |
 |
Quadrant C |
| Plot type | Count rate plots | Images |
|---|---|---|
| Comparison with Poisson distribution Blue bars denote a histogram of data divided into 1 sec bins. Red curve is a Poisson curve with rate = median count rate of data. |
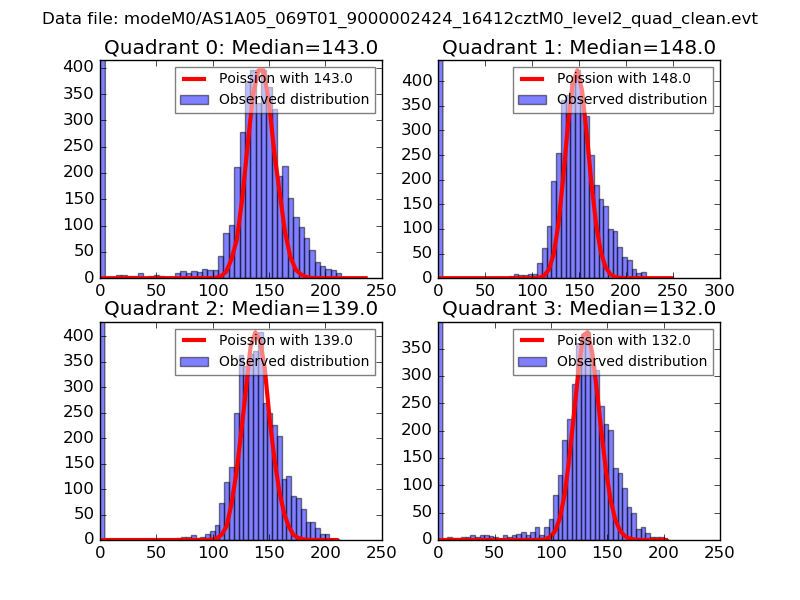 |
 |
| Quadrant-wise count rates Data is divided into 100 sec bins |
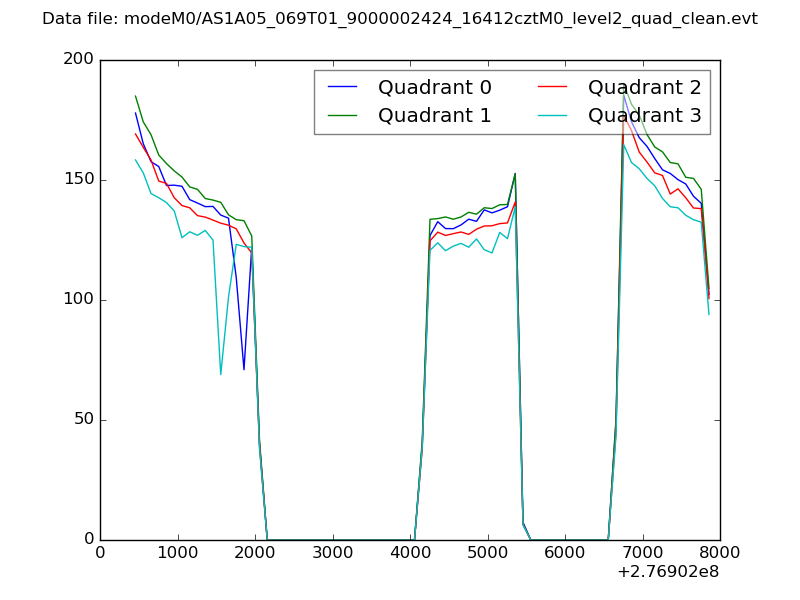 |
|
| Module-wise count rates for Quadrant A Data is divided into 100 sec bins |
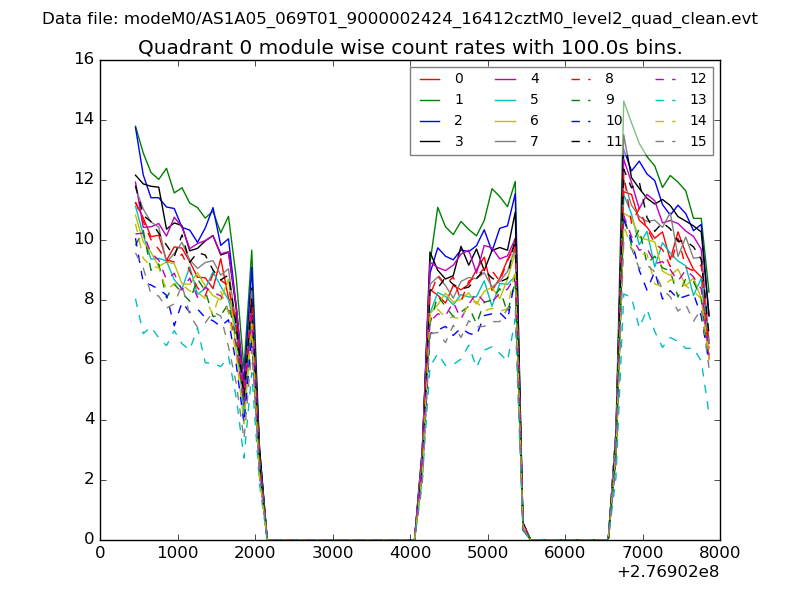 |
 |
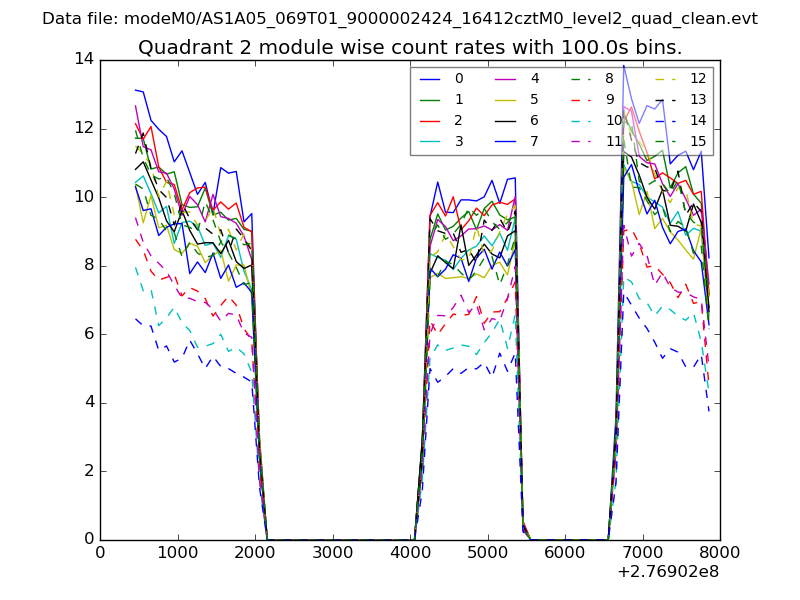
| Module-wise count rates for Quadrant B Data is divided into 100 sec bins |
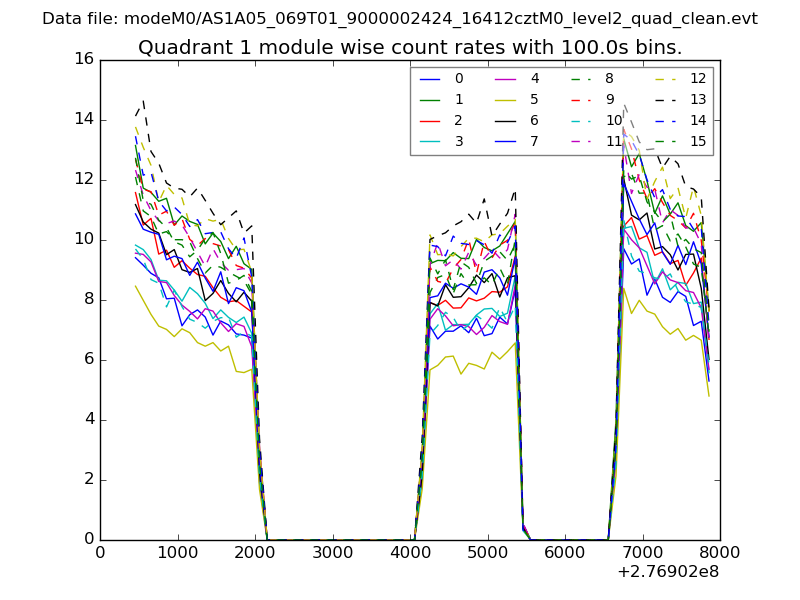 |
 |
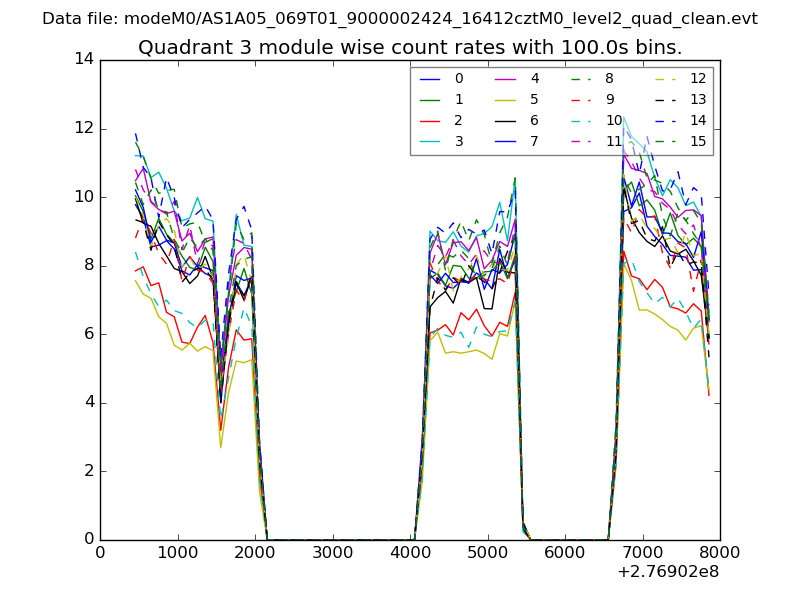
| Module-wise count rates for Quadrant C Data is divided into 100 sec bins |
 |
 |
| Module-wise count rates for Quadrant D Data is divided into 100 sec bins |
 |
 |
| Parameter | Plot |
|---|---|
| CZT HV Monitor | 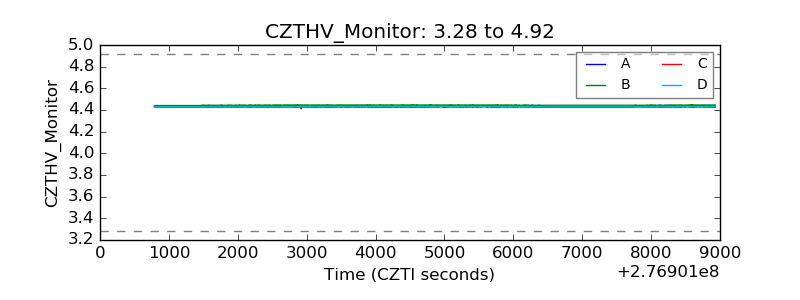 |
| D_VDD |  |
| Temperature 1 | 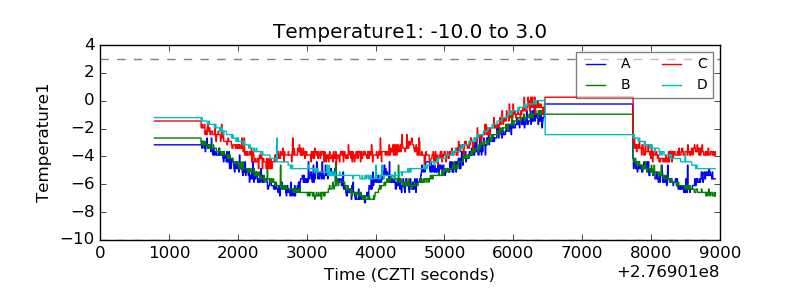 |
| Veto HV Monitor |  |
| Veto LLD | 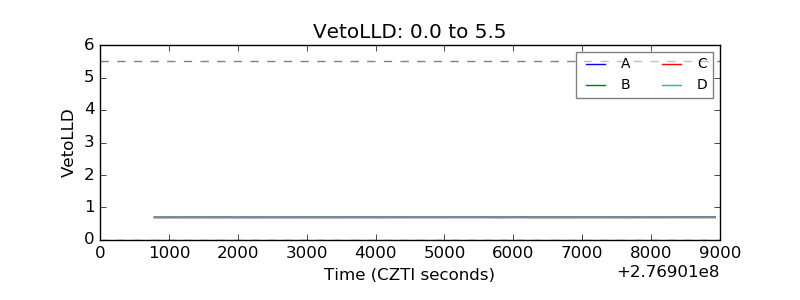 |
| Alpha Counter | 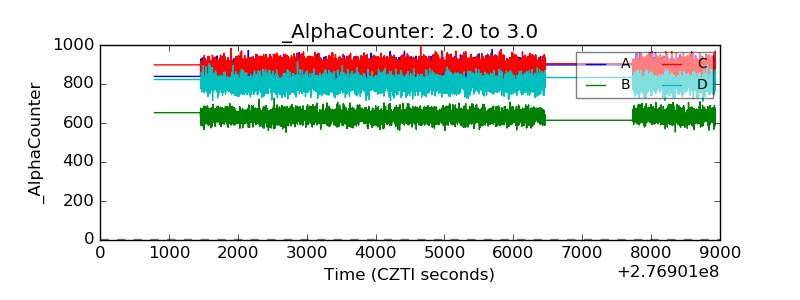 |
| _CPM_Rate | 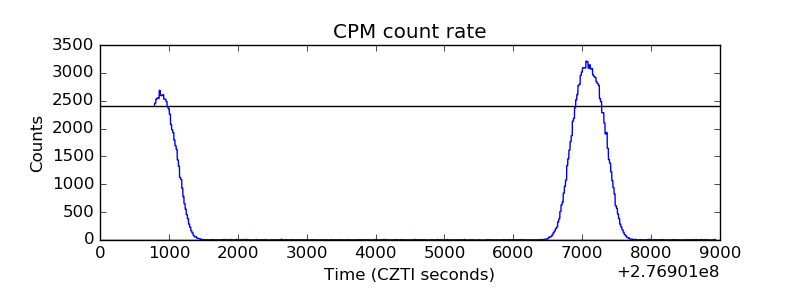 |
| CZT Counter |  |
| +2.5 Volts monitor |  |
| +5 Volts monitor |  |
| _ROLL_ROT | 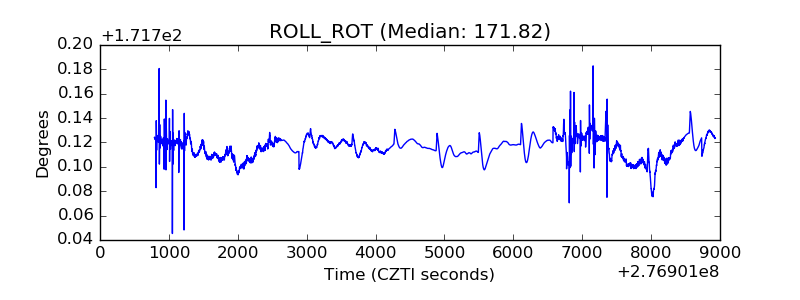 |
| _Roll_DEC | 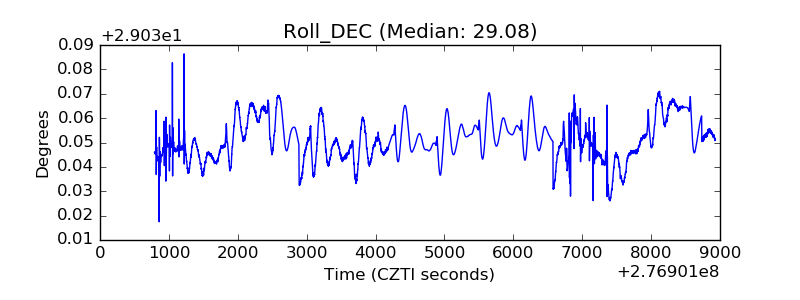 |
| _Roll_RA |  |
| Veto Counter | 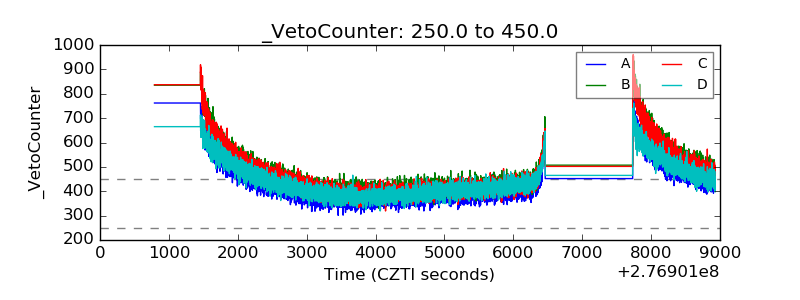 |