| Param | Original file | Final file |
|---|---|---|
| Filename | modeM0/AS1A05_069T01_9000002424_16413cztM0_level2.evt | modeM0/AS1A05_069T01_9000002424_16413cztM0_level2_quad_clean.evt |
| Size (bytes) | 460,857,600 | 83,980,800 |
| Size | 439.5 MB | 80.1 MB |
| Events in quadrant A | 3,146,275 | 540,469 |
| Events in quadrant B | 3,634,991 | 558,893 |
| Events in quadrant C | 3,296,281 | 520,004 |
| Events in quadrant D | 3,460,976 | 493,445 |
| Mode M0 | |||
|---|---|---|---|
| Quadrant | BADHDUFLAG | Total packets | Discarded packets |
| A | 0 | 13144 | 3 |
| B | 0 | 14639 | 2 |
| C | 0 | 13448 | 2 |
| D | 0 | 14436 | 2 |
| Mode M9 | |||
|---|---|---|---|
| Quadrant | BADHDUFLAG | Total packets | Discarded packets |
| A | 0 | 21 | 0 |
| B | 0 | 21 | 0 |
| C | 0 | 21 | 0 |
| D | 0 | 22 | 0 |
| Mode SS | |||
|---|---|---|---|
| Quadrant | BADHDUFLAG | Total packets | Discarded packets |
| A | 0 | 126 | 0 |
| B | 0 | 126 | 0 |
| C | 0 | 126 | 0 |
| D | 0 | 126 | 0 |
| Quadrant | Total seconds | Saturated seconds | Saturation percentage |
|---|---|---|---|
| A | 6162 | 28 | 0.454398% |
| B | 6162 | 71 | 1.152223% |
| C | 6162 | 79 | 1.282051% |
| D | 6162 | 137 | 2.223304% |
Noise dominated data is calculated using 1-second bins in cleaned event files. If a bin has >2000 counts, and if more than 50% of those come from <1% of pixels, then it is considered to be noise-dominated and hence unusable.
| Quadrant | # 1 sec bins | Bins with >0 counts | Bins with >2000 counts | High rate bins dominated by noise | Noise dominated (total time) | Noise dominated (detector-on time) | Marked lightcurve |
|---|---|---|---|---|---|---|---|
| A | 7483 | 6164 | 2 | 2 | 0.03% | 0.03% | 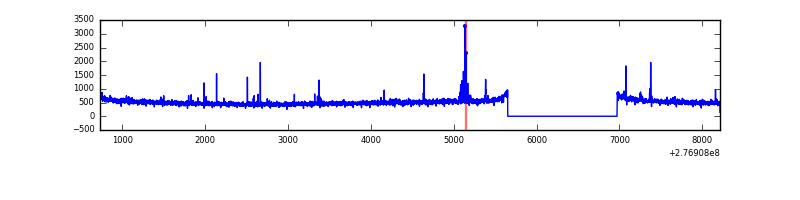 |
| B | 7483 | 6164 | 27 | 27 | 0.36% | 0.44% | 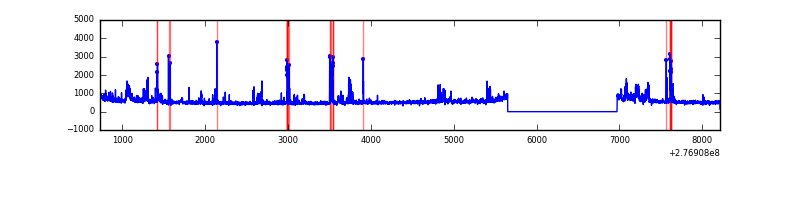 |
| C | 7483 | 6164 | 0 | 0 | 0.00% | 0.00% | 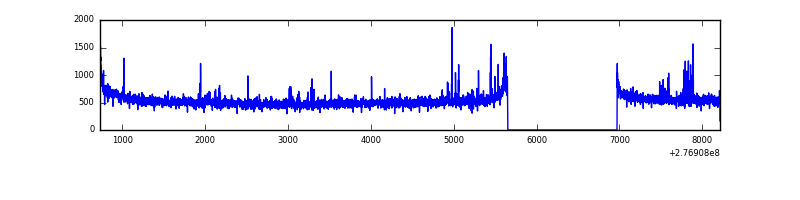 |
| D | 7483 | 6164 | 107 | 107 | 1.43% | 1.74% | 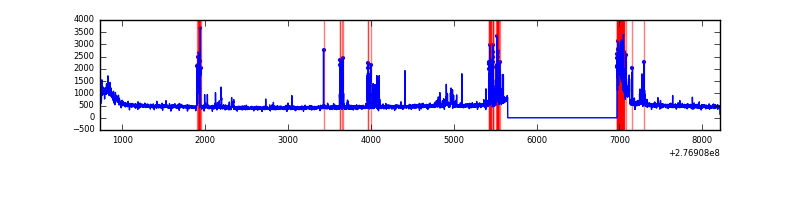 |
Top three noisy pixels from each quadrant. If the there are fewer than three noisy pixels in the level2.evt file, extra rows are filled as -1
| Pixel properties | Quadrant properties | ||||||
|---|---|---|---|---|---|---|---|
| Quadrant | DetID | PixID | Counts | Sigma | Mean | Median | Sigma |
| A | 9 | 143 | 60543 | 378.86 | 787 | 773 | 157.8 |
| A | 15 | 223 | 35686 | 221.3 | 787 | 773 | 157.8 |
| A | 15 | 174 | 18334 | 111.31 | 787 | 773 | 157.8 |
| B | 15 | 35 | 158388 | 1055.85 | 798 | 780 | 149.3 |
| B | 10 | 16 | 129399 | 861.64 | 798 | 780 | 149.3 |
| B | 0 | 198 | 61403 | 406.12 | 798 | 780 | 149.3 |
| C | 3 | 233 | 191161 | 1087.49 | 757 | 765 | 175.1 |
| C | 14 | 238 | 118545 | 672.73 | 757 | 765 | 175.1 |
| C | 7 | 247 | 19648 | 107.85 | 757 | 765 | 175.1 |
| D | 10 | 70 | 202215 | 1099.34 | 751 | 729 | 183.3 |
| D | 12 | 218 | 182502 | 991.78 | 751 | 729 | 183.3 |
| D | 1 | 20 | 67018 | 361.68 | 751 | 729 | 183.3 |
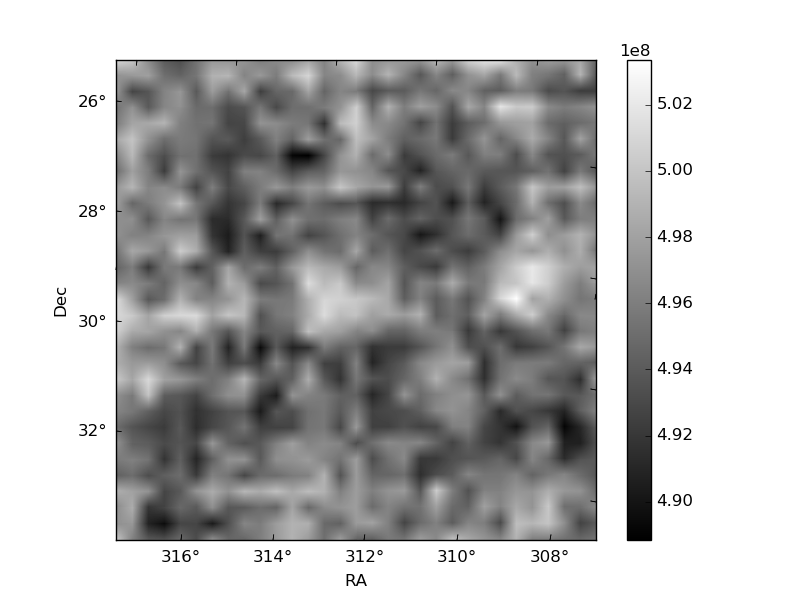
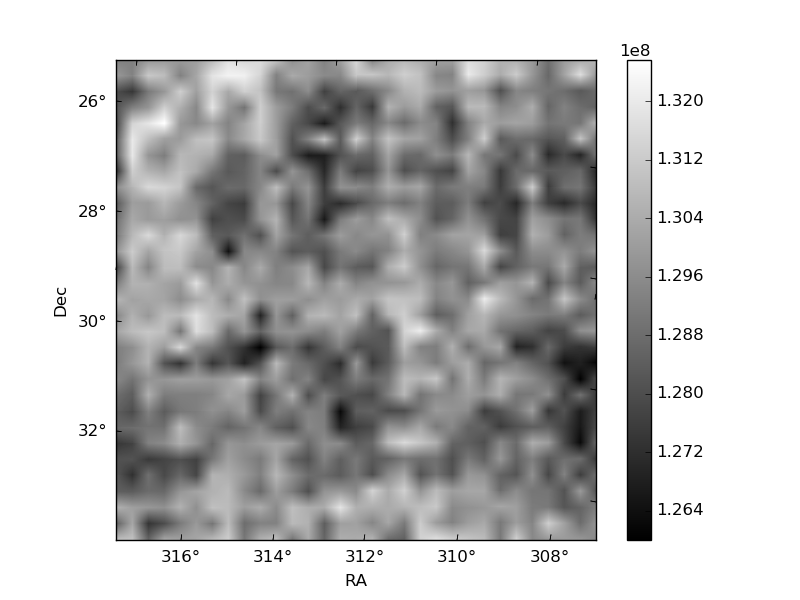
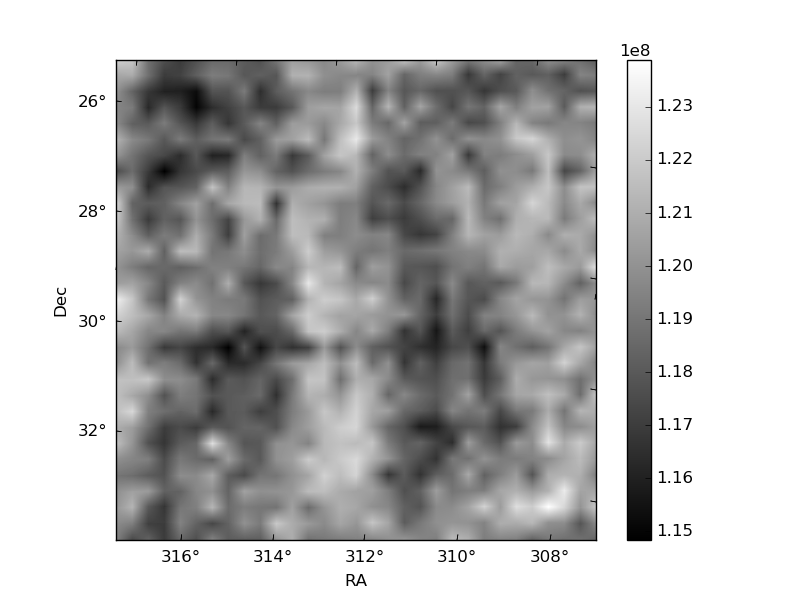
Histogram calculated using DETX and DETY for each event in the final _common_clean file
| Quadrant A | 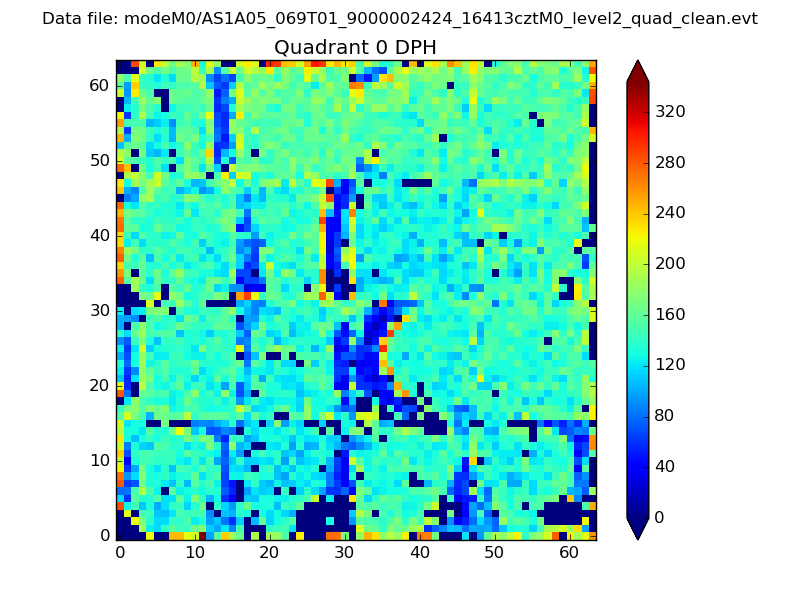 |
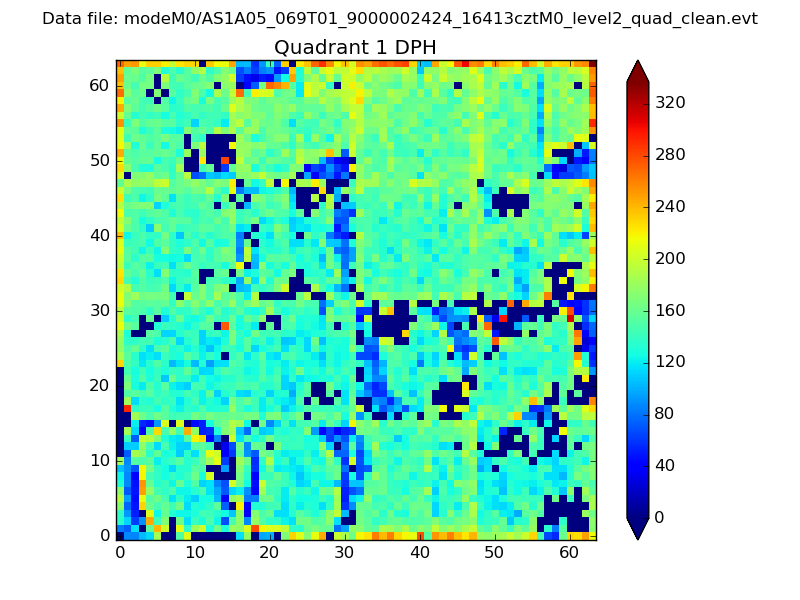 |
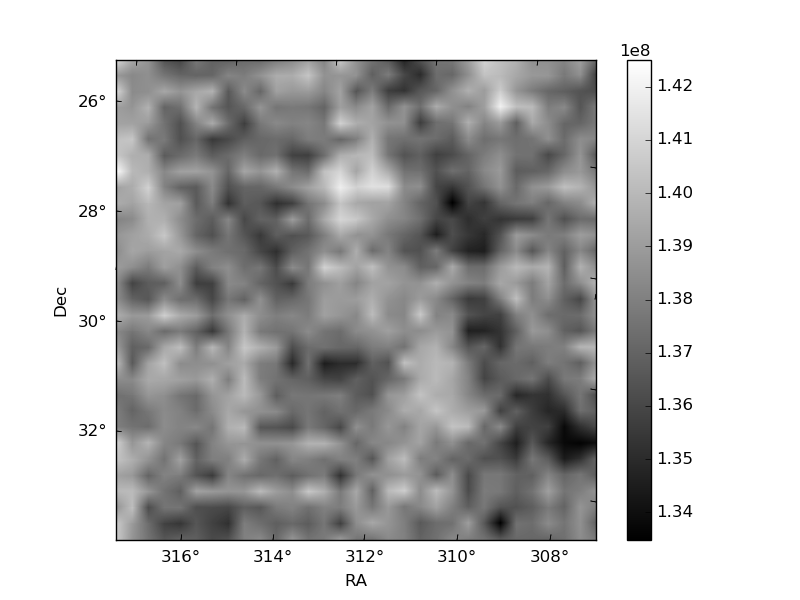
Quadrant B |
|---|---|---|---|
| Quadrant D | 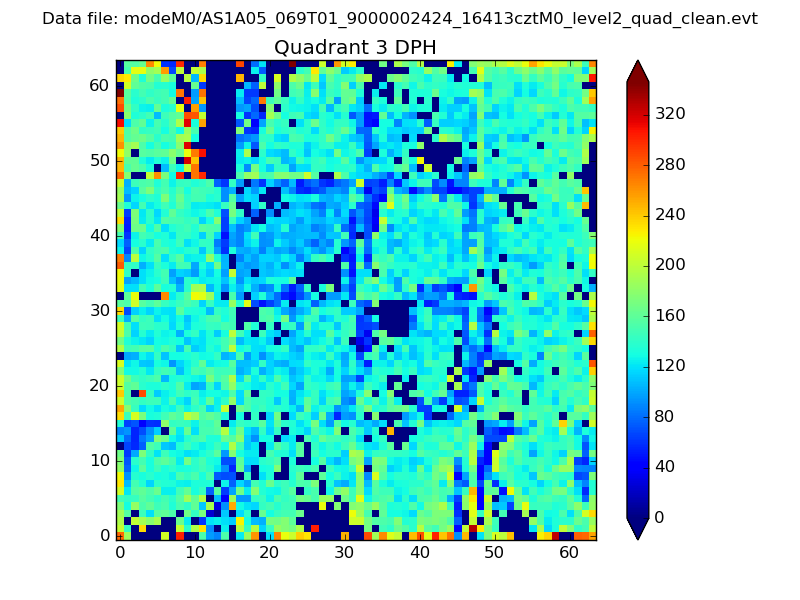 |
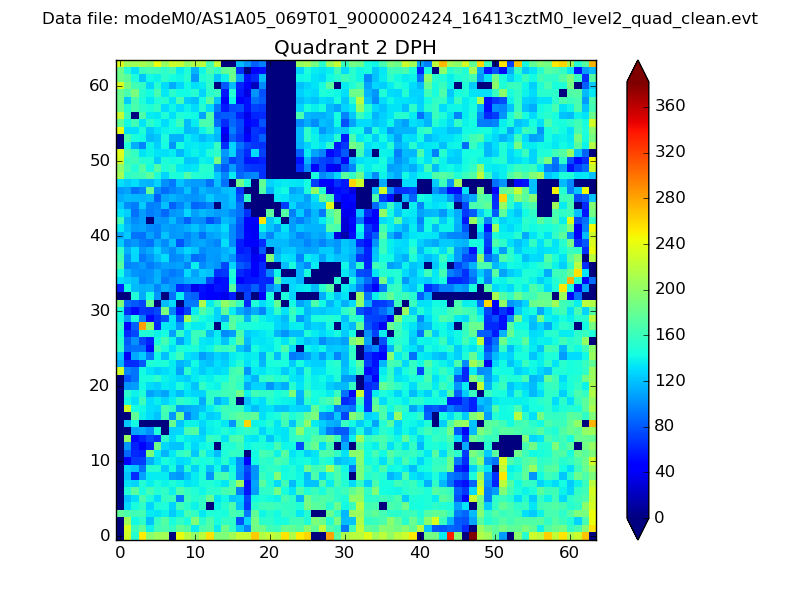 |
Quadrant C |
| Plot type | Count rate plots | Images |
|---|---|---|
| Comparison with Poisson distribution Blue bars denote a histogram of data divided into 1 sec bins. Red curve is a Poisson curve with rate = median count rate of data. |
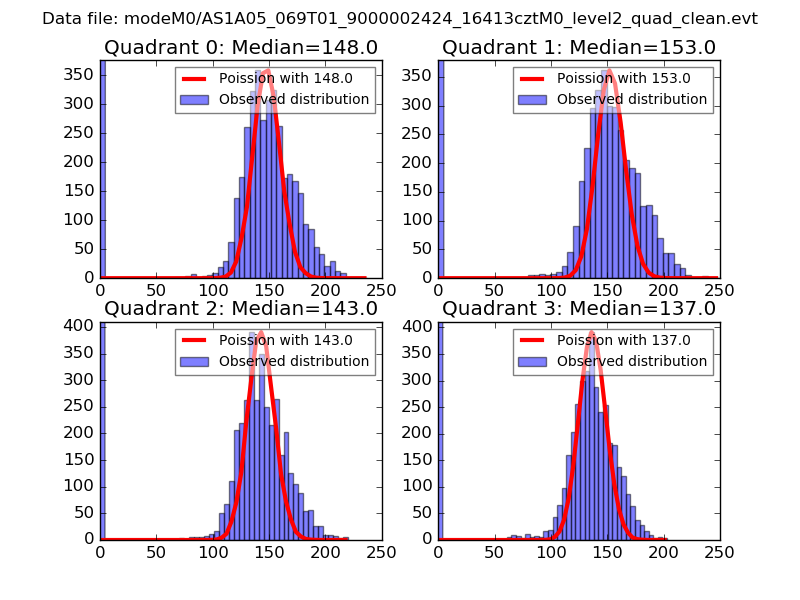 |
 |
| Quadrant-wise count rates Data is divided into 100 sec bins |
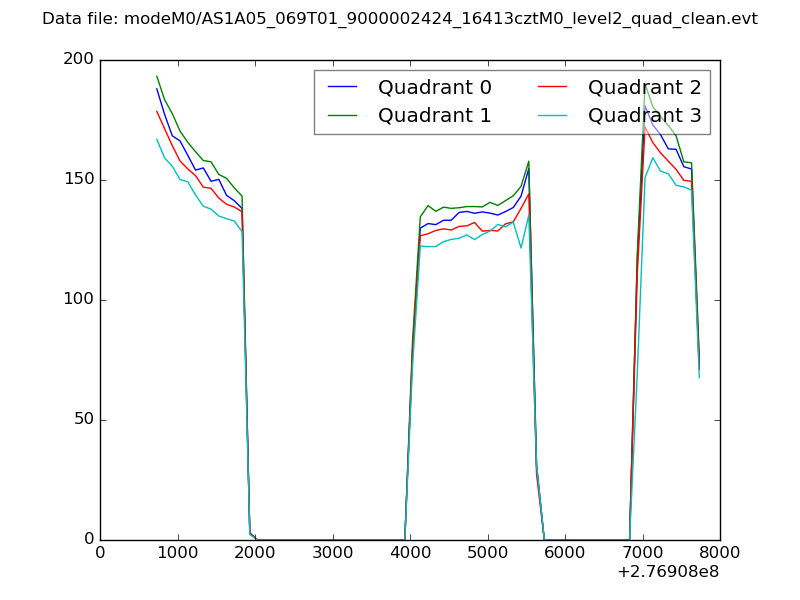 |
|
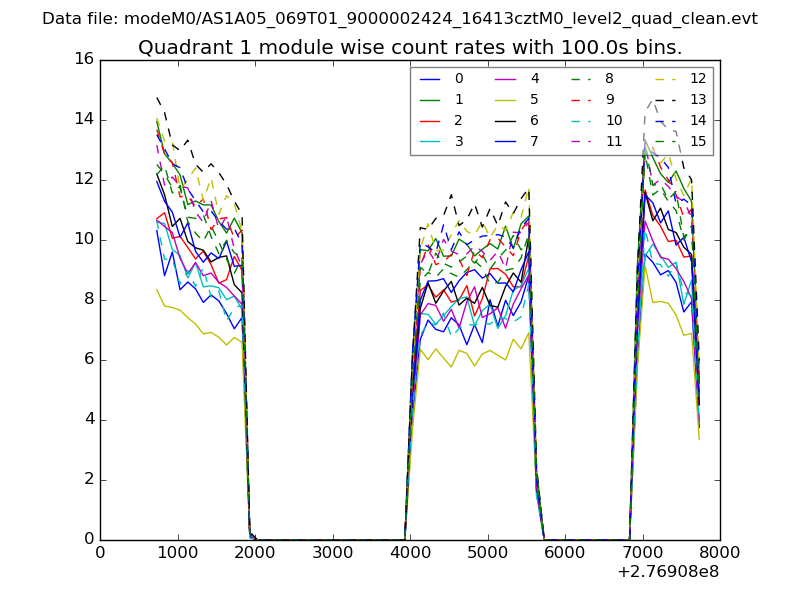
| Module-wise count rates for Quadrant A Data is divided into 100 sec bins |
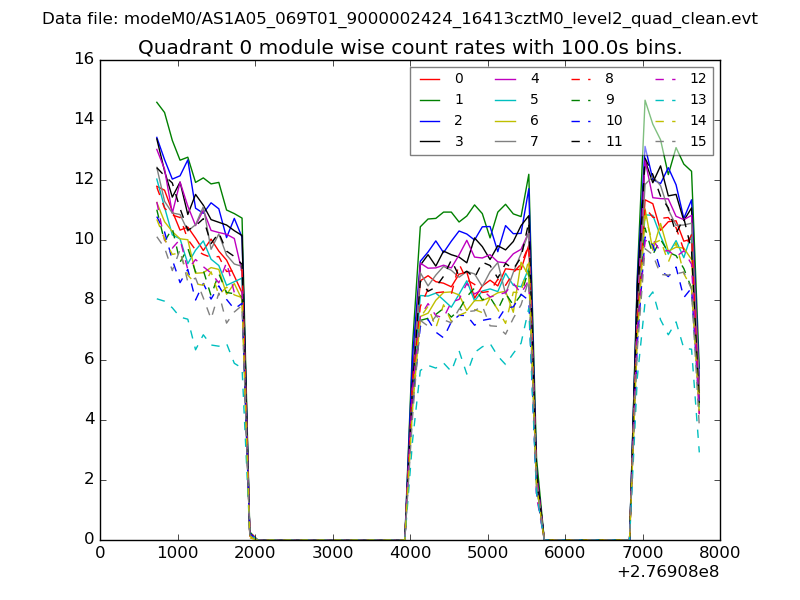 |
 |
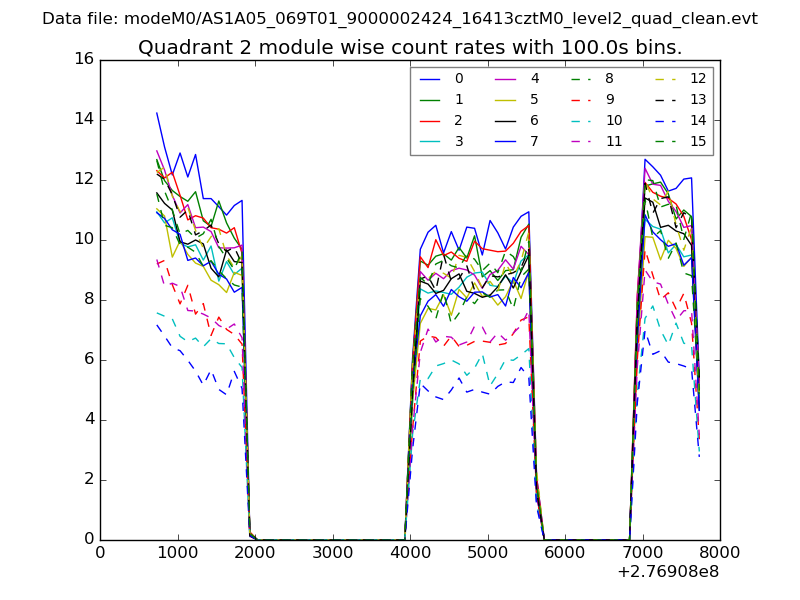
| Module-wise count rates for Quadrant B Data is divided into 100 sec bins |
 |
 |
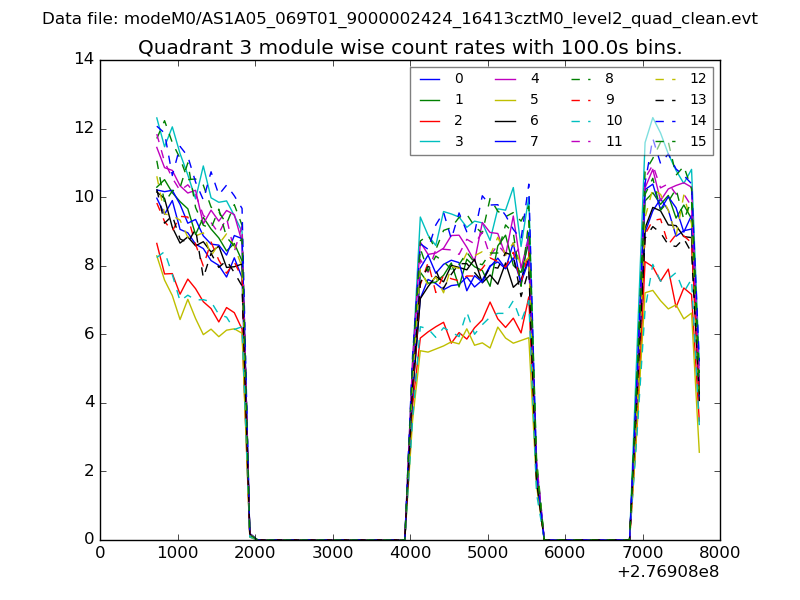
| Module-wise count rates for Quadrant C Data is divided into 100 sec bins |
 |
 |
| Module-wise count rates for Quadrant D Data is divided into 100 sec bins |
 |
 |
| Parameter | Plot |
|---|---|
| CZT HV Monitor | 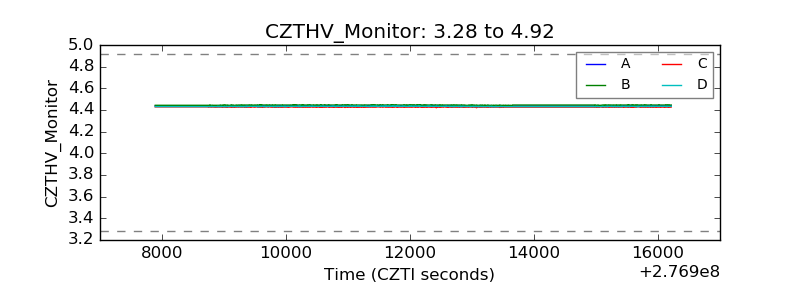 |
| D_VDD | 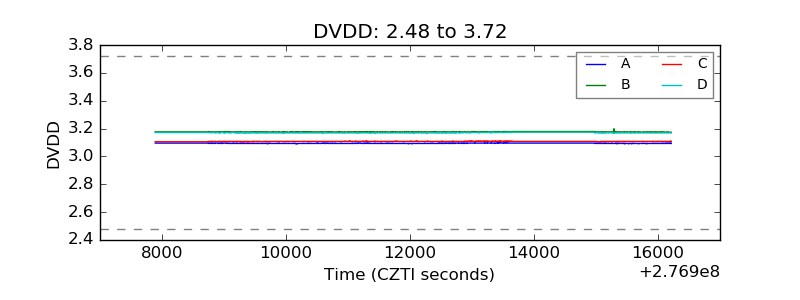 |
| Temperature 1 | 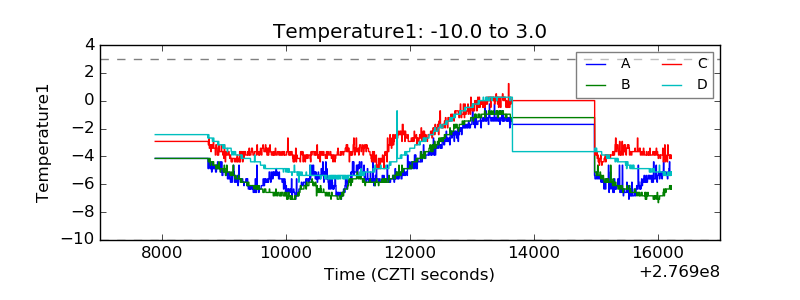 |
| Veto HV Monitor | 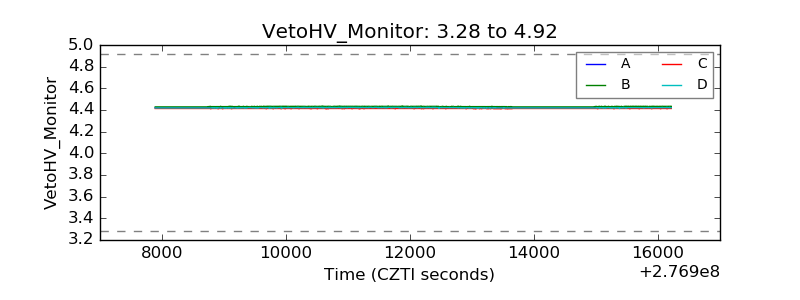 |
| Veto LLD | 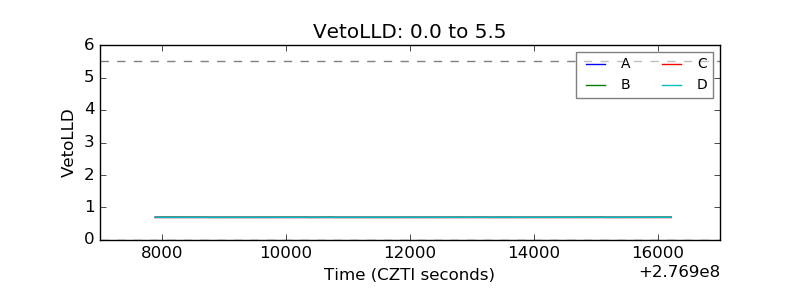 |
| Alpha Counter | 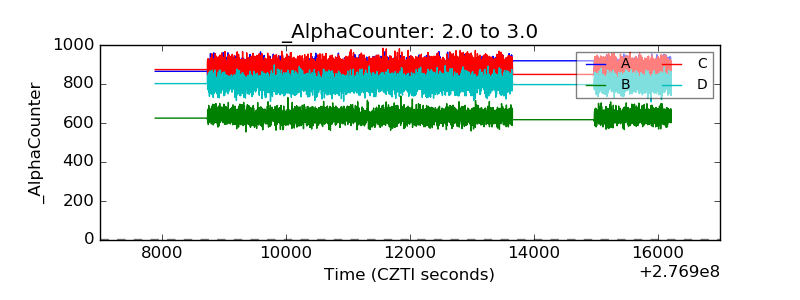 |
| _CPM_Rate | 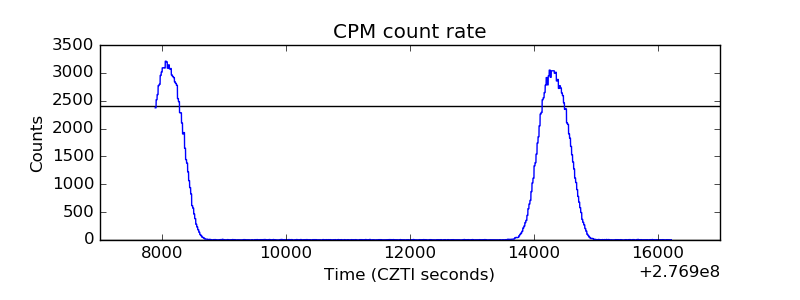 |
| CZT Counter | 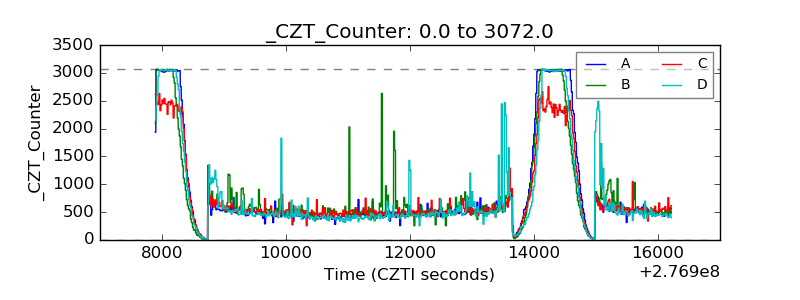 |
| +2.5 Volts monitor |  |
| +5 Volts monitor |  |
| _ROLL_ROT | 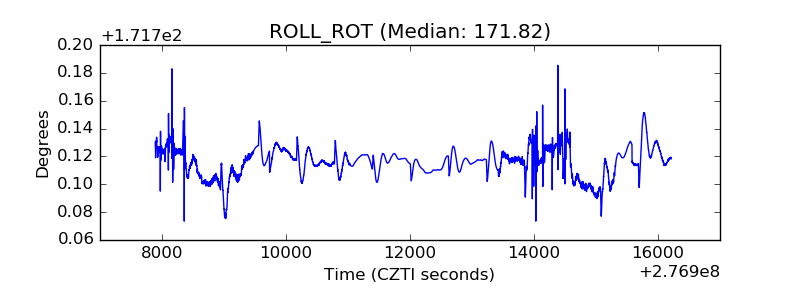 |
| _Roll_DEC | 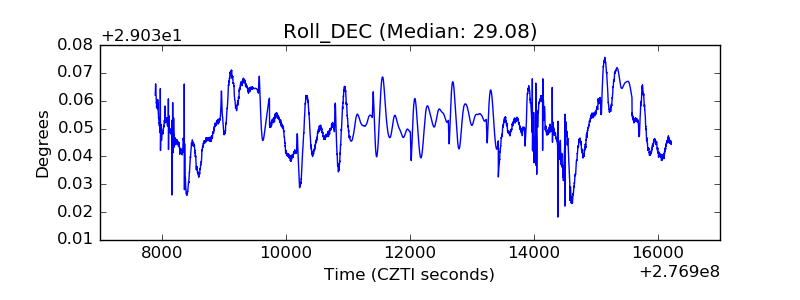 |
| _Roll_RA | 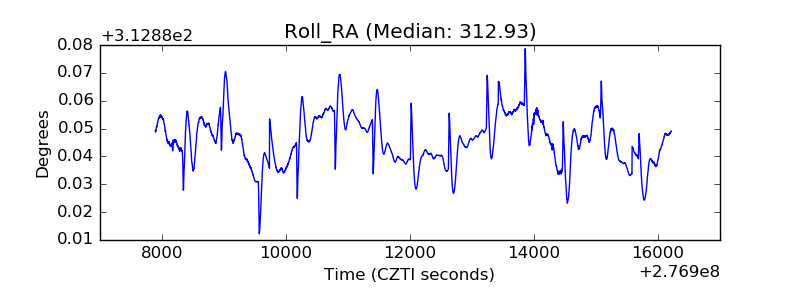 |
| Veto Counter | 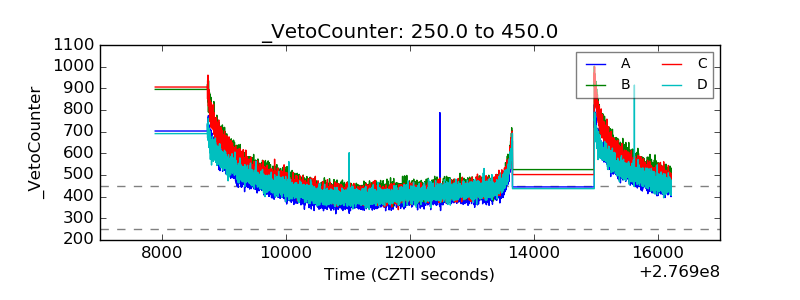 |