| Param | Original file | Final file |
|---|---|---|
| Filename | modeM0/AS1A05_069T01_9000002424_16414cztM0_level2.evt | modeM0/AS1A05_069T01_9000002424_16414cztM0_level2_quad_clean.evt |
| Size (bytes) | 516,430,080 | 76,599,360 |
| Size | 492.5 MB | 73.1 MB |
| Events in quadrant A | 3,541,247 | 471,591 |
| Events in quadrant B | 4,160,978 | 494,161 |
| Events in quadrant C | 3,581,942 | 458,078 |
| Events in quadrant D | 3,912,153 | 439,226 |
| Mode M0 | |||
|---|---|---|---|
| Quadrant | BADHDUFLAG | Total packets | Discarded packets |
| A | 0 | 14516 | 3 |
| B | 0 | 16456 | 2 |
| C | 0 | 14519 | 2 |
| D | 0 | 15919 | 2 |
| Mode M9 | |||
|---|---|---|---|
| Quadrant | BADHDUFLAG | Total packets | Discarded packets |
| A | 0 | 21 | 0 |
| B | 0 | 21 | 0 |
| C | 0 | 21 | 0 |
| D | 0 | 22 | 0 |
| Mode SS | |||
|---|---|---|---|
| Quadrant | BADHDUFLAG | Total packets | Discarded packets |
| A | 0 | 132 | 0 |
| B | 0 | 132 | 0 |
| C | 0 | 132 | 0 |
| D | 0 | 132 | 0 |
| Quadrant | Total seconds | Saturated seconds | Saturation percentage |
|---|---|---|---|
| A | 6544 | 165 | 2.521394% |
| B | 6544 | 236 | 3.606357% |
| C | 6544 | 94 | 1.436430% |
| D | 6544 | 283 | 4.324572% |
Noise dominated data is calculated using 1-second bins in cleaned event files. If a bin has >2000 counts, and if more than 50% of those come from <1% of pixels, then it is considered to be noise-dominated and hence unusable.
| Quadrant | # 1 sec bins | Bins with >0 counts | Bins with >2000 counts | High rate bins dominated by noise | Noise dominated (total time) | Noise dominated (detector-on time) | Marked lightcurve |
|---|---|---|---|---|---|---|---|
| A | 7860 | 6546 | 61 | 61 | 0.78% | 0.93% | 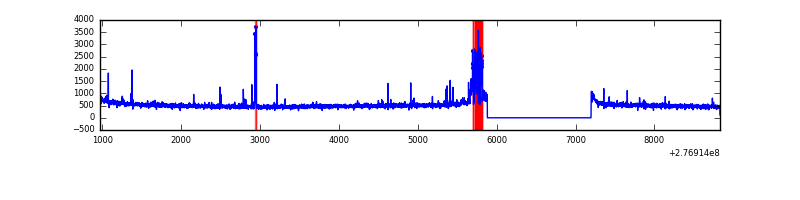 |
| B | 7860 | 6545 | 117 | 117 | 1.49% | 1.79% |  |
| C | 7860 | 6545 | 3 | 3 | 0.04% | 0.05% | 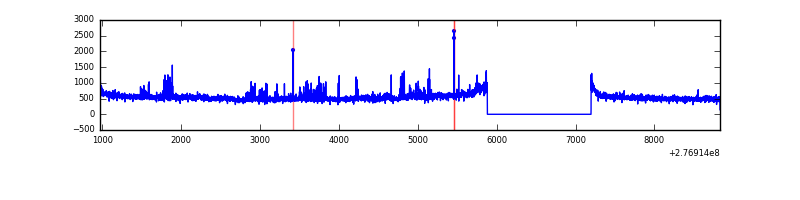 |
| D | 7860 | 6546 | 217 | 217 | 2.76% | 3.32% | 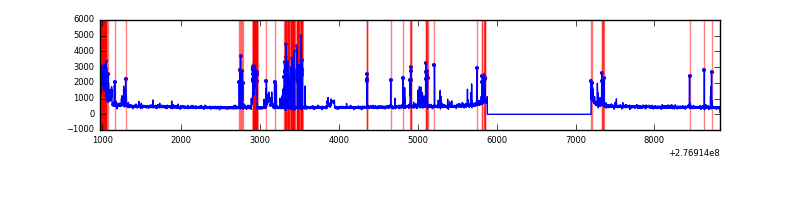 |
Top three noisy pixels from each quadrant. If the there are fewer than three noisy pixels in the level2.evt file, extra rows are filled as -1
| Pixel properties | Quadrant properties | ||||||
|---|---|---|---|---|---|---|---|
| Quadrant | DetID | PixID | Counts | Sigma | Mean | Median | Sigma |
| A | 15 | 174 | 223026 | 1331.0 | 843 | 828 | 166.9 |
| A | 9 | 143 | 63032 | 372.61 | 843 | 828 | 166.9 |
| A | 15 | 223 | 15299 | 86.68 | 843 | 828 | 166.9 |
| B | 0 | 229 | 412322 | 2585.89 | 854 | 836 | 159.1 |
| B | 10 | 16 | 135814 | 848.24 | 854 | 836 | 159.1 |
| B | 15 | 35 | 104389 | 650.75 | 854 | 836 | 159.1 |
| C | 3 | 233 | 265910 | 1419.69 | 811 | 817 | 186.7 |
| C | 14 | 238 | 126114 | 671.02 | 811 | 817 | 186.7 |
| C | 0 | 207 | 17229 | 87.89 | 811 | 817 | 186.7 |
| D | 12 | 218 | 580725 | 2988.48 | 797 | 776 | 194.1 |
| D | 10 | 70 | 198639 | 1019.59 | 797 | 776 | 194.1 |
| D | 15 | 0 | 33131 | 166.73 | 797 | 776 | 194.1 |
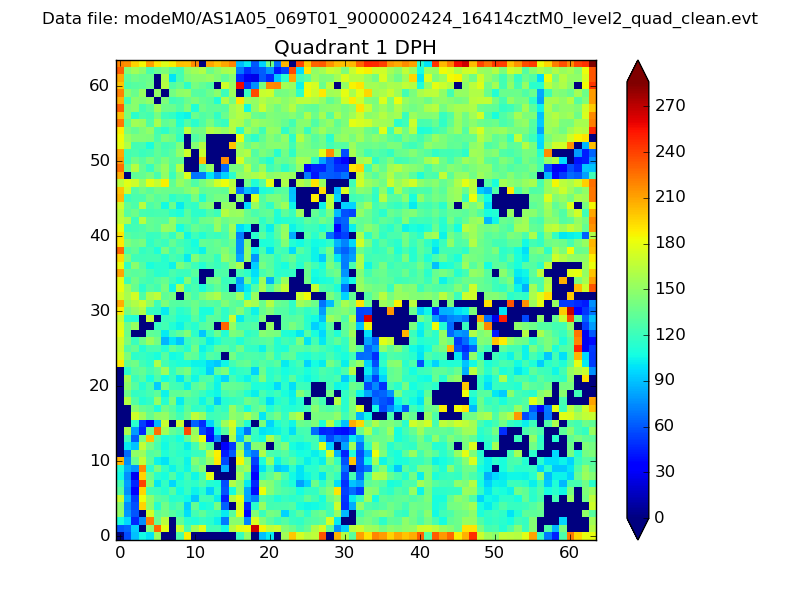
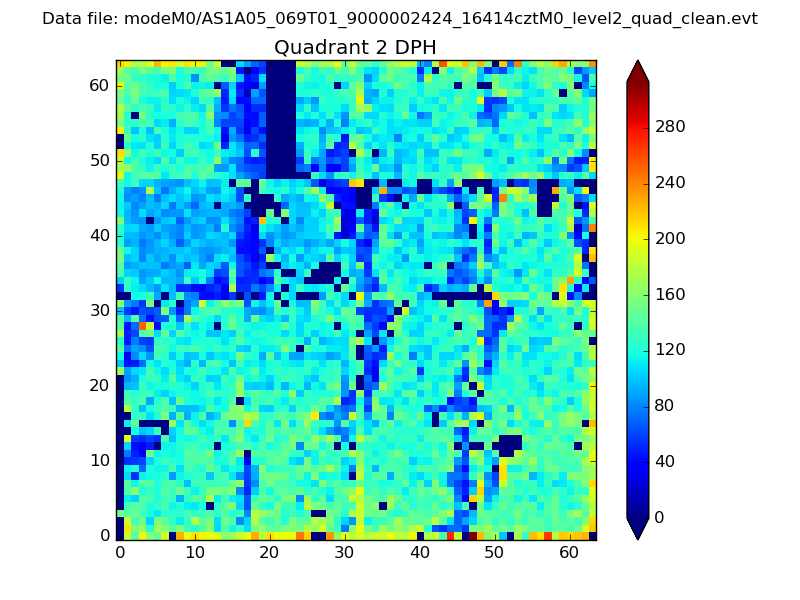
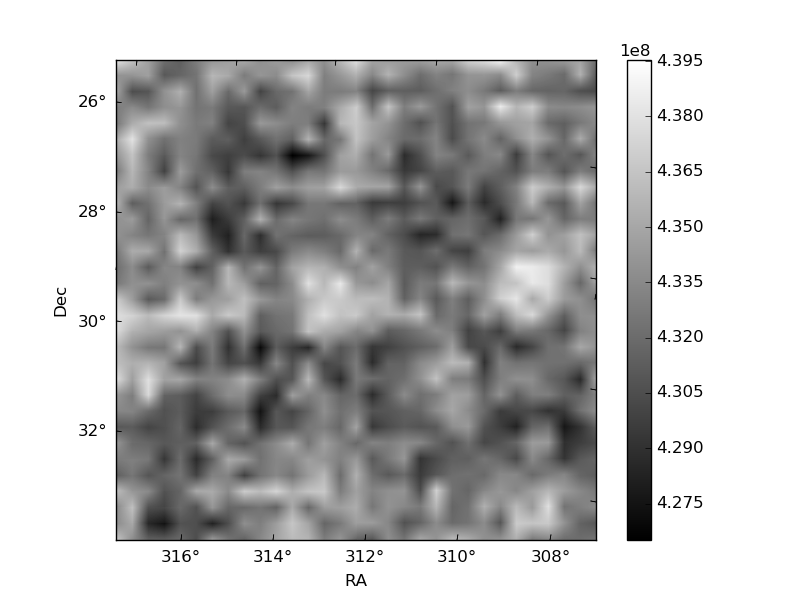
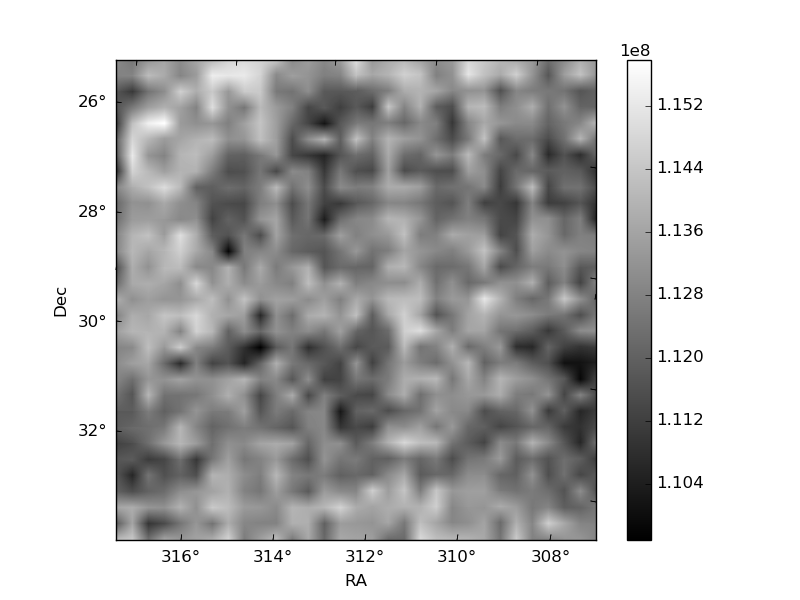
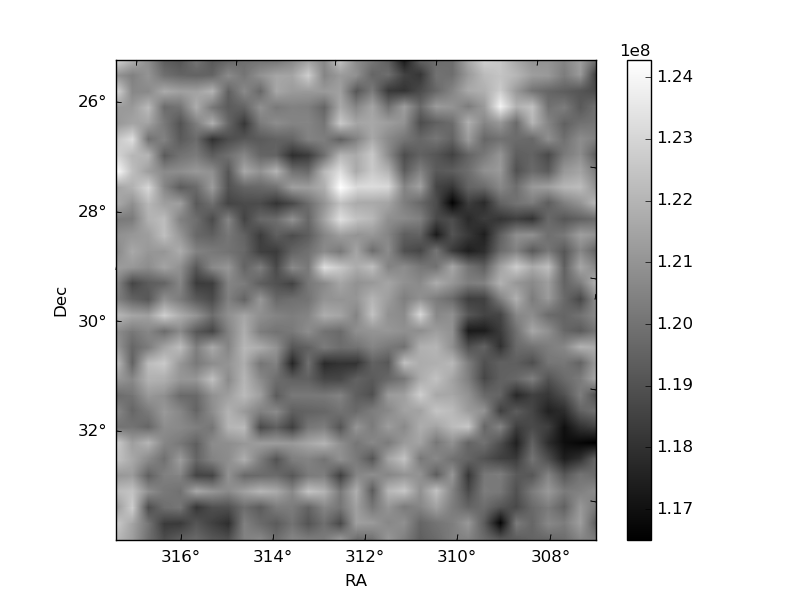
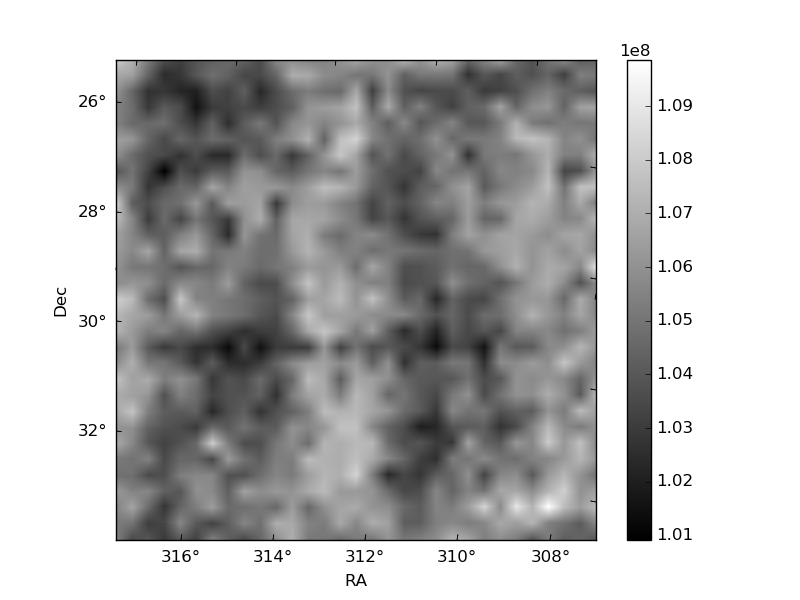
Histogram calculated using DETX and DETY for each event in the final _common_clean file
| Quadrant A | 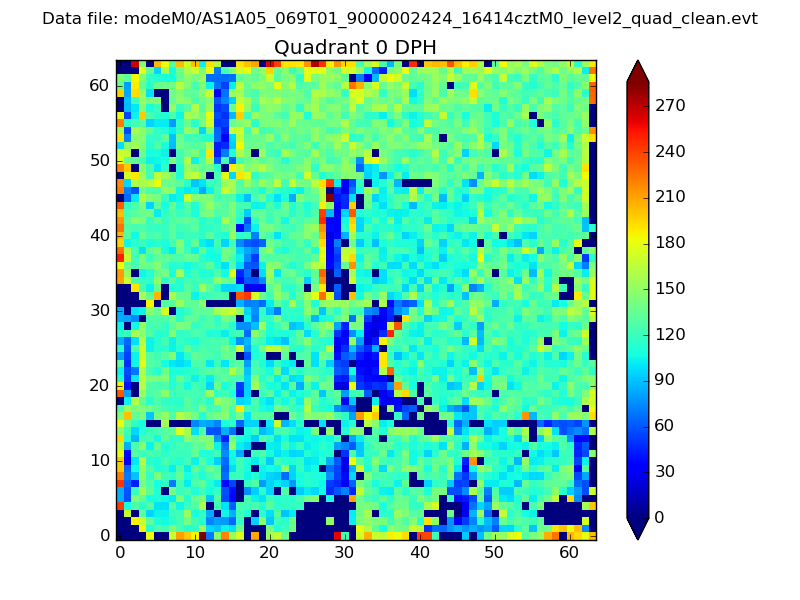 |
 |
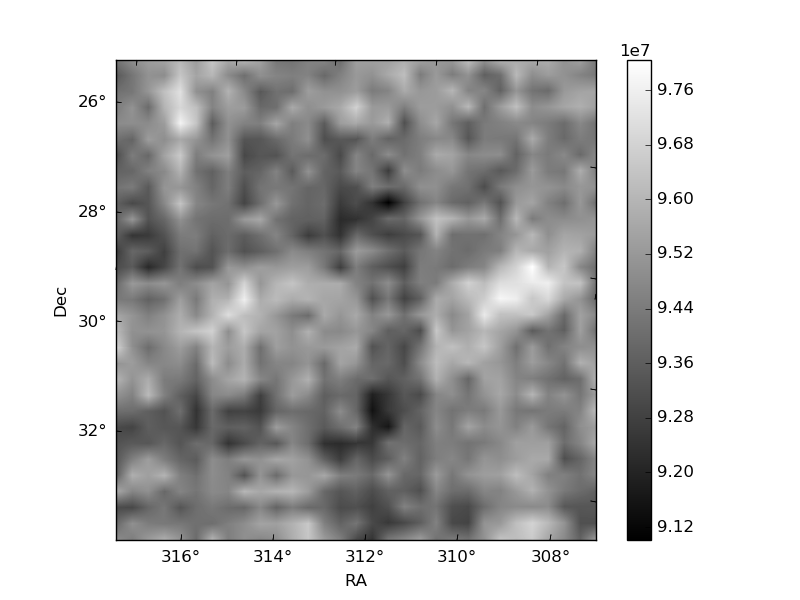
Quadrant B |
|---|---|---|---|
| Quadrant D | 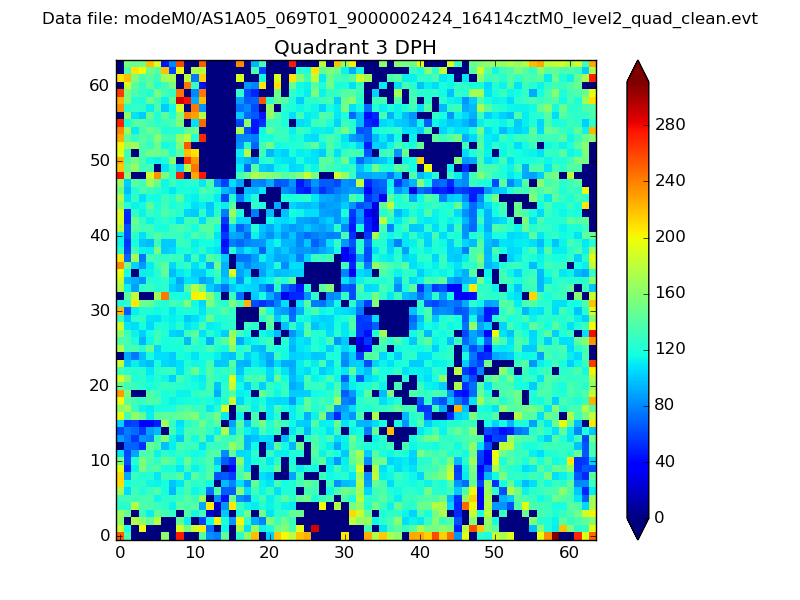 |
 |
Quadrant C |
| Plot type | Count rate plots | Images |
|---|---|---|
| Comparison with Poisson distribution Blue bars denote a histogram of data divided into 1 sec bins. Red curve is a Poisson curve with rate = median count rate of data. |
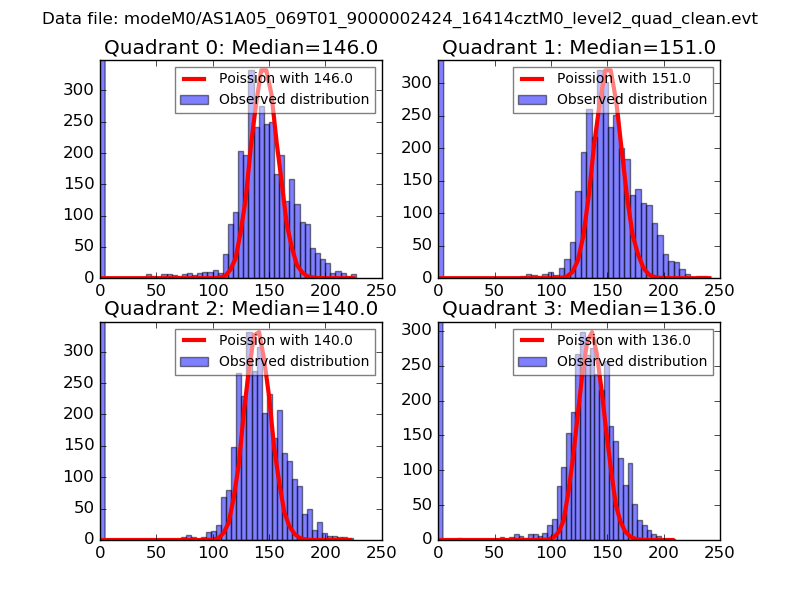 |
 |
| Quadrant-wise count rates Data is divided into 100 sec bins |
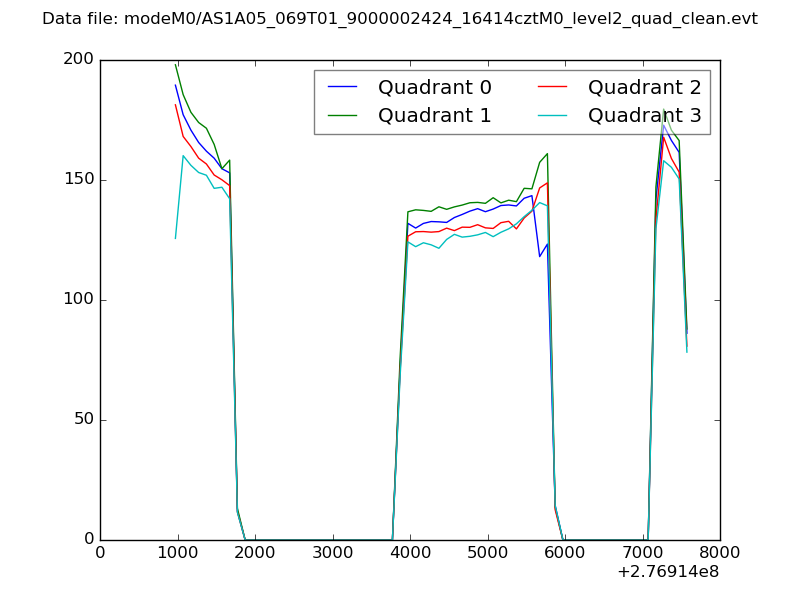 |
|
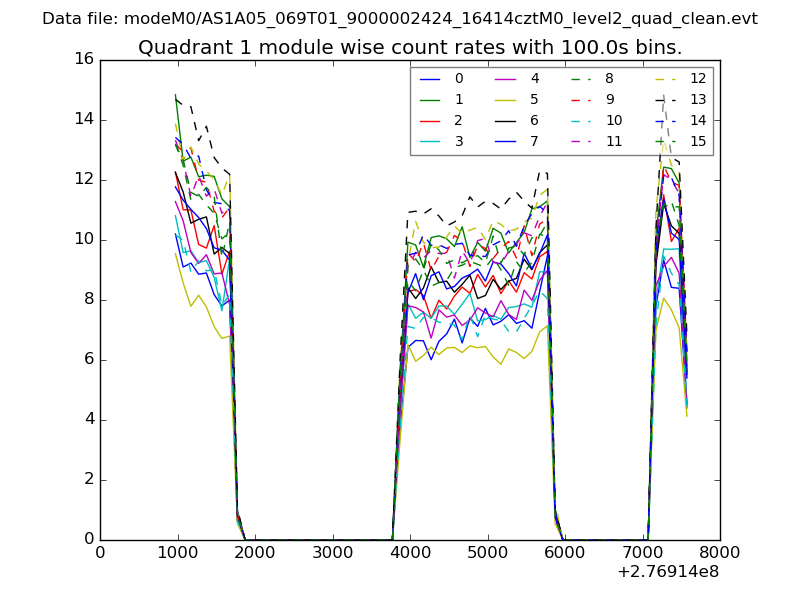
| Module-wise count rates for Quadrant A Data is divided into 100 sec bins |
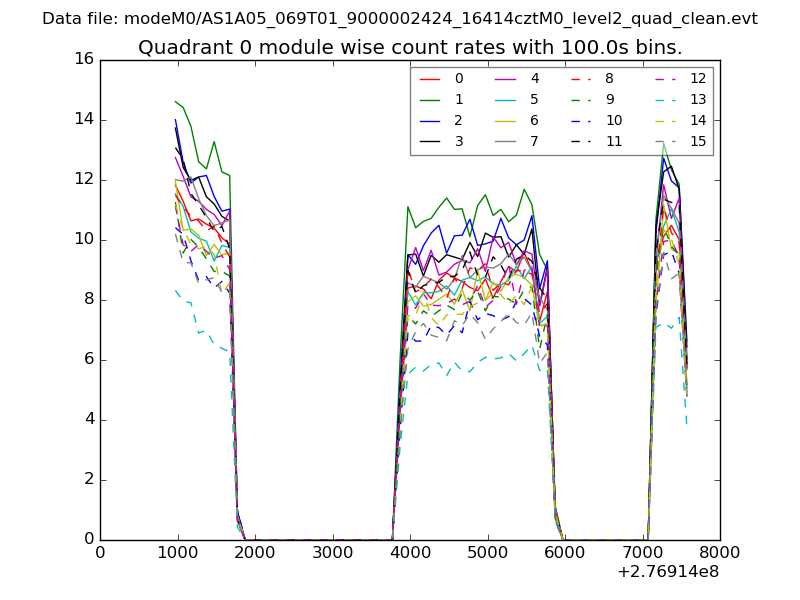 |
 |
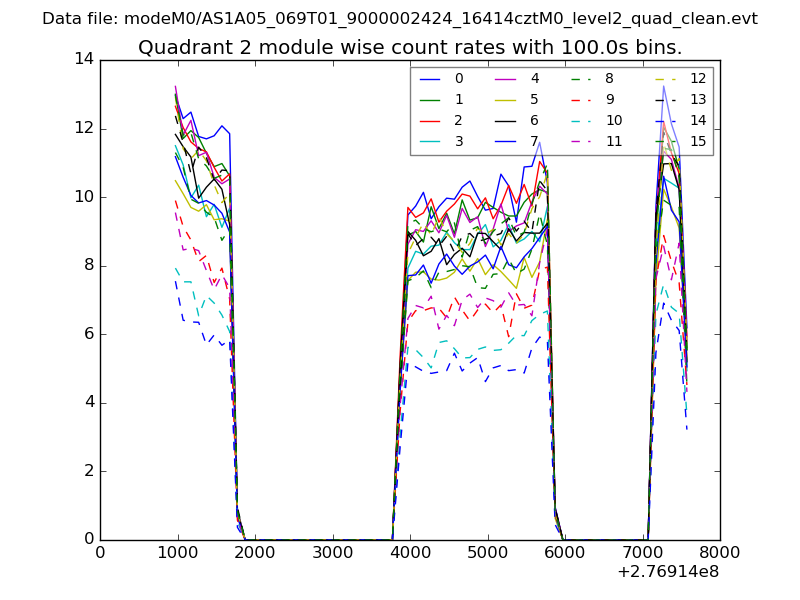
| Module-wise count rates for Quadrant B Data is divided into 100 sec bins |
 |
 |
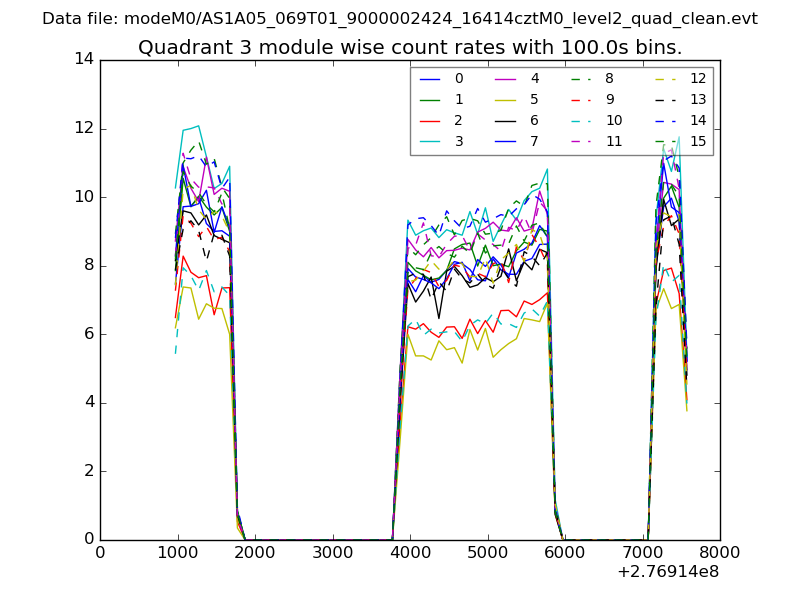
| Module-wise count rates for Quadrant C Data is divided into 100 sec bins |
 |
 |
| Module-wise count rates for Quadrant D Data is divided into 100 sec bins |
 |
 |
| Parameter | Plot |
|---|---|
| CZT HV Monitor | 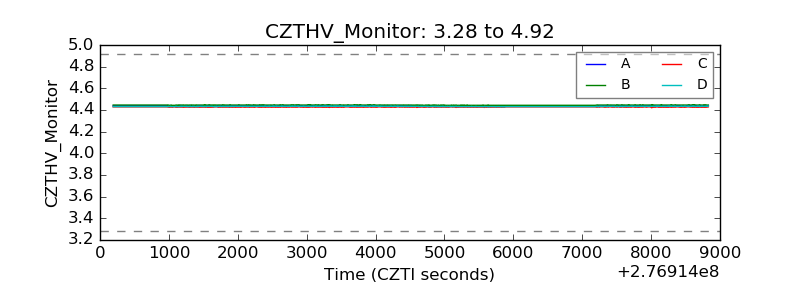 |
| D_VDD | 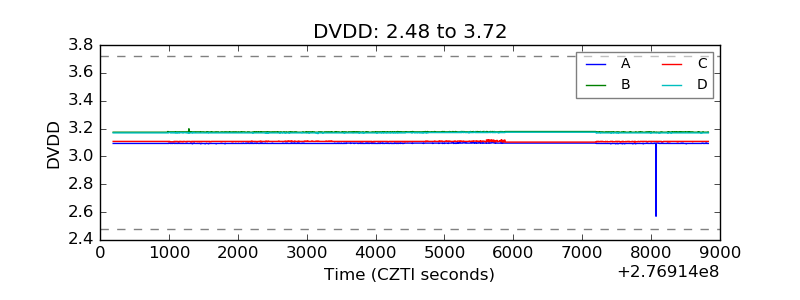 |
| Temperature 1 | 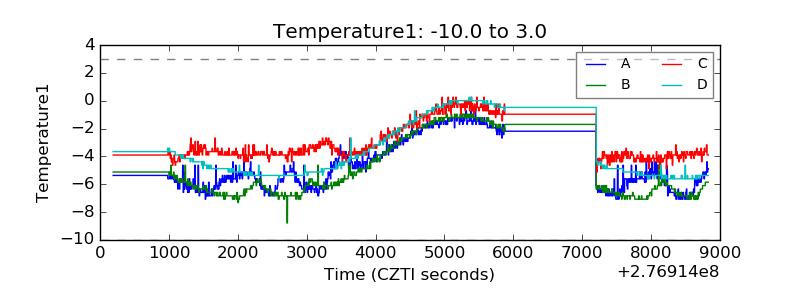 |
| Veto HV Monitor | 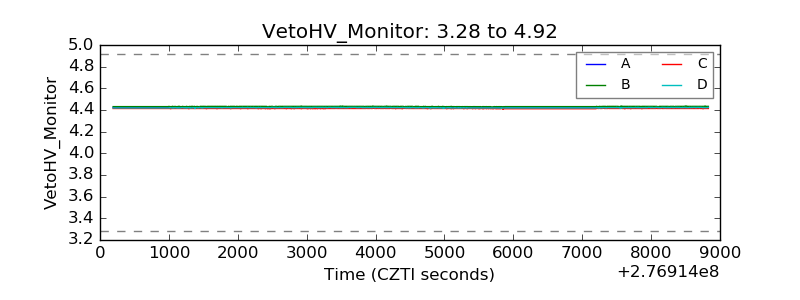 |
| Veto LLD | 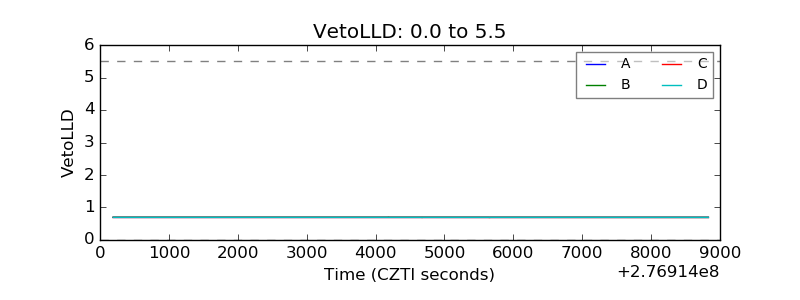 |
| Alpha Counter | 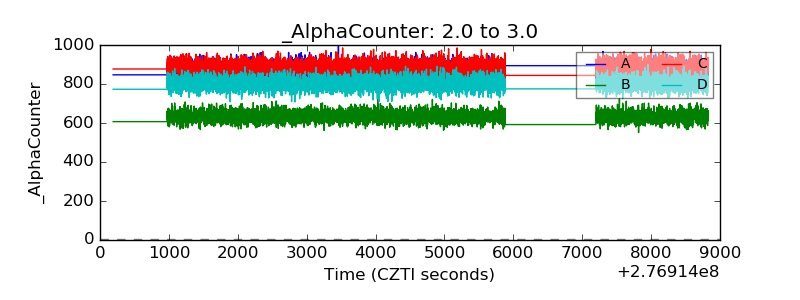 |
| _CPM_Rate | 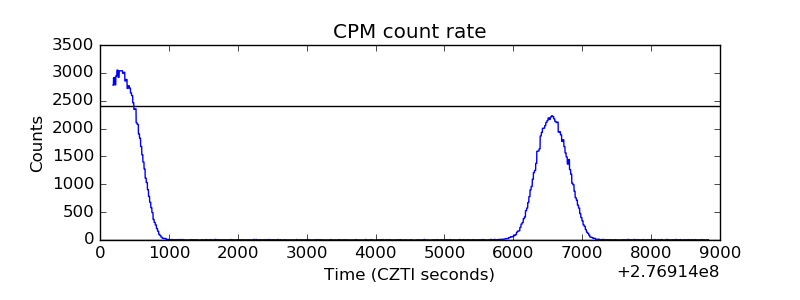 |
| CZT Counter | 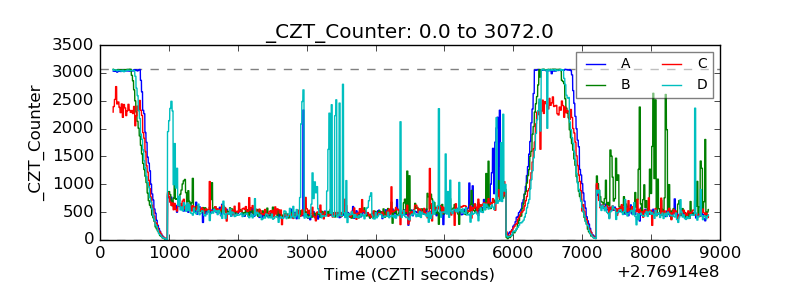 |
| +2.5 Volts monitor |  |
| +5 Volts monitor |  |
| _ROLL_ROT | 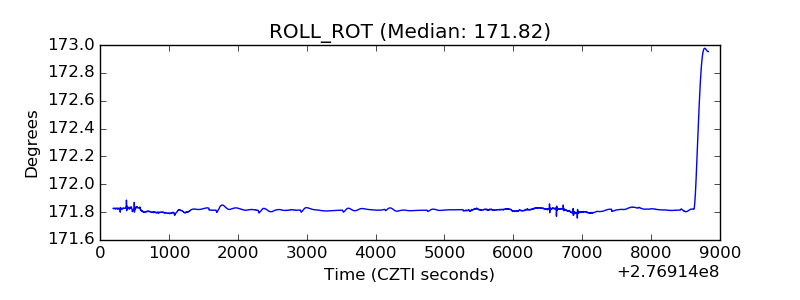 |
| _Roll_DEC | 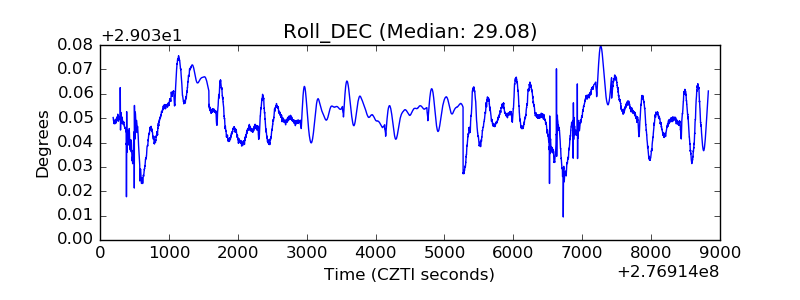 |
| _Roll_RA | 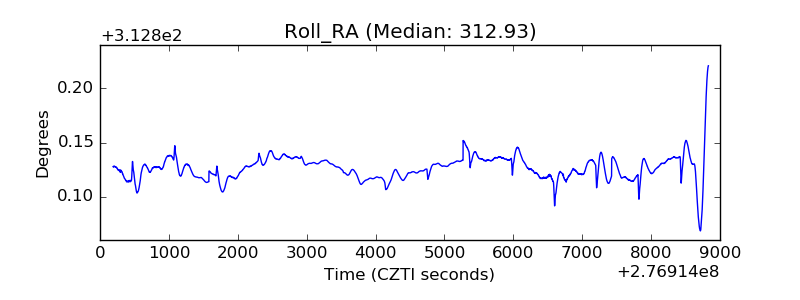 |
| Veto Counter | 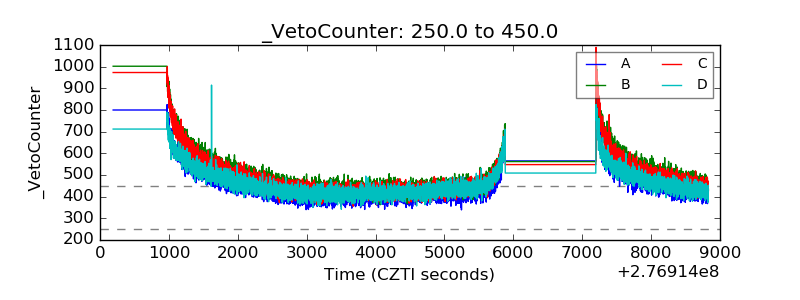 |