| Param | Original file | Final file |
|---|---|---|
| Filename | modeM0/AS1A05_069T01_9000002424_16415cztM0_level2.evt | modeM0/AS1A05_069T01_9000002424_16415cztM0_level2_quad_clean.evt |
| Size (bytes) | 484,925,760 | 67,855,680 |
| Size | 462.5 MB | 64.7 MB |
| Events in quadrant A | 3,235,703 | 410,360 |
| Events in quadrant B | 4,085,567 | 418,231 |
| Events in quadrant C | 3,376,195 | 392,612 |
| Events in quadrant D | 3,548,314 | 380,847 |
| Mode M0 | |||
|---|---|---|---|
| Quadrant | BADHDUFLAG | Total packets | Discarded packets |
| A | 0 | 13542 | 3 |
| B | 0 | 16211 | 2 |
| C | 0 | 13776 | 2 |
| D | 0 | 14826 | 2 |
| Mode M9 | |||
|---|---|---|---|
| Quadrant | BADHDUFLAG | Total packets | Discarded packets |
| A | 0 | 20 | 0 |
| B | 0 | 20 | 0 |
| C | 0 | 20 | 0 |
| D | 0 | 21 | 0 |
| Mode SS | |||
|---|---|---|---|
| Quadrant | BADHDUFLAG | Total packets | Discarded packets |
| A | 0 | 130 | 0 |
| B | 0 | 130 | 0 |
| C | 0 | 130 | 0 |
| D | 0 | 130 | 0 |
| Quadrant | Total seconds | Saturated seconds | Saturation percentage |
|---|---|---|---|
| A | 6492 | 68 | 1.047443% |
| B | 6492 | 264 | 4.066543% |
| C | 6492 | 85 | 1.309304% |
| D | 6492 | 112 | 1.725200% |
Noise dominated data is calculated using 1-second bins in cleaned event files. If a bin has >2000 counts, and if more than 50% of those come from <1% of pixels, then it is considered to be noise-dominated and hence unusable.
| Quadrant | # 1 sec bins | Bins with >0 counts | Bins with >2000 counts | High rate bins dominated by noise | Noise dominated (total time) | Noise dominated (detector-on time) | Marked lightcurve |
|---|---|---|---|---|---|---|---|
| A | 7753 | 6494 | 0 | 0 | 0.00% | 0.00% | 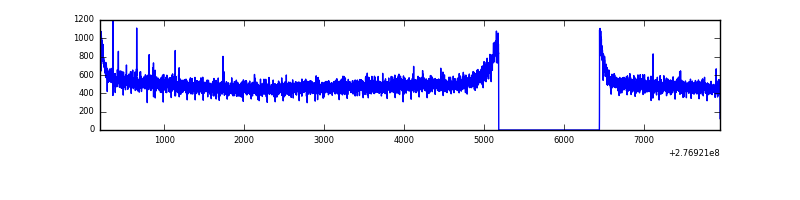 |
| B | 7753 | 6494 | 123 | 123 | 1.59% | 1.89% | 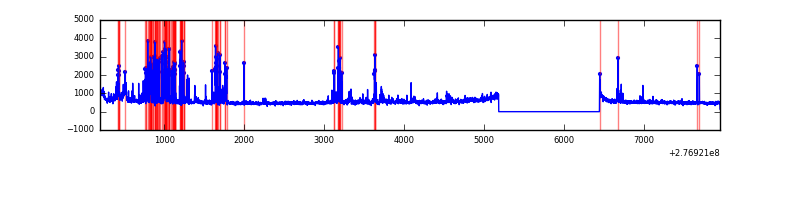 |
| C | 7753 | 6494 | 0 | 0 | 0.00% | 0.00% |  |
| D | 7753 | 6494 | 53 | 53 | 0.68% | 0.82% |  |
Top three noisy pixels from each quadrant. If the there are fewer than three noisy pixels in the level2.evt file, extra rows are filled as -1
| Pixel properties | Quadrant properties | ||||||
|---|---|---|---|---|---|---|---|
| Quadrant | DetID | PixID | Counts | Sigma | Mean | Median | Sigma |
| A | 15 | 223 | 10527 | 58.38 | 838 | 822 | 166.2 |
| A | 0 | 226 | 7396 | 39.54 | 838 | 822 | 166.2 |
| A | 12 | 194 | 6061 | 31.51 | 838 | 822 | 166.2 |
| B | 0 | 229 | 422992 | 2688.24 | 838 | 819 | 157.0 |
| B | 4 | 173 | 111042 | 701.86 | 838 | 819 | 157.0 |
| B | 10 | 16 | 104390 | 659.5 | 838 | 819 | 157.0 |
| C | 14 | 238 | 123542 | 666.55 | 797 | 803 | 184.1 |
| C | 3 | 233 | 119974 | 647.18 | 797 | 803 | 184.1 |
| C | 7 | 247 | 15775 | 81.31 | 797 | 803 | 184.1 |
| D | 12 | 218 | 347316 | 1795.83 | 797 | 773 | 193.0 |
| D | 15 | 0 | 75780 | 388.7 | 797 | 773 | 193.0 |
| D | 1 | 20 | 34496 | 174.76 | 797 | 773 | 193.0 |
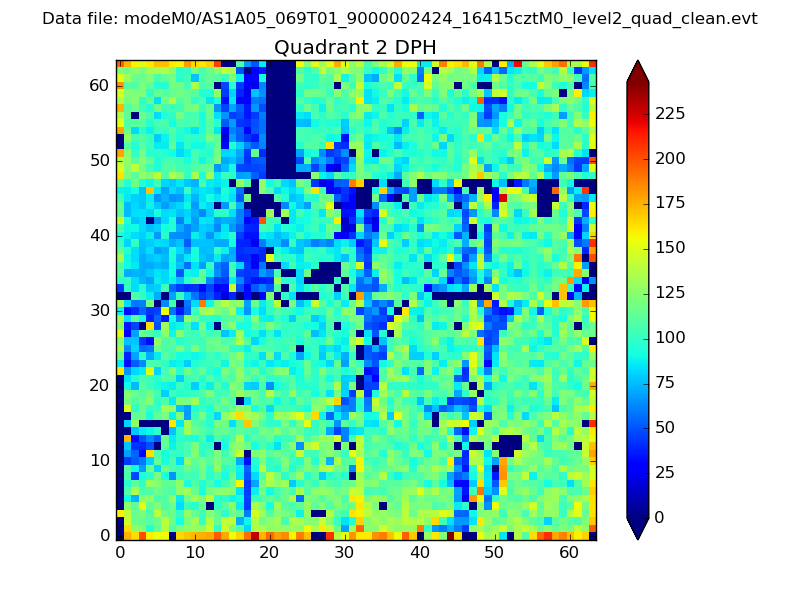
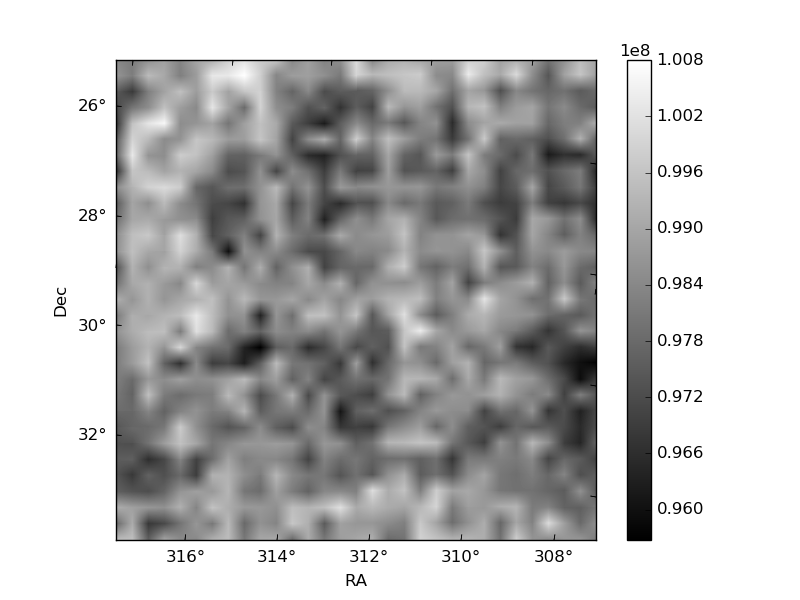
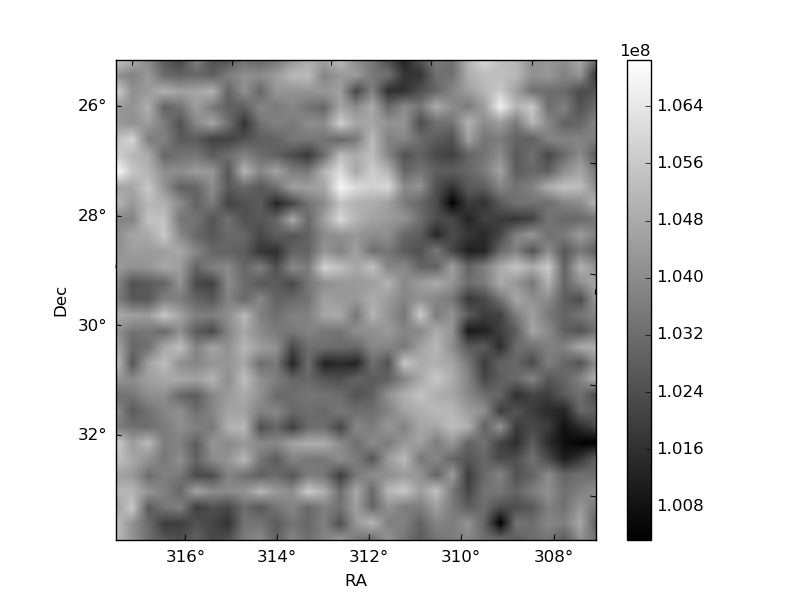
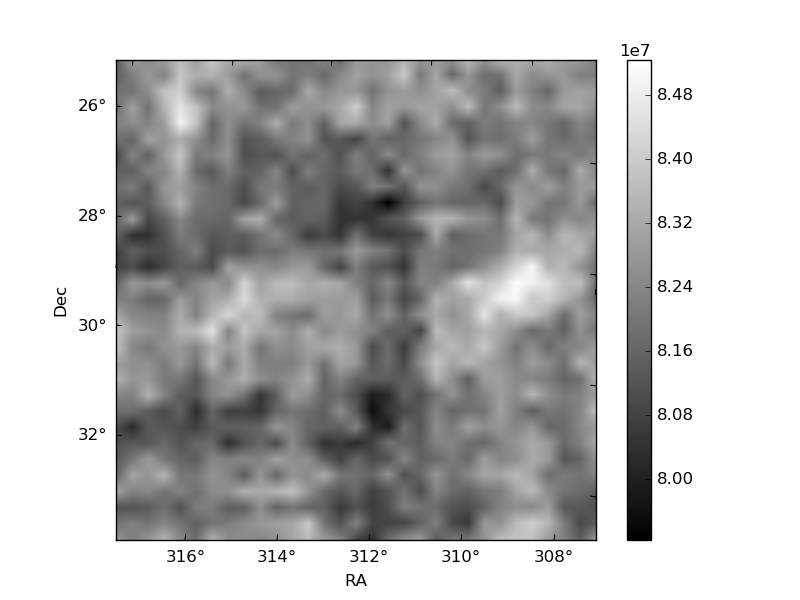
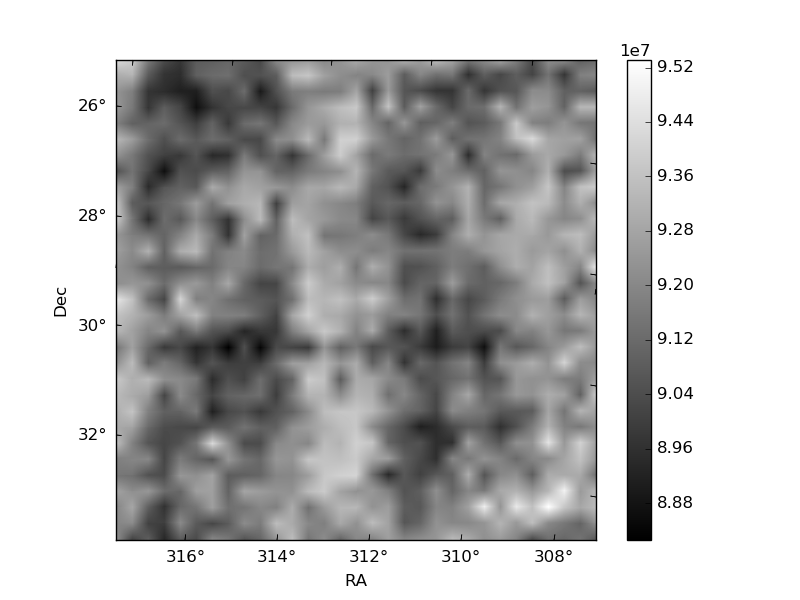
Histogram calculated using DETX and DETY for each event in the final _common_clean file
| Quadrant A | 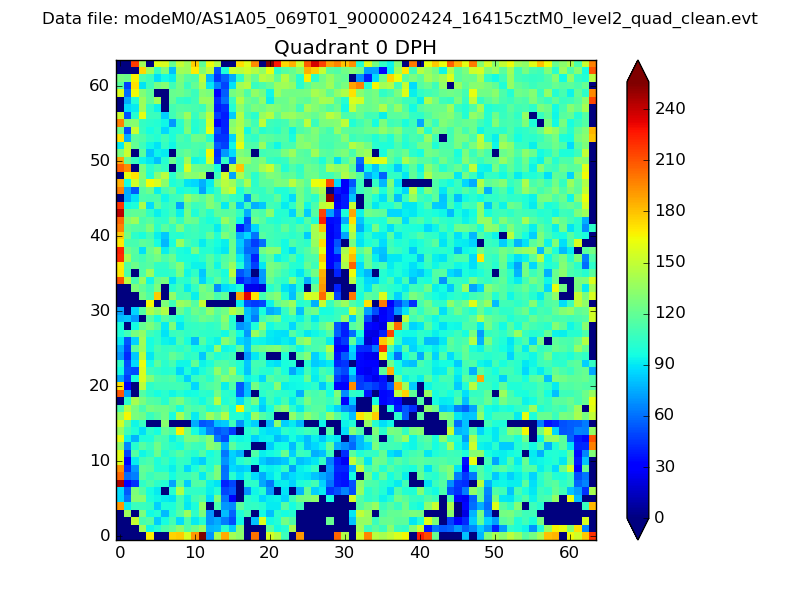 |
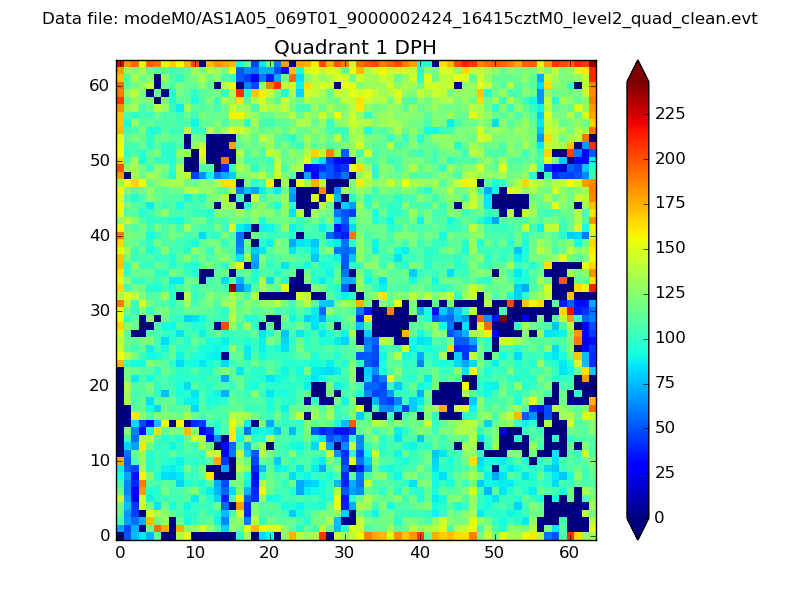 |
Quadrant B |
|---|---|---|---|
| Quadrant D | 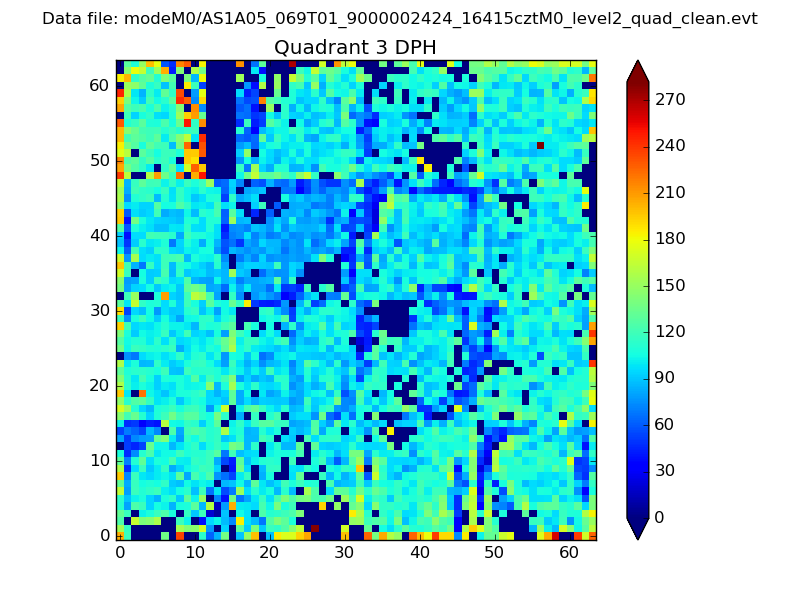 |
 |
Quadrant C |
| Plot type | Count rate plots | Images |
|---|---|---|
| Comparison with Poisson distribution Blue bars denote a histogram of data divided into 1 sec bins. Red curve is a Poisson curve with rate = median count rate of data. |
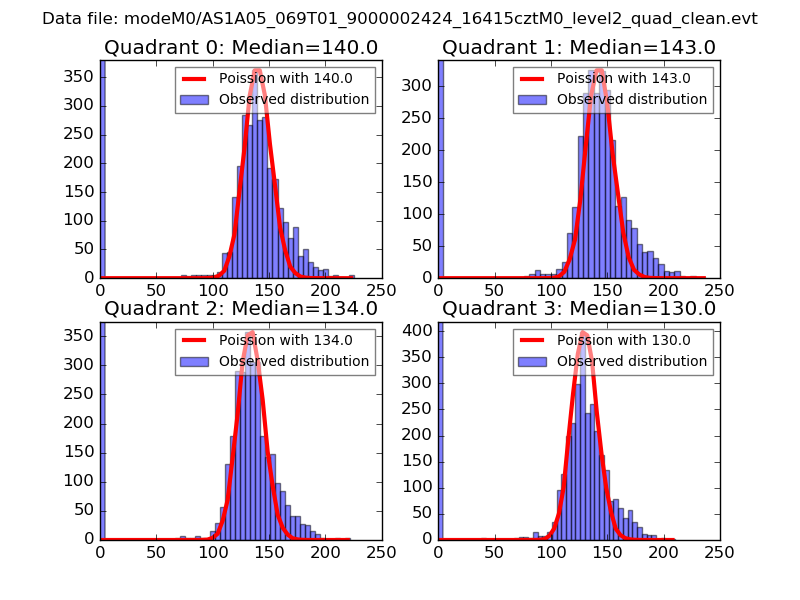 |
 |
| Quadrant-wise count rates Data is divided into 100 sec bins |
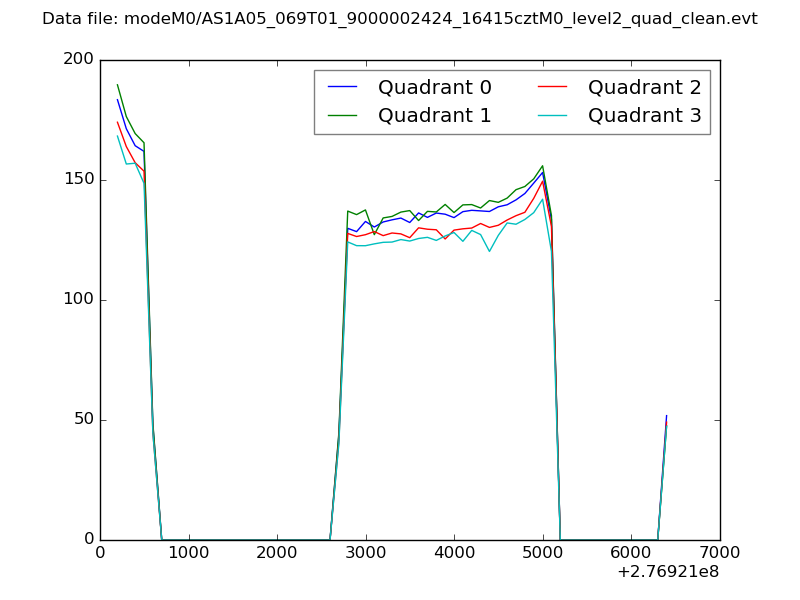 |
|
| Module-wise count rates for Quadrant A Data is divided into 100 sec bins |
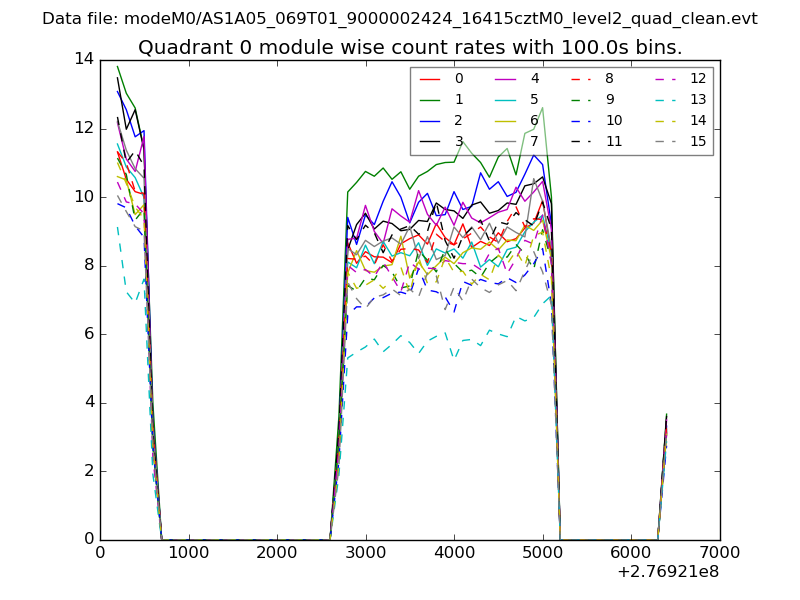 |
 |
| Module-wise count rates for Quadrant B Data is divided into 100 sec bins |
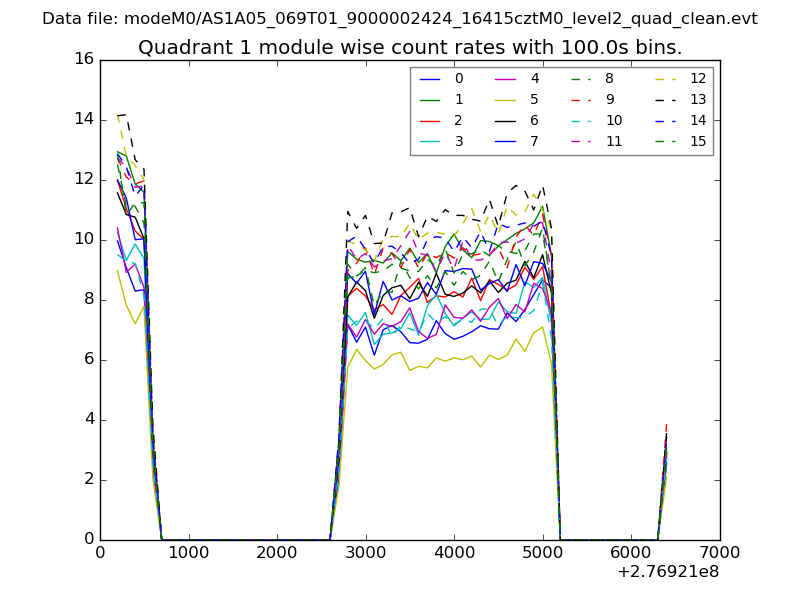 |
 |
| Module-wise count rates for Quadrant C Data is divided into 100 sec bins |
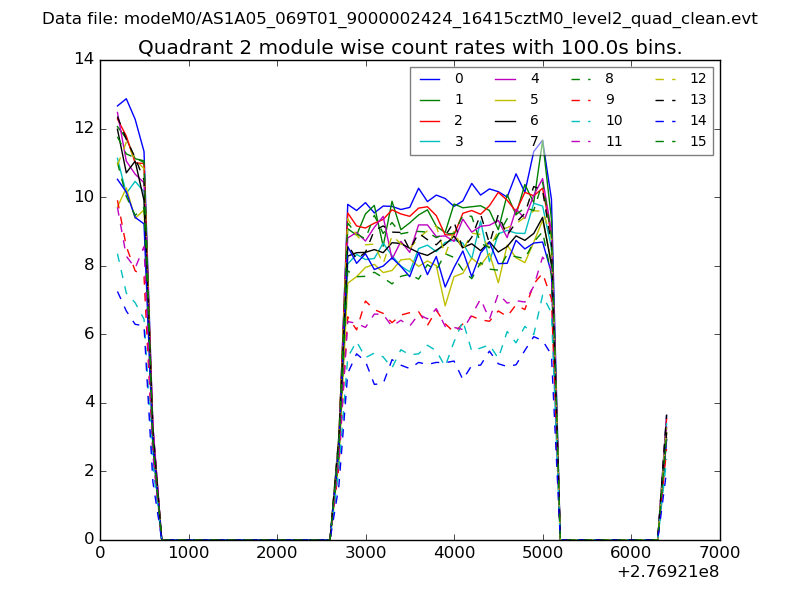 |
 |
| Module-wise count rates for Quadrant D Data is divided into 100 sec bins |
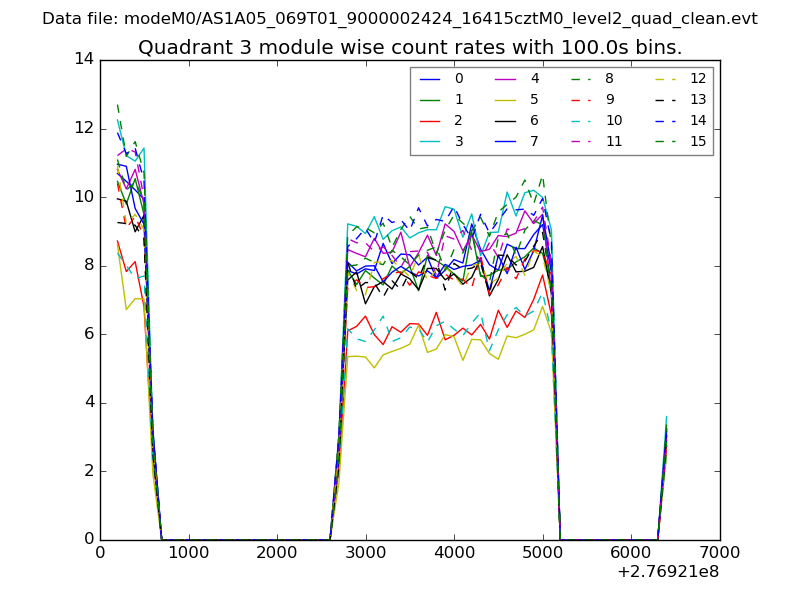 |
 |
| Parameter | Plot |
|---|---|
| CZT HV Monitor | 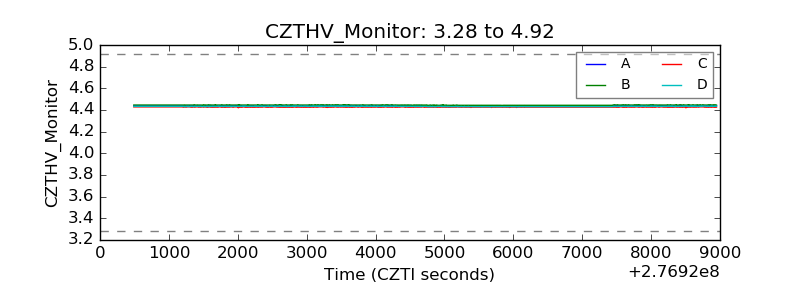 |
| D_VDD | 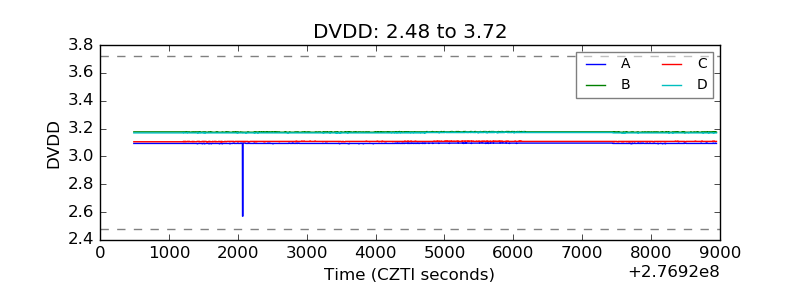 |
| Temperature 1 | 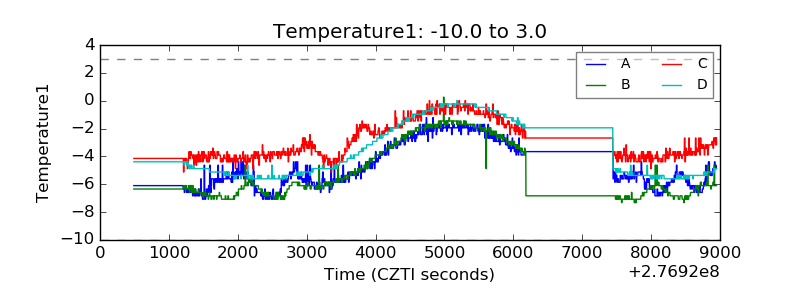 |
| Veto HV Monitor | 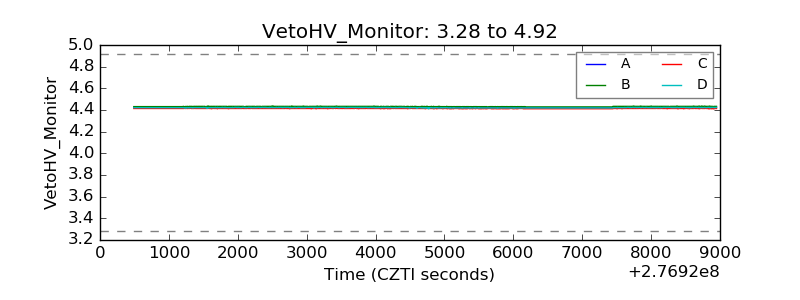 |
| Veto LLD | 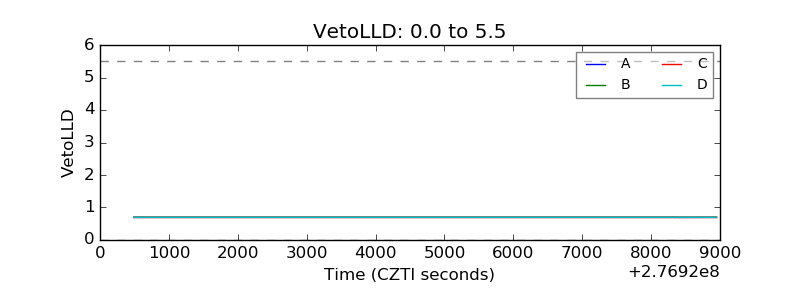 |
| Alpha Counter | 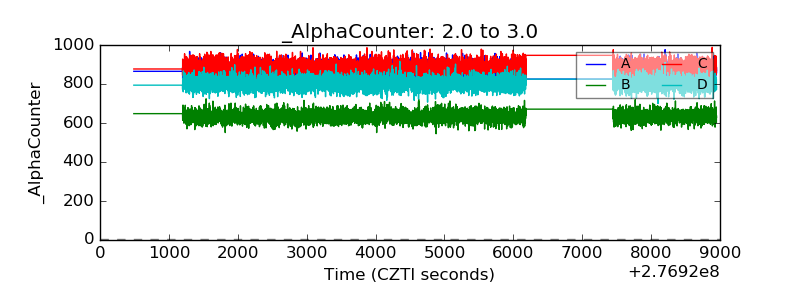 |
| _CPM_Rate | 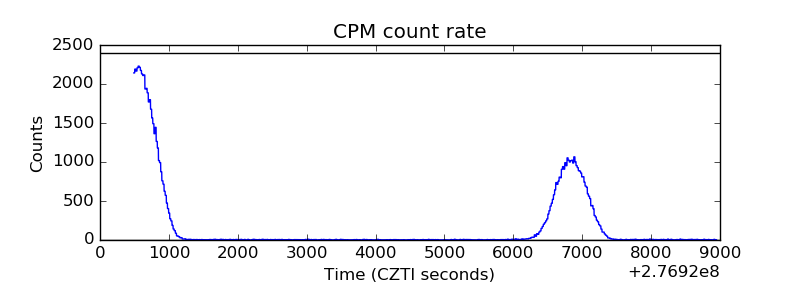 |
| CZT Counter | 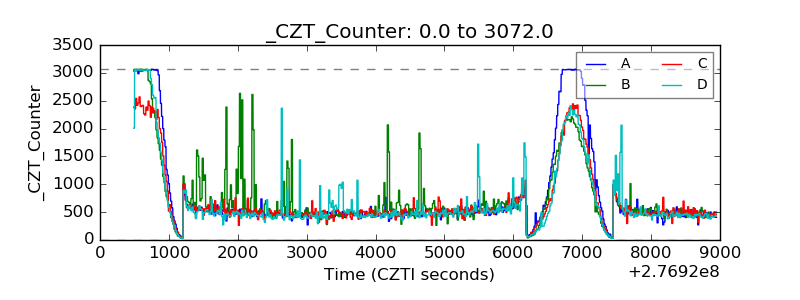 |
| +2.5 Volts monitor |  |
| +5 Volts monitor |  |
| _ROLL_ROT | 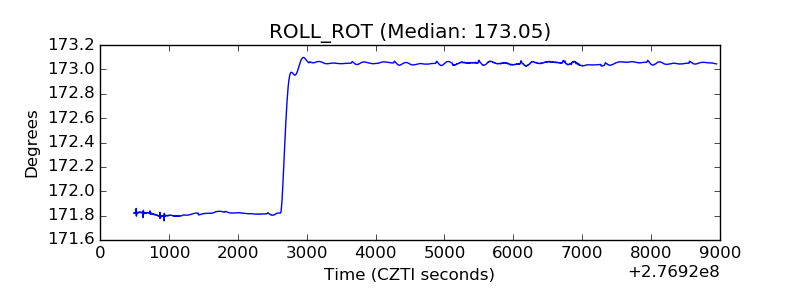 |
| _Roll_DEC | 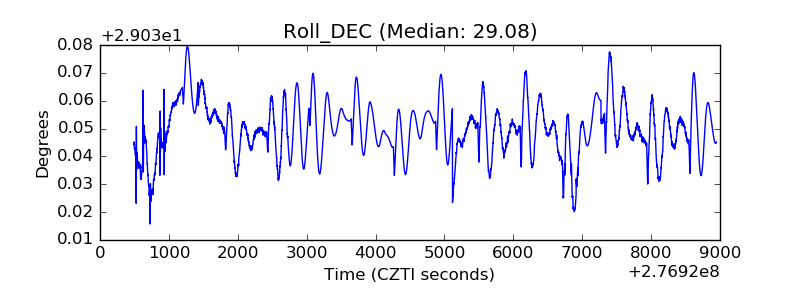 |
| _Roll_RA |  |
| Veto Counter | 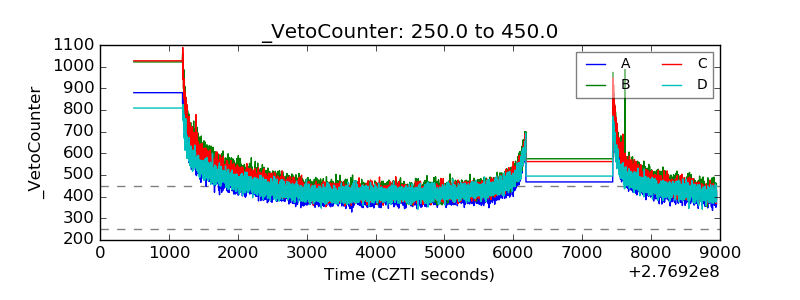 |