| Param | Original file | Final file |
|---|---|---|
| Filename | modeM0/AS1A05_069T01_9000002424_16416cztM0_level2.evt | modeM0/AS1A05_069T01_9000002424_16416cztM0_level2_quad_clean.evt |
| Size (bytes) | 463,599,360 | 68,158,080 |
| Size | 442.1 MB | 65.0 MB |
| Events in quadrant A | 3,201,477 | 410,476 |
| Events in quadrant B | 3,647,596 | 414,733 |
| Events in quadrant C | 3,261,089 | 395,236 |
| Events in quadrant D | 3,483,609 | 385,037 |
| Mode M0 | |||
|---|---|---|---|
| Quadrant | BADHDUFLAG | Total packets | Discarded packets |
| A | 0 | 13614 | 3 |
| B | 0 | 14808 | 2 |
| C | 0 | 13663 | 2 |
| D | 0 | 14769 | 2 |
| Mode M9 | |||
|---|---|---|---|
| Quadrant | BADHDUFLAG | Total packets | Discarded packets |
| A | 0 | 16 | 0 |
| B | 0 | 16 | 0 |
| C | 0 | 16 | 0 |
| D | 0 | 17 | 0 |
| Mode SS | |||
|---|---|---|---|
| Quadrant | BADHDUFLAG | Total packets | Discarded packets |
| A | 0 | 132 | 0 |
| B | 0 | 132 | 0 |
| C | 0 | 132 | 0 |
| D | 0 | 132 | 0 |
| Quadrant | Total seconds | Saturated seconds | Saturation percentage |
|---|---|---|---|
| A | 6575 | 52 | 0.790875% |
| B | 6575 | 162 | 2.463878% |
| C | 6575 | 73 | 1.110266% |
| D | 6575 | 67 | 1.019011% |
Noise dominated data is calculated using 1-second bins in cleaned event files. If a bin has >2000 counts, and if more than 50% of those come from <1% of pixels, then it is considered to be noise-dominated and hence unusable.
| Quadrant | # 1 sec bins | Bins with >0 counts | Bins with >2000 counts | High rate bins dominated by noise | Noise dominated (total time) | Noise dominated (detector-on time) | Marked lightcurve |
|---|---|---|---|---|---|---|---|
| A | 7616 | 6577 | 0 | 0 | 0.00% | 0.00% | 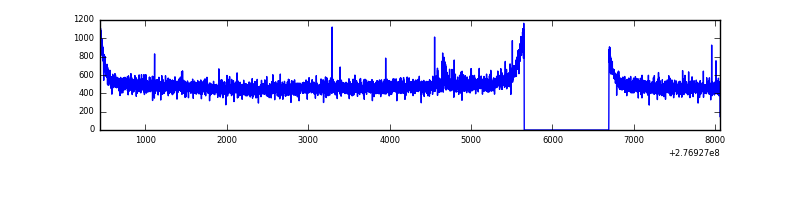 |
| B | 7616 | 6577 | 37 | 37 | 0.49% | 0.56% | 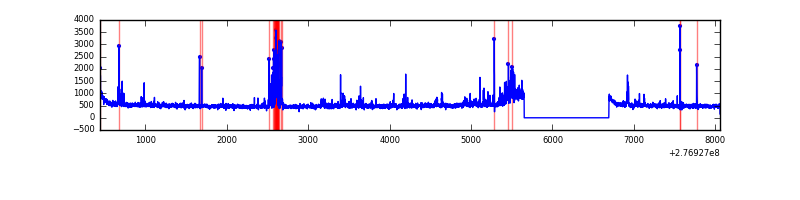 |
| C | 7616 | 6577 | 1 | 1 | 0.01% | 0.02% | 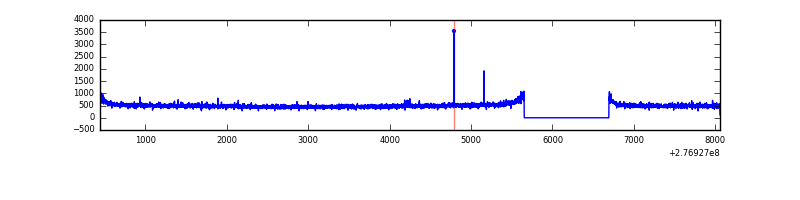 |
| D | 7616 | 6577 | 28 | 28 | 0.37% | 0.43% | 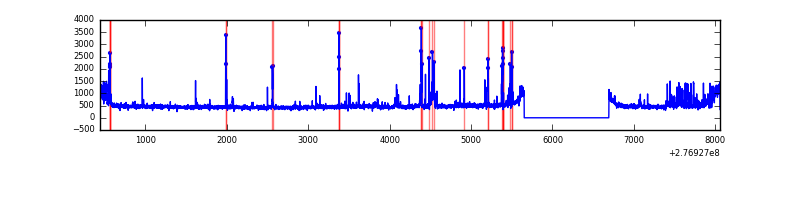 |
Top three noisy pixels from each quadrant. If the there are fewer than three noisy pixels in the level2.evt file, extra rows are filled as -1
| Pixel properties | Quadrant properties | ||||||
|---|---|---|---|---|---|---|---|
| Quadrant | DetID | PixID | Counts | Sigma | Mean | Median | Sigma |
| A | 15 | 223 | 17912 | 103.24 | 824 | 806 | 165.7 |
| A | 15 | 174 | 10916 | 61.02 | 824 | 806 | 165.7 |
| A | 0 | 226 | 7296 | 39.17 | 824 | 806 | 165.7 |
| B | 4 | 173 | 156590 | 984.68 | 827 | 806 | 158.2 |
| B | 15 | 35 | 125246 | 786.56 | 827 | 806 | 158.2 |
| B | 0 | 198 | 35104 | 216.79 | 827 | 806 | 158.2 |
| C | 14 | 238 | 120736 | 653.61 | 786 | 791 | 183.5 |
| C | 7 | 247 | 46055 | 246.65 | 786 | 791 | 183.5 |
| C | 3 | 233 | 23222 | 122.23 | 786 | 791 | 183.5 |
| D | 1 | 20 | 184781 | 951.57 | 790 | 767 | 193.4 |
| D | 12 | 218 | 159690 | 821.82 | 790 | 767 | 193.4 |
| D | 10 | 70 | 67133 | 343.19 | 790 | 767 | 193.4 |
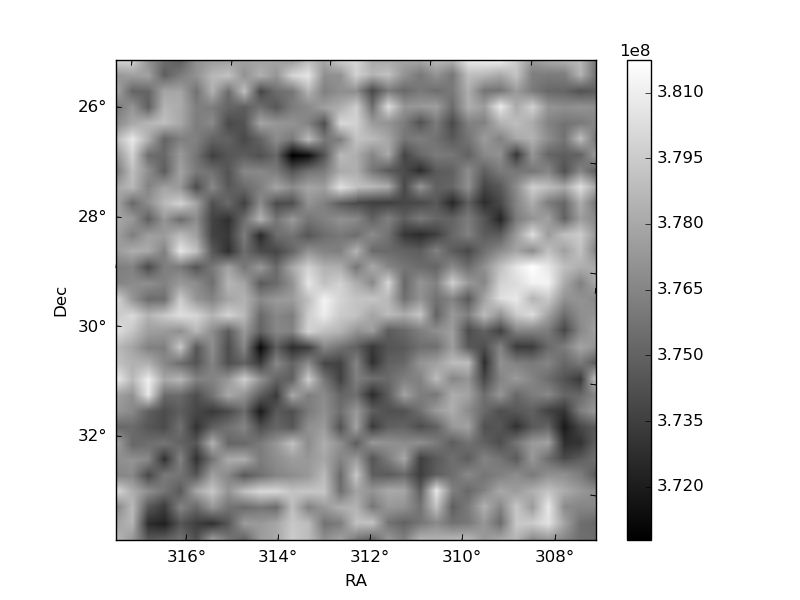
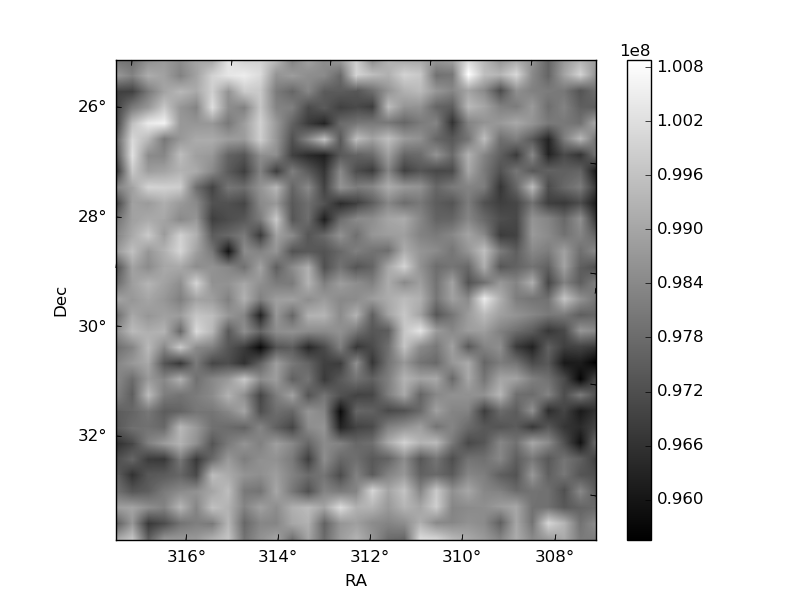
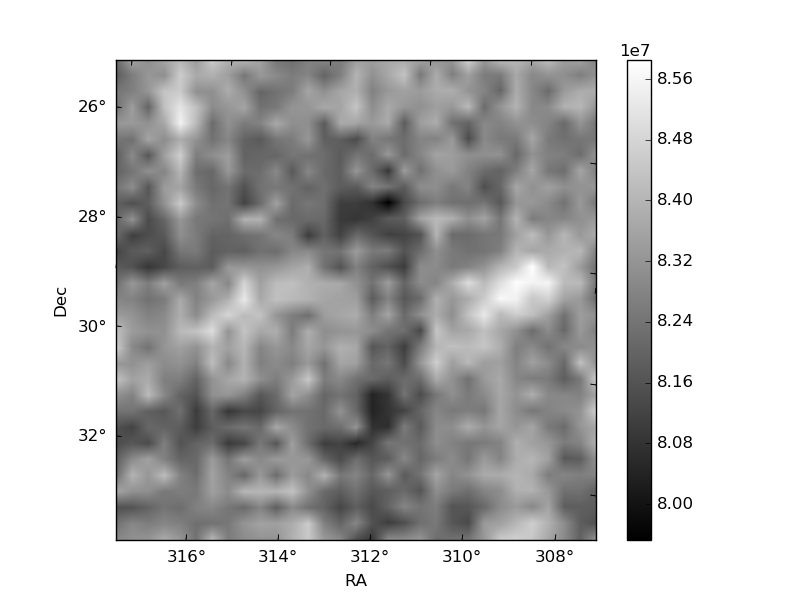
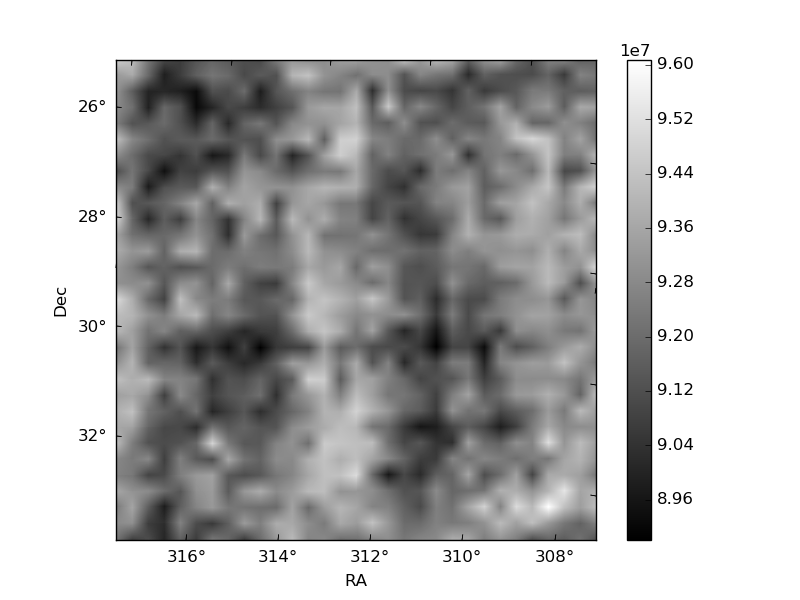
Histogram calculated using DETX and DETY for each event in the final _common_clean file
| Quadrant A | 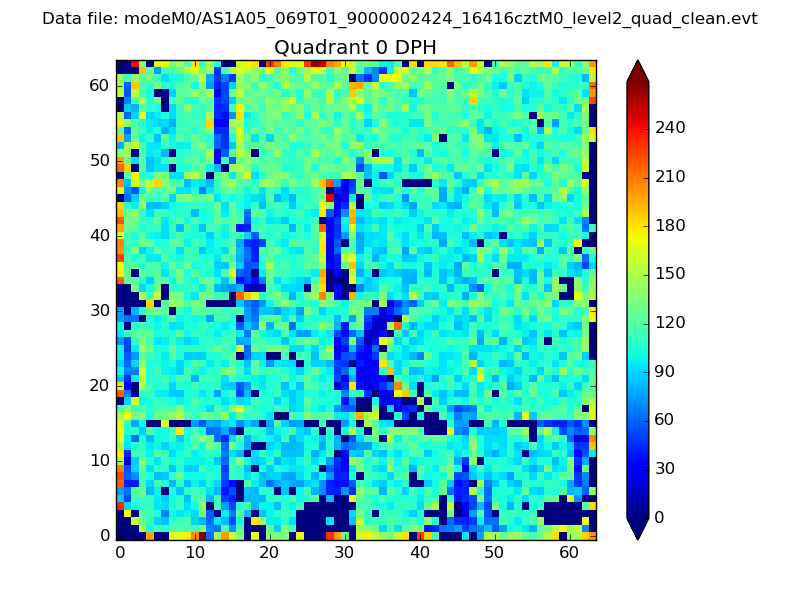 |
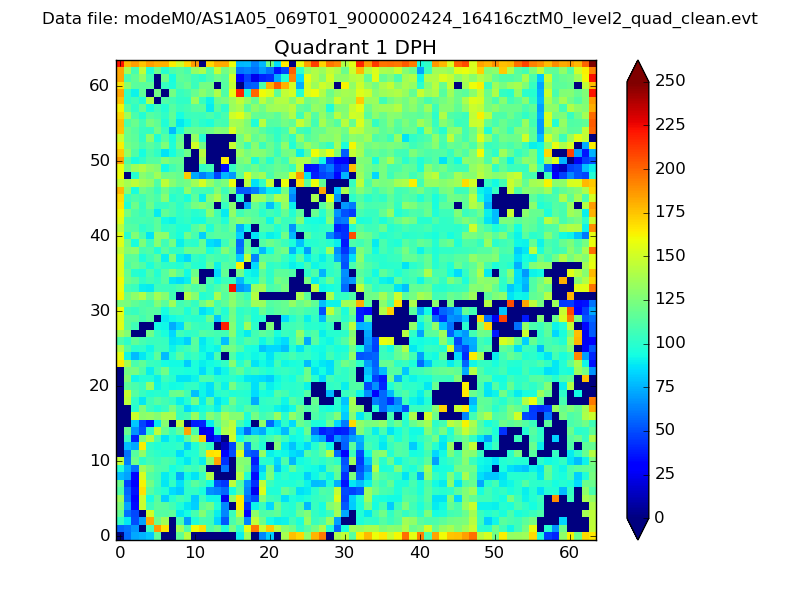 |
Quadrant B |
|---|---|---|---|
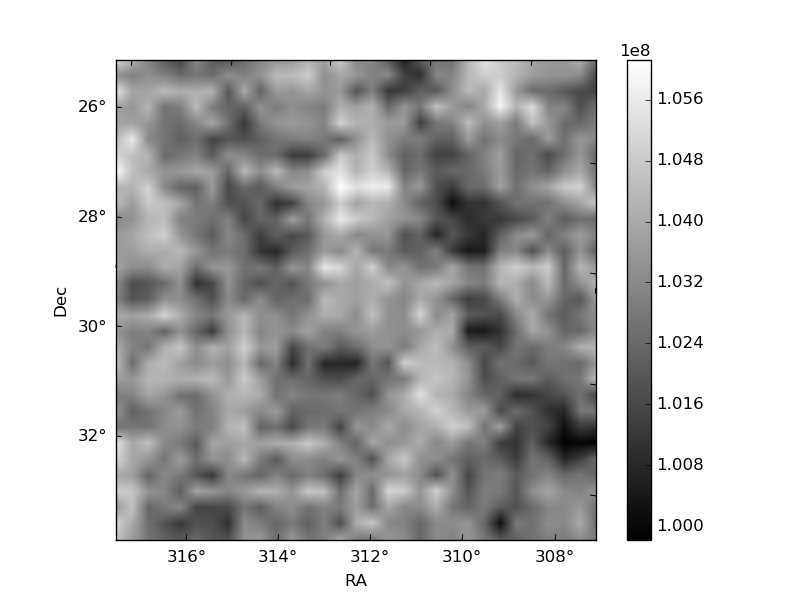
| Quadrant D | 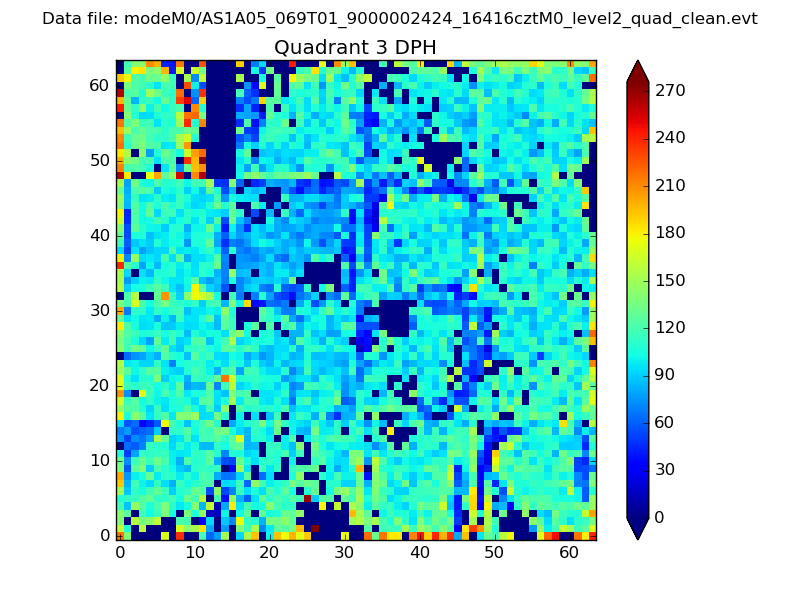 |
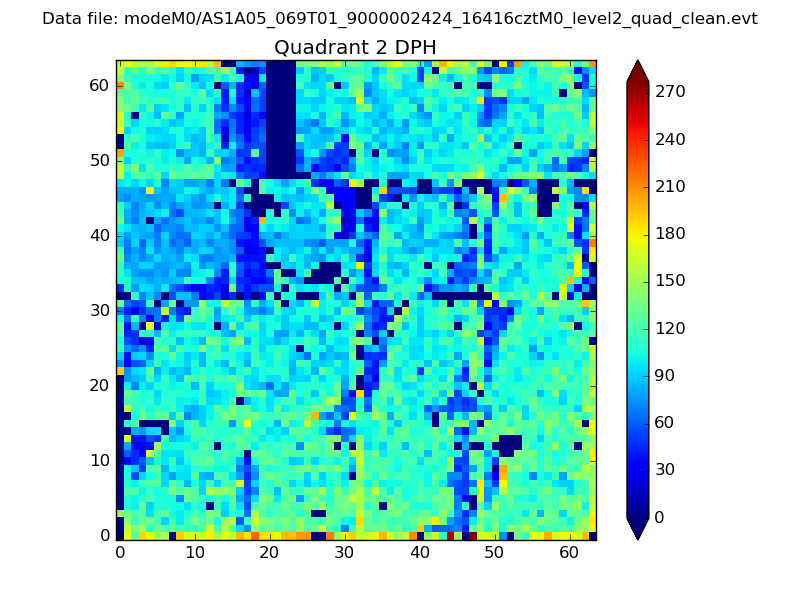 |
Quadrant C |
| Plot type | Count rate plots | Images |
|---|---|---|
| Comparison with Poisson distribution Blue bars denote a histogram of data divided into 1 sec bins. Red curve is a Poisson curve with rate = median count rate of data. |
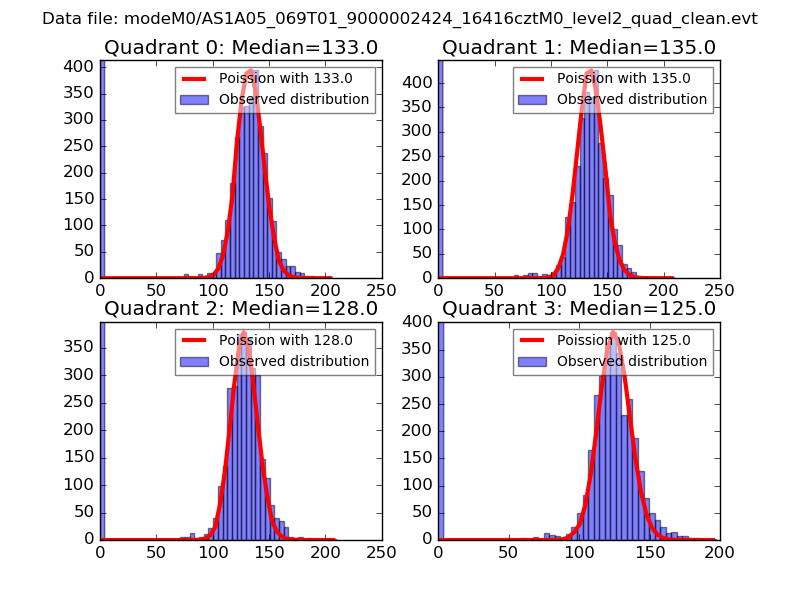 |
 |
| Quadrant-wise count rates Data is divided into 100 sec bins |
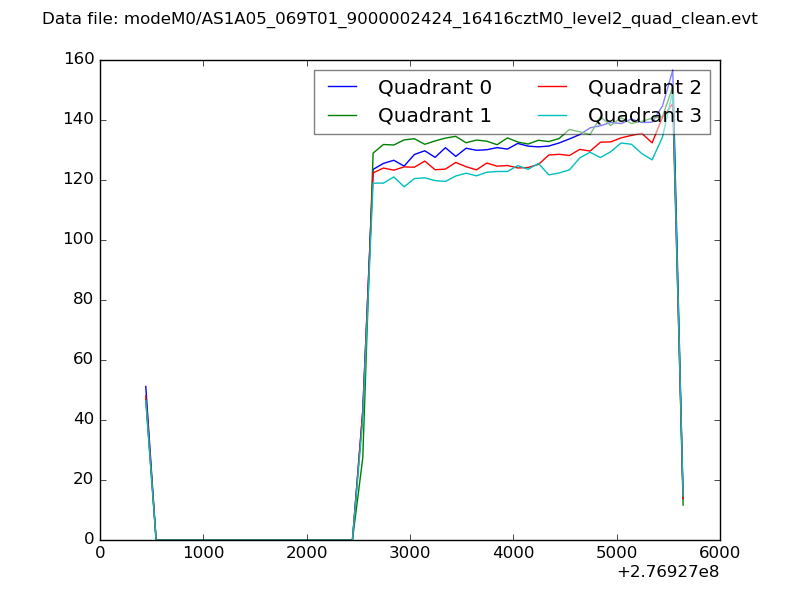 |
|
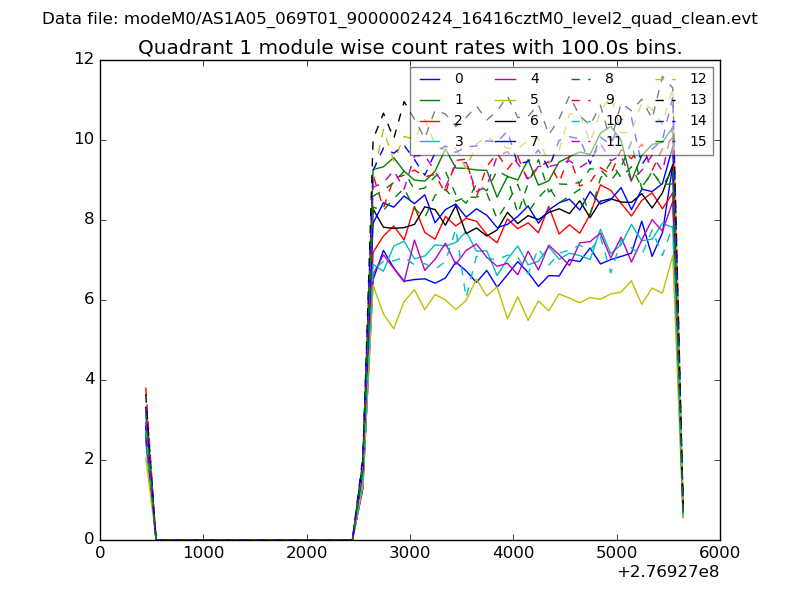
| Module-wise count rates for Quadrant A Data is divided into 100 sec bins |
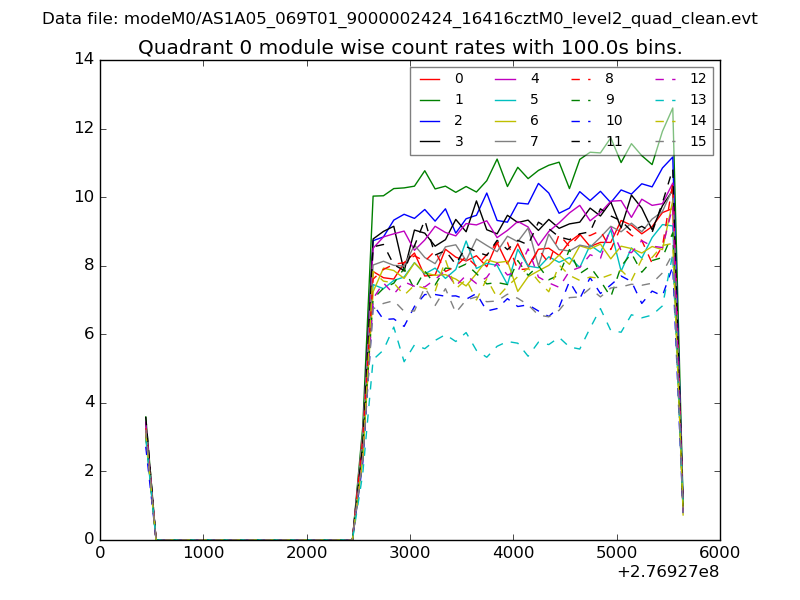 |
 |
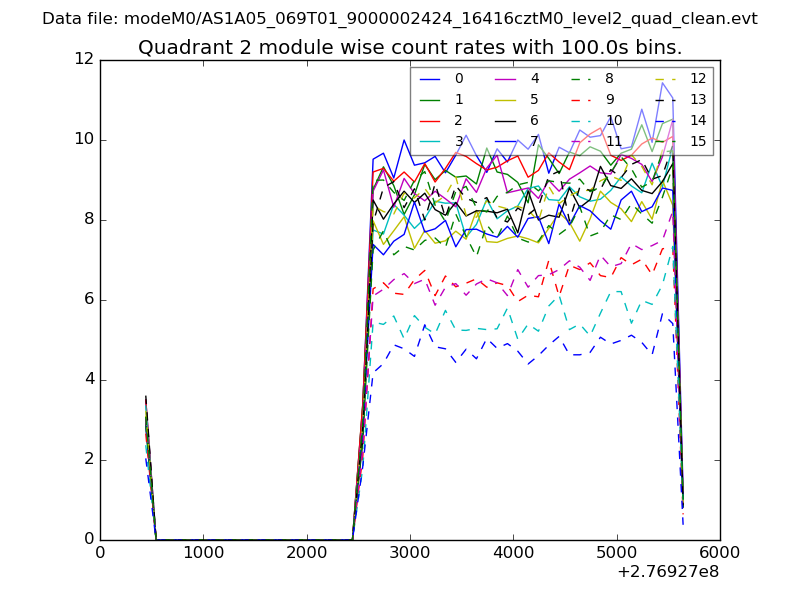
| Module-wise count rates for Quadrant B Data is divided into 100 sec bins |
 |
 |
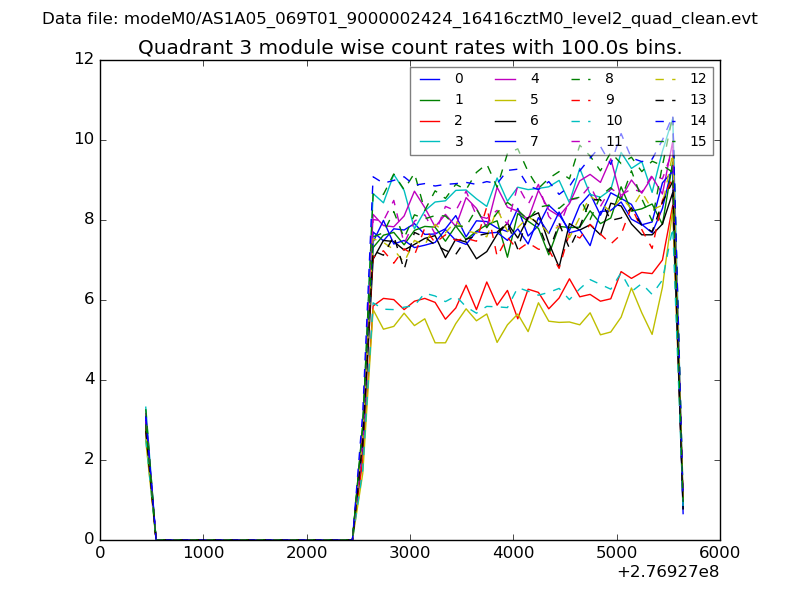
| Module-wise count rates for Quadrant C Data is divided into 100 sec bins |
 |
 |
| Module-wise count rates for Quadrant D Data is divided into 100 sec bins |
 |
 |
| Parameter | Plot |
|---|---|
| CZT HV Monitor | 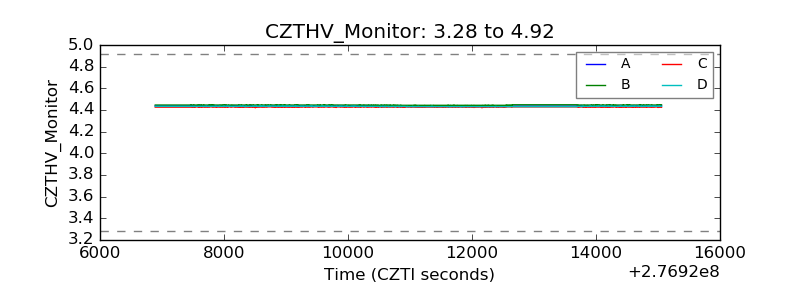 |
| D_VDD |  |
| Temperature 1 | 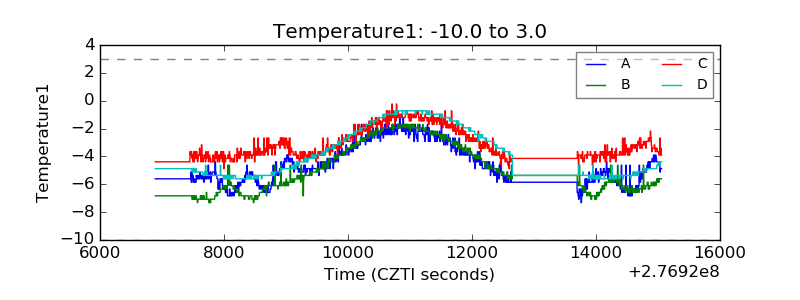 |
| Veto HV Monitor | 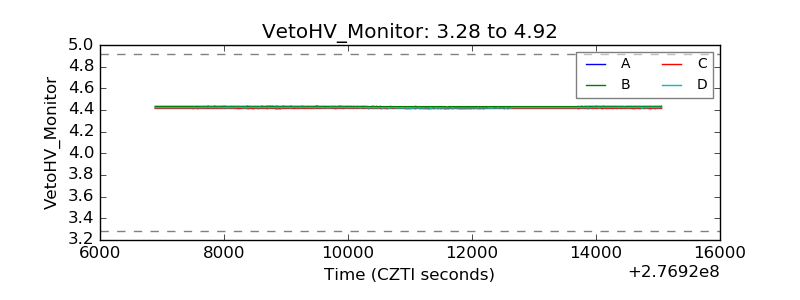 |
| Veto LLD | 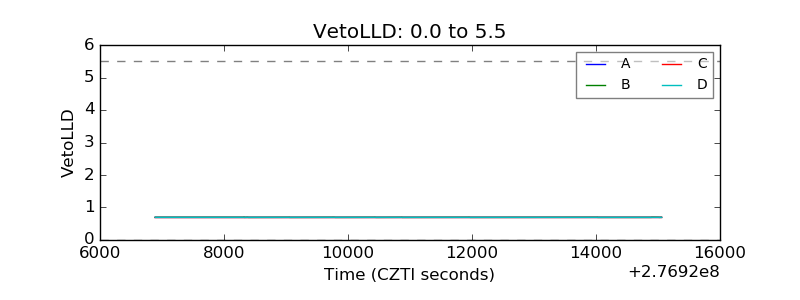 |
| Alpha Counter | 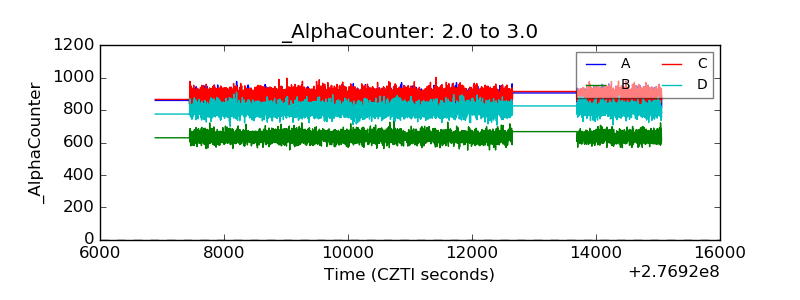 |
| _CPM_Rate | 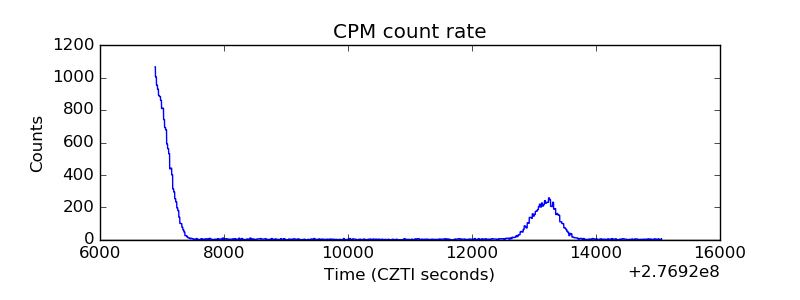 |
| CZT Counter | 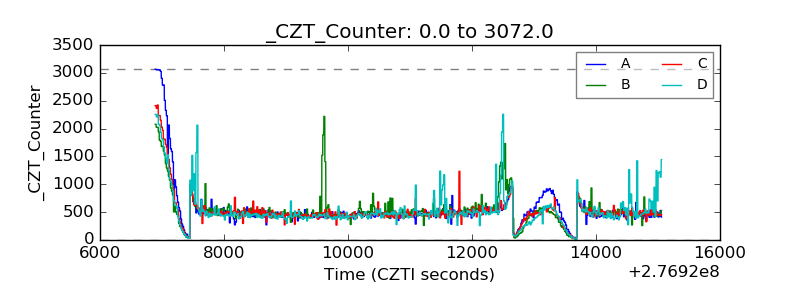 |
| +2.5 Volts monitor |  |
| +5 Volts monitor |  |
| _ROLL_ROT | 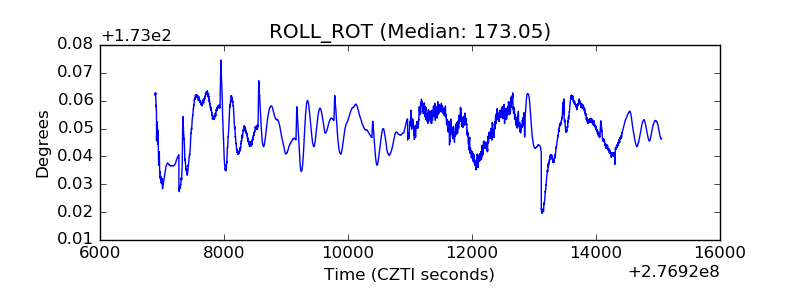 |
| _Roll_DEC | 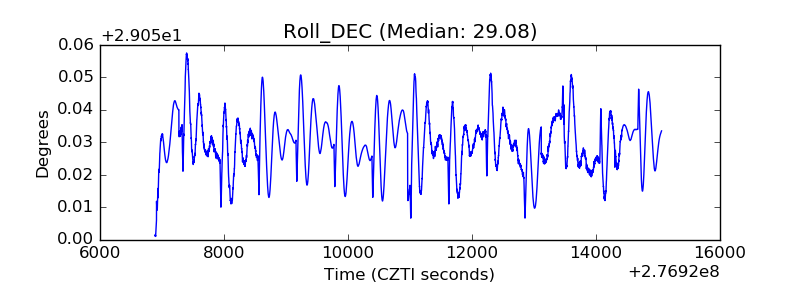 |
| _Roll_RA | 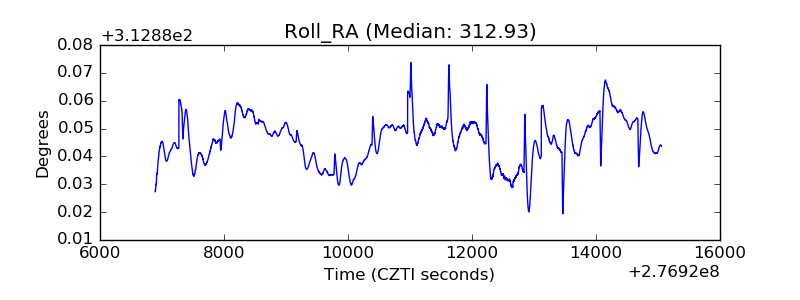 |
| Veto Counter | 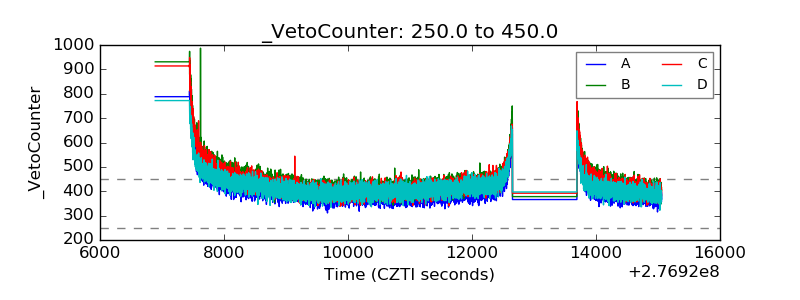 |