| Param | Original file | Final file |
|---|---|---|
| Filename | modeM0/AS1A05_069T01_9000002424_16418cztM0_level2.evt | modeM0/AS1A05_069T01_9000002424_16418cztM0_level2_quad_clean.evt |
| Size (bytes) | 682,358,400 | 98,231,040 |
| Size | 650.7 MB | 93.7 MB |
| Events in quadrant A | 4,154,511 | 609,531 |
| Events in quadrant B | 4,592,654 | 617,228 |
| Events in quadrant C | 4,347,038 | 589,586 |
| Events in quadrant D | 6,989,666 | 562,475 |
| Mode M0 | |||
|---|---|---|---|
| Quadrant | BADHDUFLAG | Total packets | Discarded packets |
| A | 0 | 18018 | 3 |
| B | 0 | 19009 | 2 |
| C | 0 | 18399 | 2 |
| D | 0 | 26712 | 2 |
| Mode M9 | |||
|---|---|---|---|
| Quadrant | BADHDUFLAG | Total packets | Discarded packets |
| A | 0 | 6 | 0 |
| B | 0 | 6 | 0 |
| C | 0 | 6 | 0 |
| D | 0 | 6 | 0 |
| Mode SS | |||
|---|---|---|---|
| Quadrant | BADHDUFLAG | Total packets | Discarded packets |
| A | 0 | 176 | 0 |
| B | 0 | 176 | 0 |
| C | 0 | 176 | 0 |
| D | 0 | 176 | 0 |
| Quadrant | Total seconds | Saturated seconds | Saturation percentage |
|---|---|---|---|
| A | 8579 | 439 | 5.117147% |
| B | 8579 | 515 | 6.003031% |
| C | 8579 | 471 | 5.490150% |
| D | 8579 | 546 | 6.364378% |
Noise dominated data is calculated using 1-second bins in cleaned event files. If a bin has >2000 counts, and if more than 50% of those come from <1% of pixels, then it is considered to be noise-dominated and hence unusable.
| Quadrant | # 1 sec bins | Bins with >0 counts | Bins with >2000 counts | High rate bins dominated by noise | Noise dominated (total time) | Noise dominated (detector-on time) | Marked lightcurve |
|---|---|---|---|---|---|---|---|
| A | 9180 | 8581 | 0 | 0 | 0.00% | 0.00% | 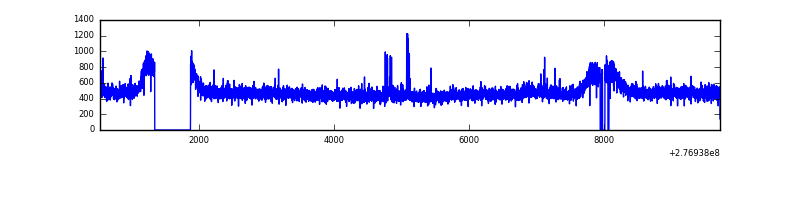 |
| B | 9180 | 8581 | 12 | 12 | 0.13% | 0.14% | 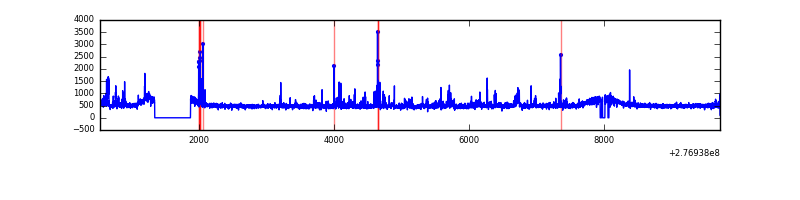 |
| C | 9180 | 8582 | 0 | 0 | 0.00% | 0.00% | 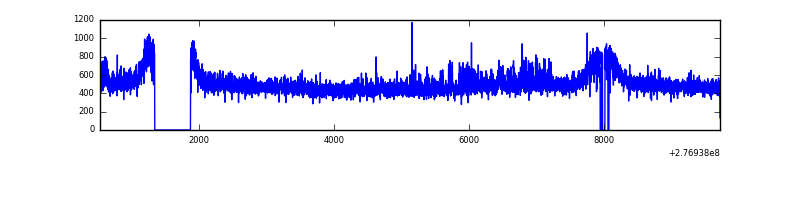 |
| D | 9180 | 8581 | 226 | 226 | 2.46% | 2.63% | 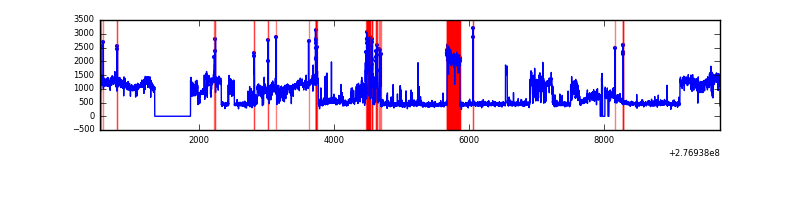 |
Top three noisy pixels from each quadrant. If the there are fewer than three noisy pixels in the level2.evt file, extra rows are filled as -1
| Pixel properties | Quadrant properties | ||||||
|---|---|---|---|---|---|---|---|
| Quadrant | DetID | PixID | Counts | Sigma | Mean | Median | Sigma |
| A | 15 | 174 | 34951 | 155.54 | 1069 | 1042 | 218.0 |
| A | 0 | 226 | 9467 | 38.64 | 1069 | 1042 | 218.0 |
| A | 12 | 194 | 7898 | 31.45 | 1069 | 1042 | 218.0 |
| B | 15 | 35 | 146757 | 704.09 | 1070 | 1039 | 207.0 |
| B | 4 | 173 | 72332 | 344.48 | 1070 | 1039 | 207.0 |
| B | 0 | 198 | 55777 | 264.49 | 1070 | 1039 | 207.0 |
| C | 14 | 238 | 156817 | 647.47 | 1027 | 1031 | 240.6 |
| C | 3 | 233 | 118552 | 488.44 | 1027 | 1031 | 240.6 |
| C | 7 | 247 | 60936 | 248.97 | 1027 | 1031 | 240.6 |
| D | 1 | 20 | 2474419 | 9816.06 | 1031 | 998 | 252.0 |
| D | 12 | 218 | 446013 | 1766.09 | 1031 | 998 | 252.0 |
| D | 1 | 52 | 65560 | 256.22 | 1031 | 998 | 252.0 |
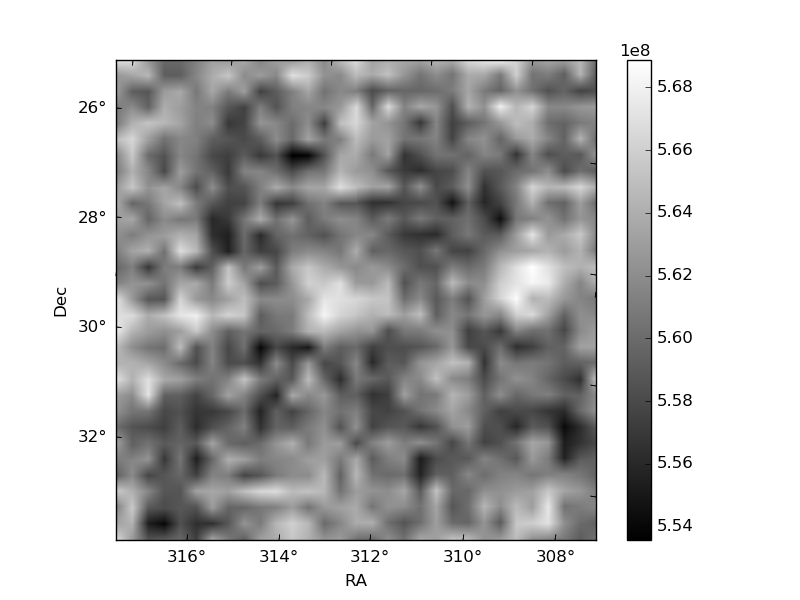
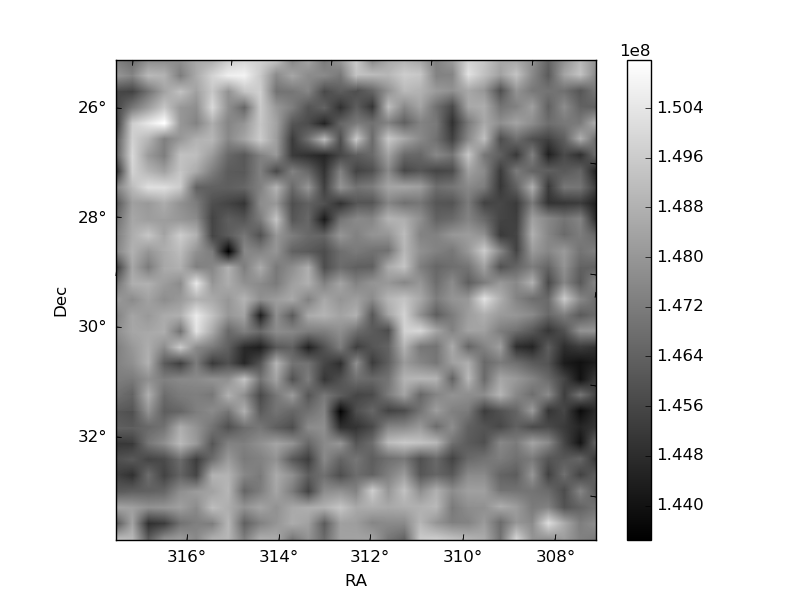
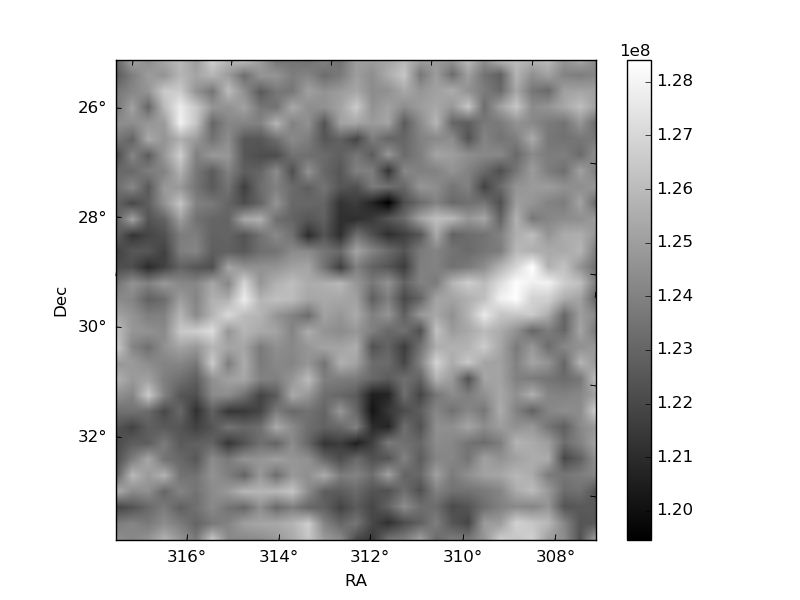
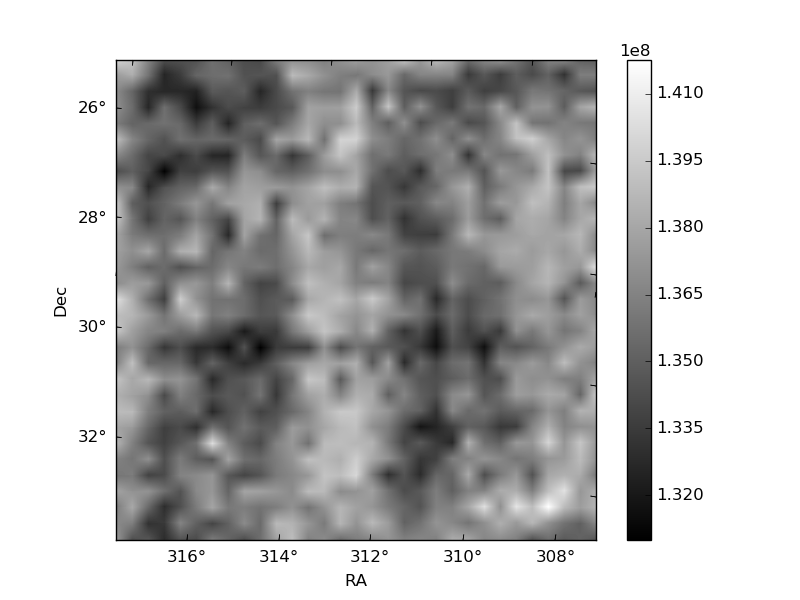
Histogram calculated using DETX and DETY for each event in the final _common_clean file
| Quadrant A | 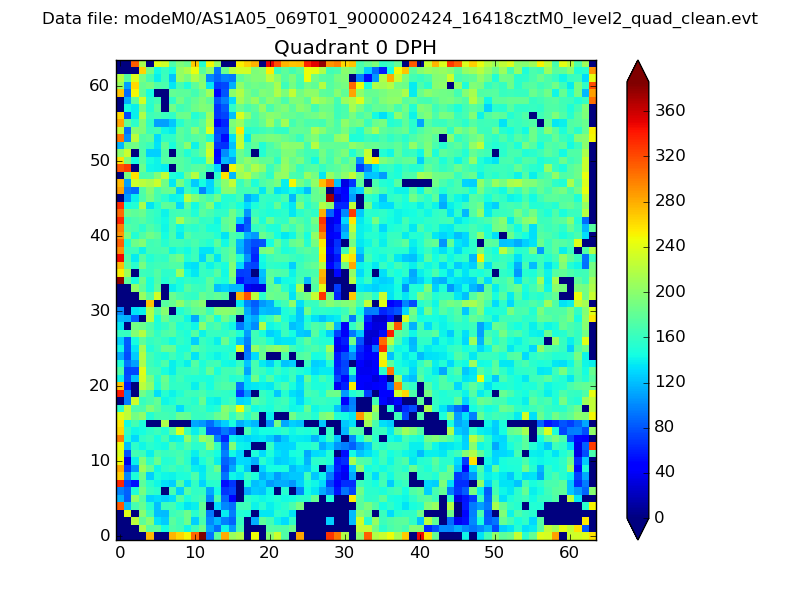 |
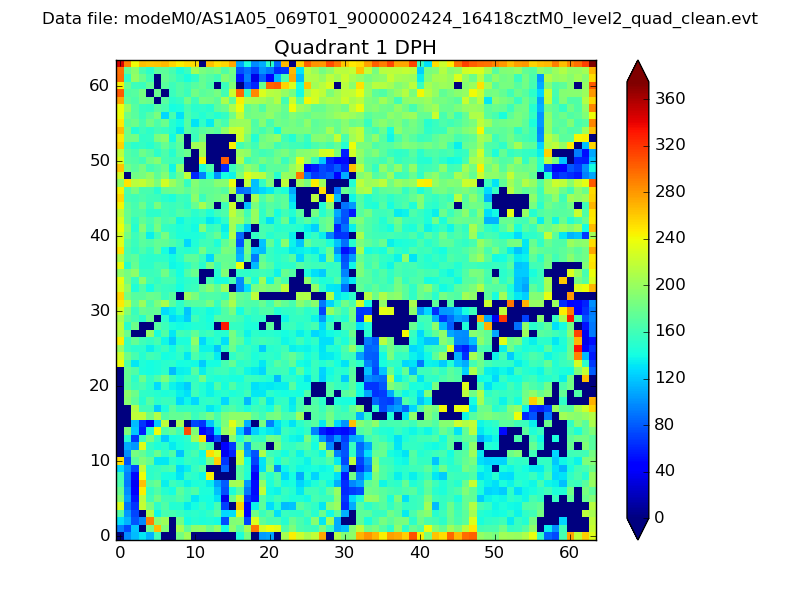 |
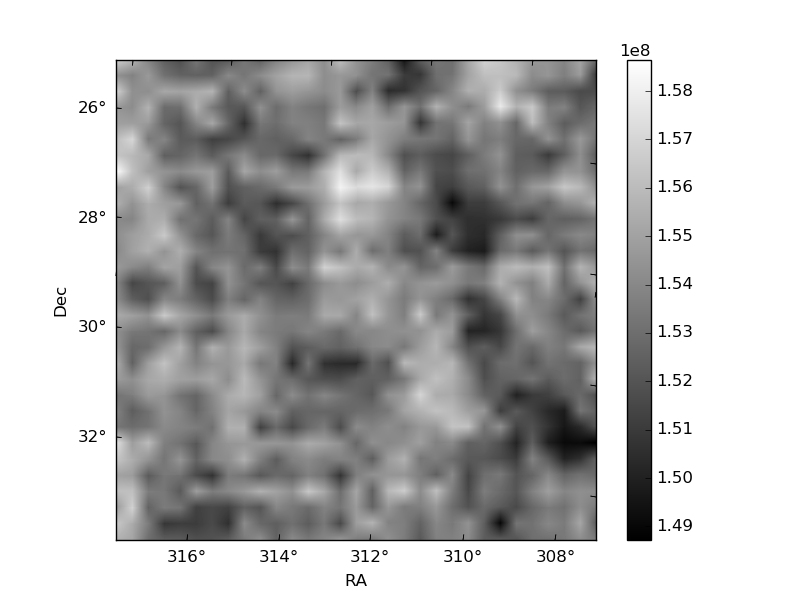
Quadrant B |
|---|---|---|---|
| Quadrant D | 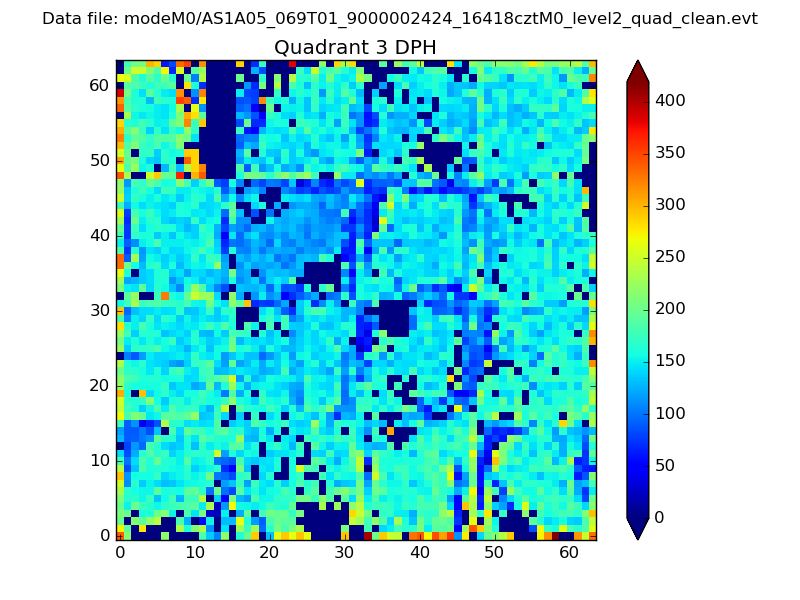 |
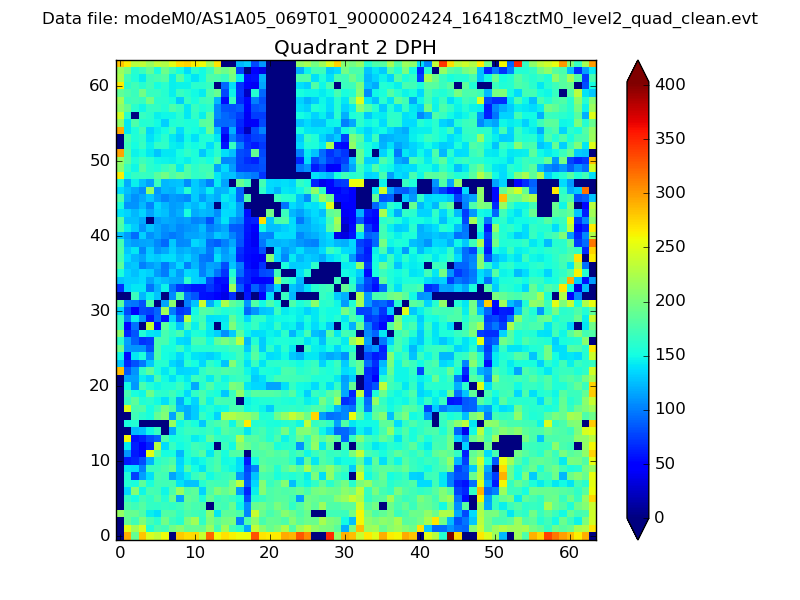 |
Quadrant C |
| Plot type | Count rate plots | Images |
|---|---|---|
| Comparison with Poisson distribution Blue bars denote a histogram of data divided into 1 sec bins. Red curve is a Poisson curve with rate = median count rate of data. |
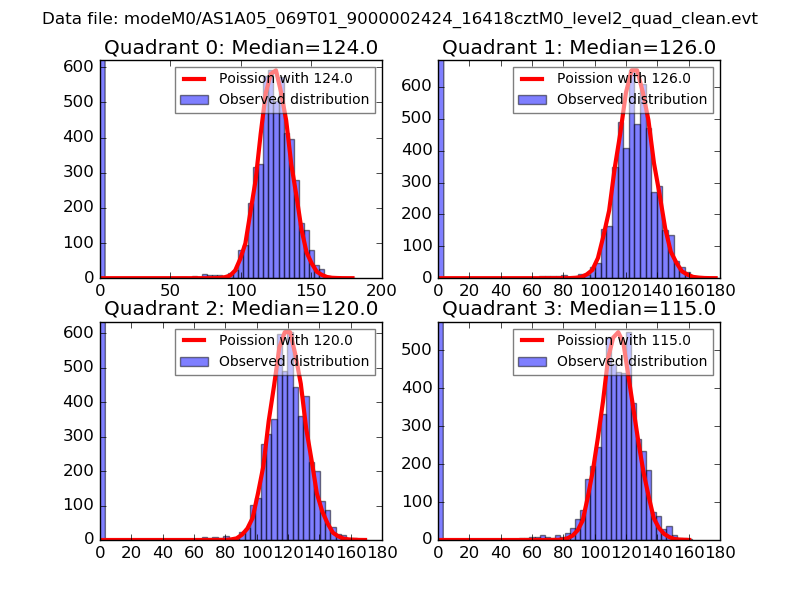 |
 |
| Quadrant-wise count rates Data is divided into 100 sec bins |
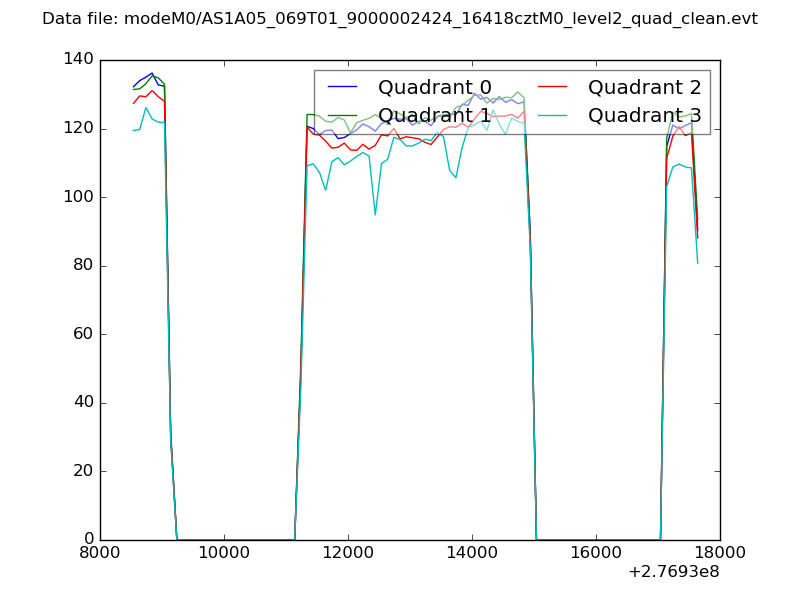 |
|
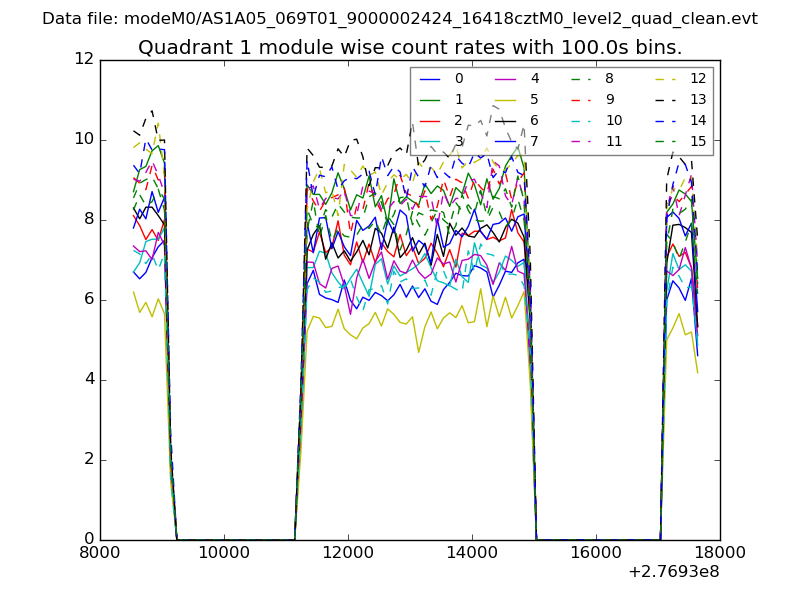
| Module-wise count rates for Quadrant A Data is divided into 100 sec bins |
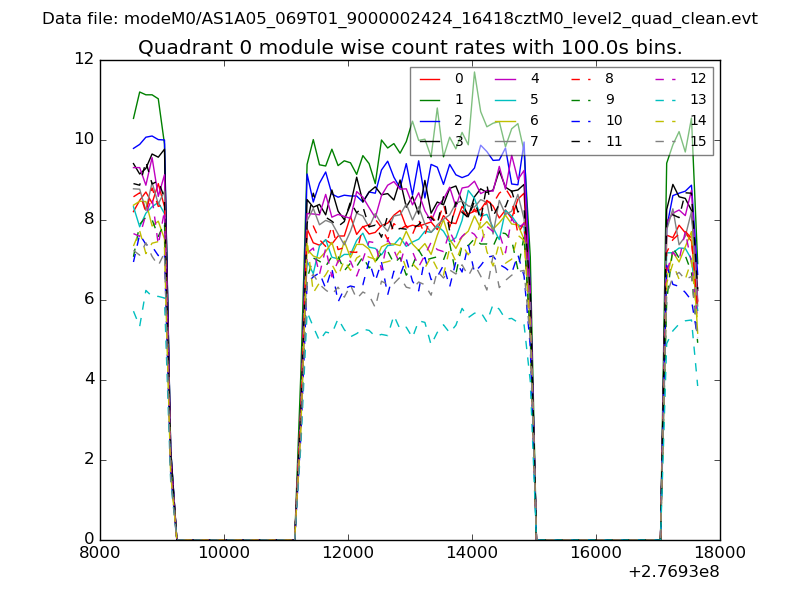 |
 |
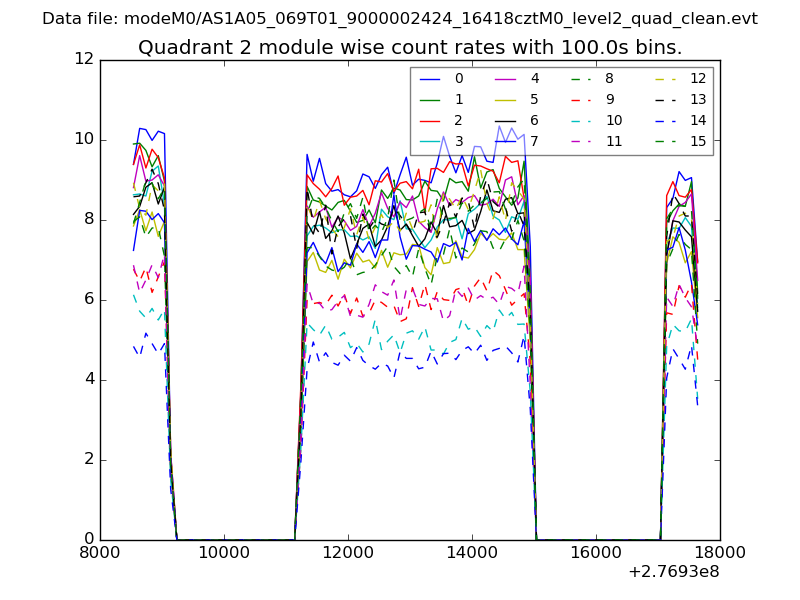
| Module-wise count rates for Quadrant B Data is divided into 100 sec bins |
 |
 |
| Module-wise count rates for Quadrant C Data is divided into 100 sec bins |
 |
 |
| Module-wise count rates for Quadrant D Data is divided into 100 sec bins |
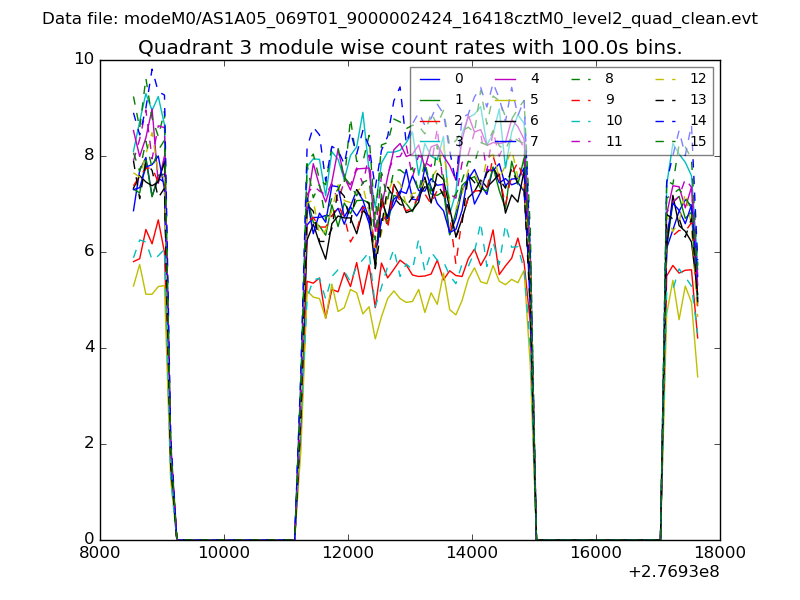 |
 |
| Parameter | Plot |
|---|---|
| CZT HV Monitor | 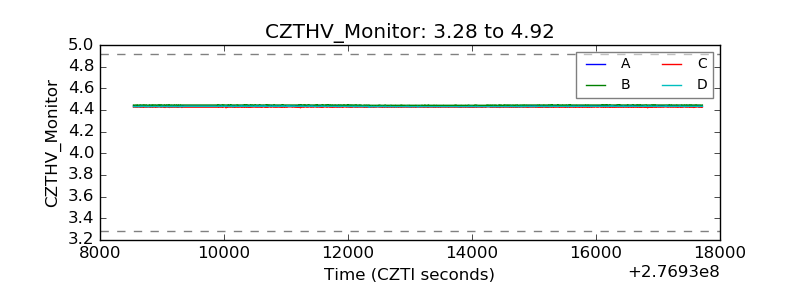 |
| D_VDD | 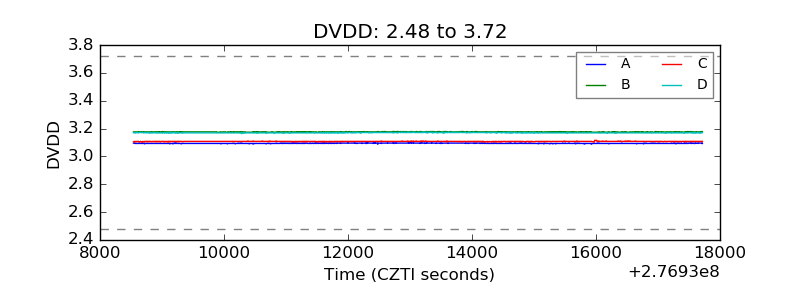 |
| Temperature 1 | 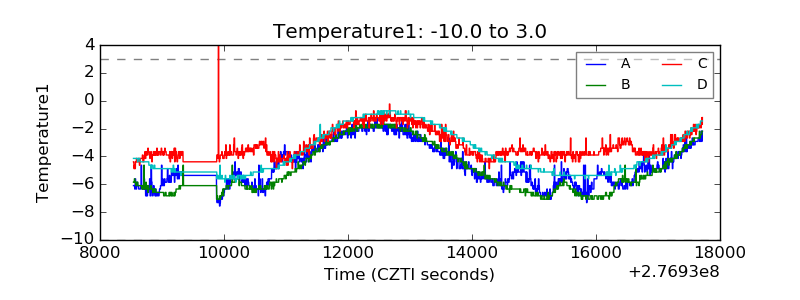 |
| Veto HV Monitor | 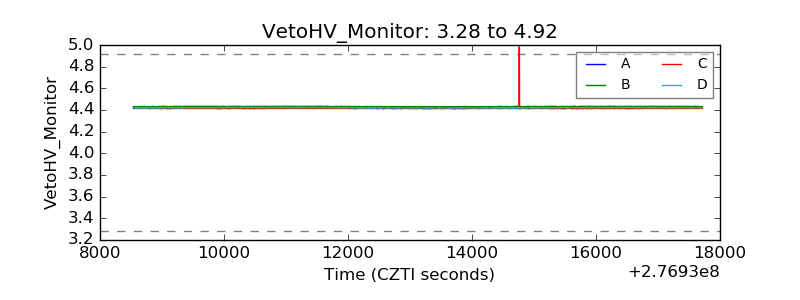 |
| Veto LLD | 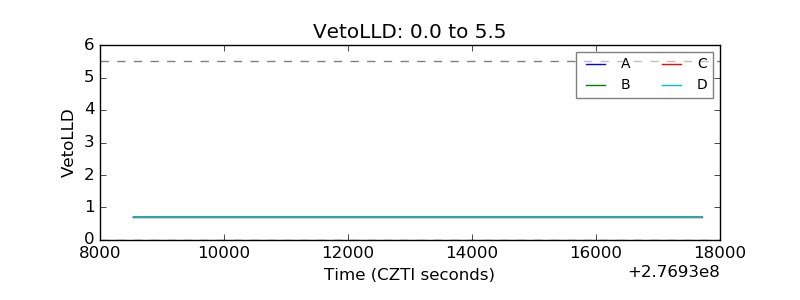 |
| Alpha Counter | 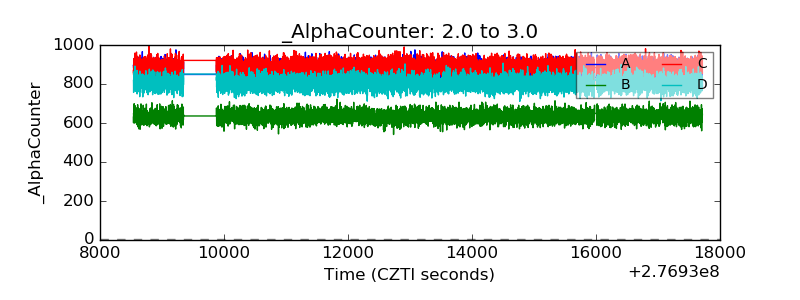 |
| _CPM_Rate | 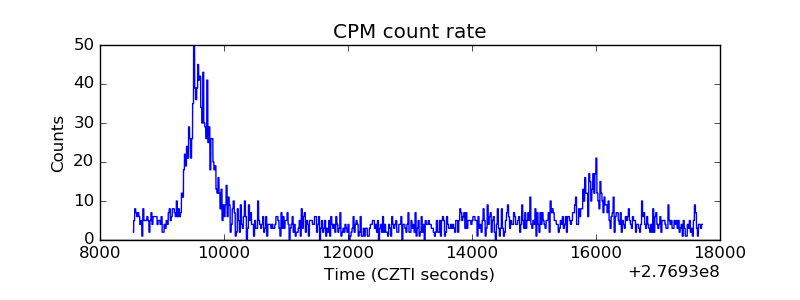 |
| CZT Counter | 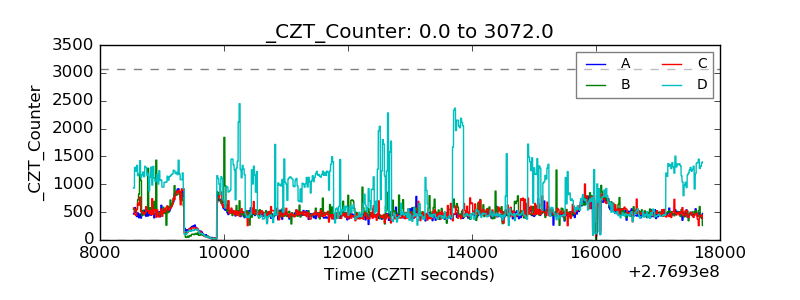 |
| +2.5 Volts monitor |  |
| +5 Volts monitor |  |
| _ROLL_ROT | 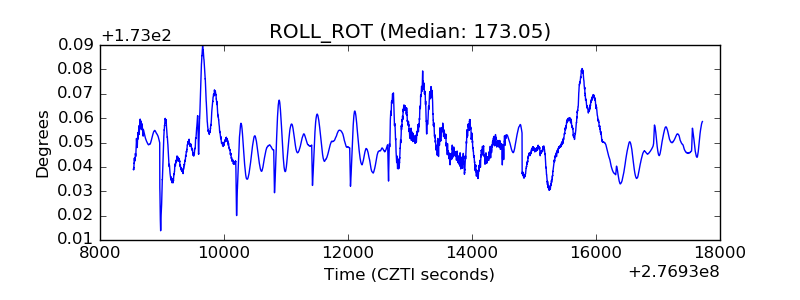 |
| _Roll_DEC | 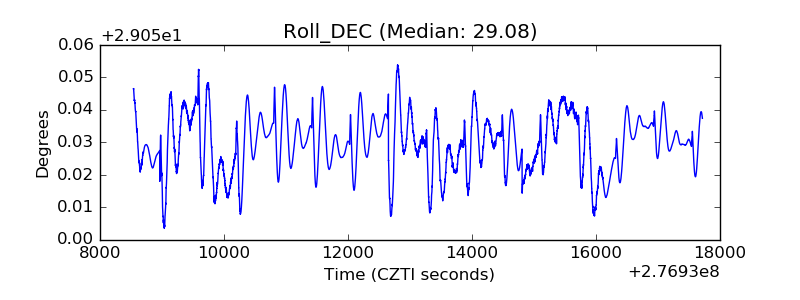 |
| _Roll_RA | 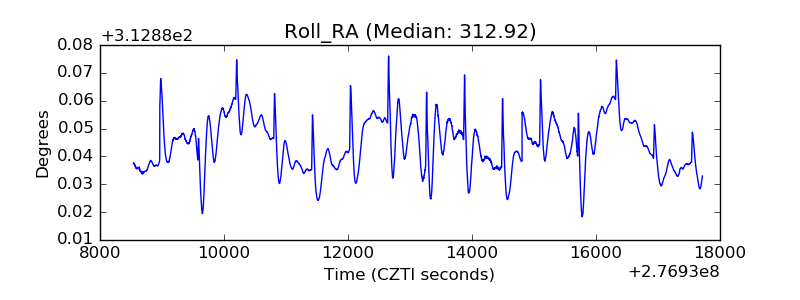 |
| Veto Counter | 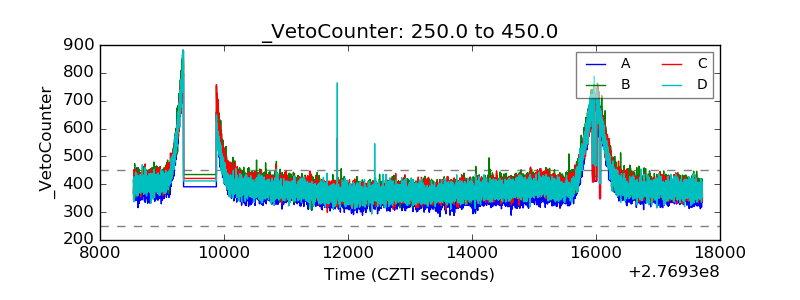 |