| Param | Original file | Final file |
|---|---|---|
| Filename | modeM0/AS1A05_069T01_9000002424_16422cztM0_level2.evt | modeM0/AS1A05_069T01_9000002424_16422cztM0_level2_quad_clean.evt |
| Size (bytes) | 230,149,440 | 57,470,400 |
| Size | 219.5 MB | 54.8 MB |
| Events in quadrant A | 1,627,192 | 378,450 |
| Events in quadrant B | 1,828,992 | 383,768 |
| Events in quadrant C | 1,652,727 | 365,963 |
| Events in quadrant D | 1,616,552 | 359,063 |
| Mode M0 | |||
|---|---|---|---|
| Quadrant | BADHDUFLAG | Total packets | Discarded packets |
| A | 0 | 7291 | 0 |
| B | 0 | 7735 | 0 |
| C | 0 | 7227 | 0 |
| D | 0 | 7273 | 0 |
| Mode SS | |||
|---|---|---|---|
| Quadrant | BADHDUFLAG | Total packets | Discarded packets |
| A | 0 | 72 | 0 |
| B | 0 | 72 | 0 |
| C | 0 | 72 | 0 |
| D | 0 | 72 | 0 |
| Quadrant | Total seconds | Saturated seconds | Saturation percentage |
|---|---|---|---|
| A | 3568 | 7 | 0.196188% |
| B | 3568 | 16 | 0.448430% |
| C | 3568 | 14 | 0.392377% |
| D | 3568 | 1 | 0.028027% |
Noise dominated data is calculated using 1-second bins in cleaned event files. If a bin has >2000 counts, and if more than 50% of those come from <1% of pixels, then it is considered to be noise-dominated and hence unusable.
| Quadrant | # 1 sec bins | Bins with >0 counts | Bins with >2000 counts | High rate bins dominated by noise | Noise dominated (total time) | Noise dominated (detector-on time) | Marked lightcurve |
|---|---|---|---|---|---|---|---|
| A | 3569 | 3569 | 1 | 1 | 0.03% | 0.03% | 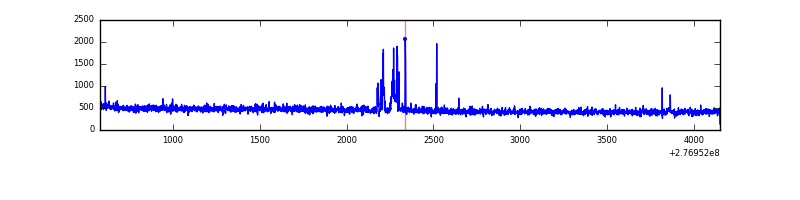 |
| B | 3569 | 3569 | 9 | 9 | 0.25% | 0.25% | 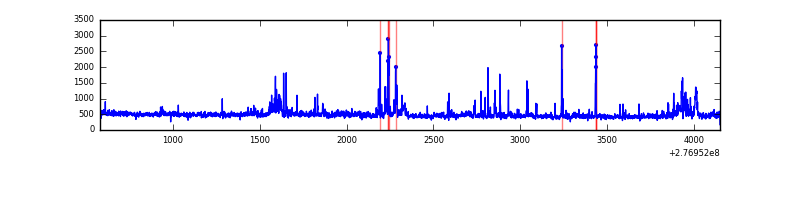 |
| C | 3569 | 3569 | 2 | 2 | 0.06% | 0.06% | 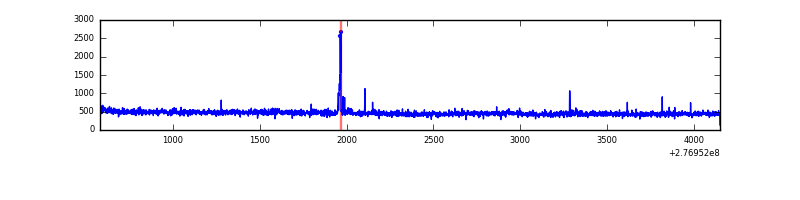 |
| D | 3569 | 3569 | 2 | 2 | 0.06% | 0.06% | 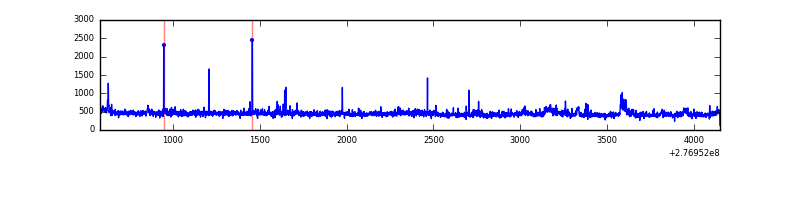 |
Top three noisy pixels from each quadrant. If the there are fewer than three noisy pixels in the level2.evt file, extra rows are filled as -1
| Pixel properties | Quadrant properties | ||||||
|---|---|---|---|---|---|---|---|
| Quadrant | DetID | PixID | Counts | Sigma | Mean | Median | Sigma |
| A | 15 | 174 | 47275 | 555.79 | 409 | 401 | 84.3 |
| A | 15 | 223 | 4736 | 51.4 | 409 | 401 | 84.3 |
| A | 0 | 226 | 3633 | 38.32 | 409 | 401 | 84.3 |
| B | 0 | 244 | 62216 | 771.72 | 406 | 396 | 80.1 |
| B | 15 | 35 | 58643 | 727.12 | 406 | 396 | 80.1 |
| B | 0 | 198 | 54382 | 673.92 | 406 | 396 | 80.1 |
| C | 14 | 238 | 59464 | 638.18 | 389 | 391 | 92.6 |
| C | 3 | 233 | 38789 | 414.82 | 389 | 391 | 92.6 |
| C | 0 | 207 | 23341 | 247.93 | 389 | 391 | 92.6 |
| D | 1 | 52 | 34320 | 346.8 | 397 | 384 | 97.9 |
| D | 1 | 20 | 29811 | 300.72 | 397 | 384 | 97.9 |
| D | 2 | 234 | 15133 | 150.72 | 397 | 384 | 97.9 |
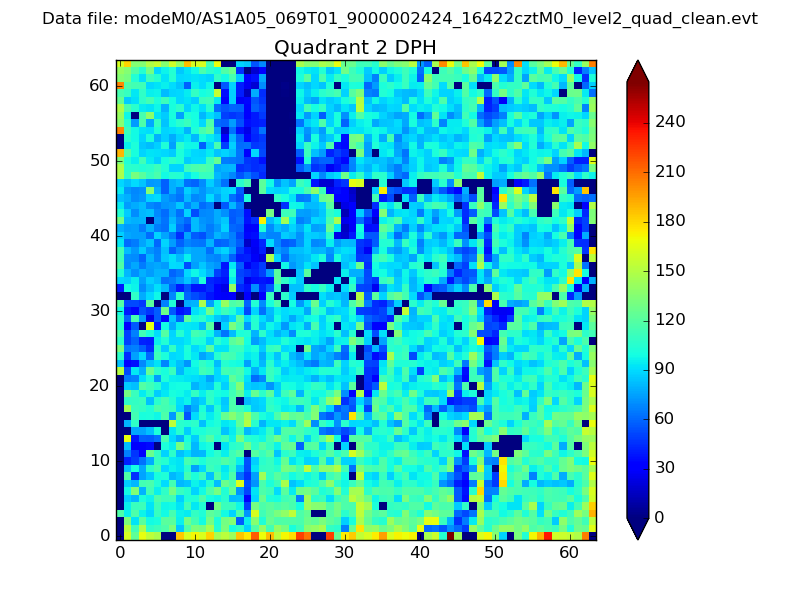
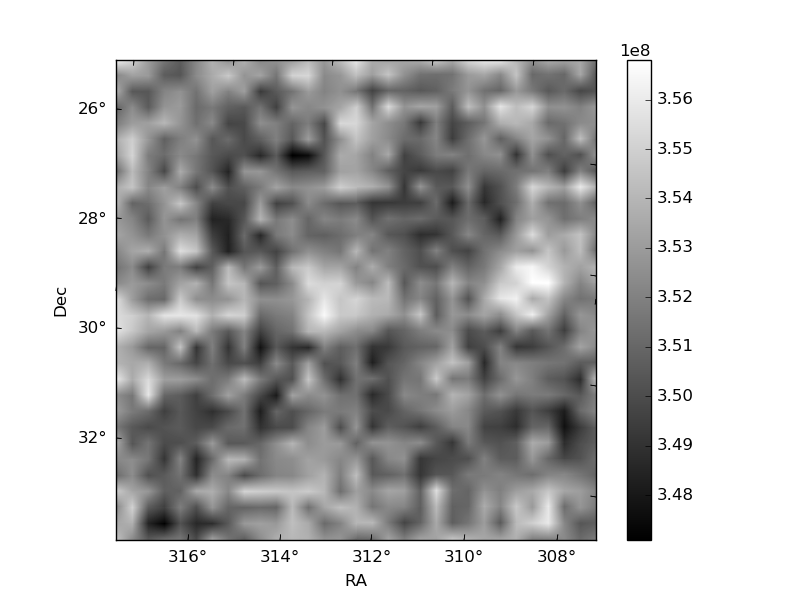
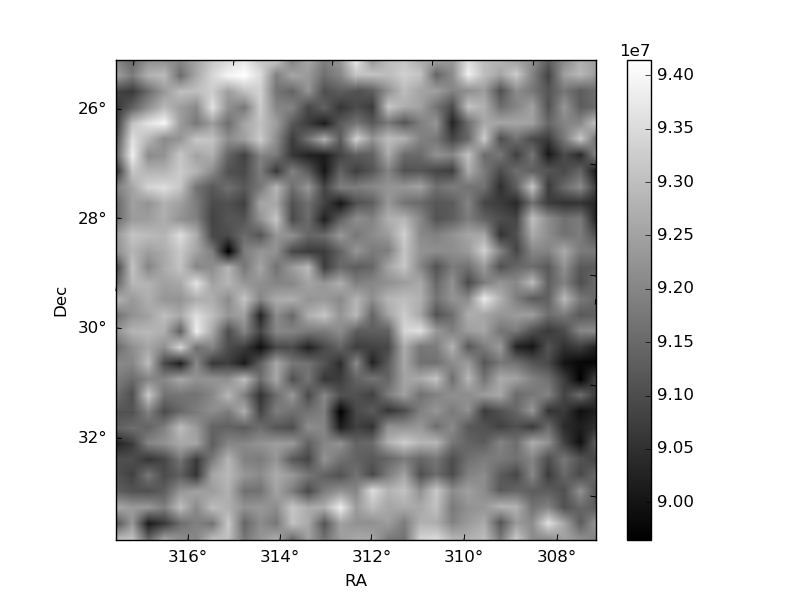
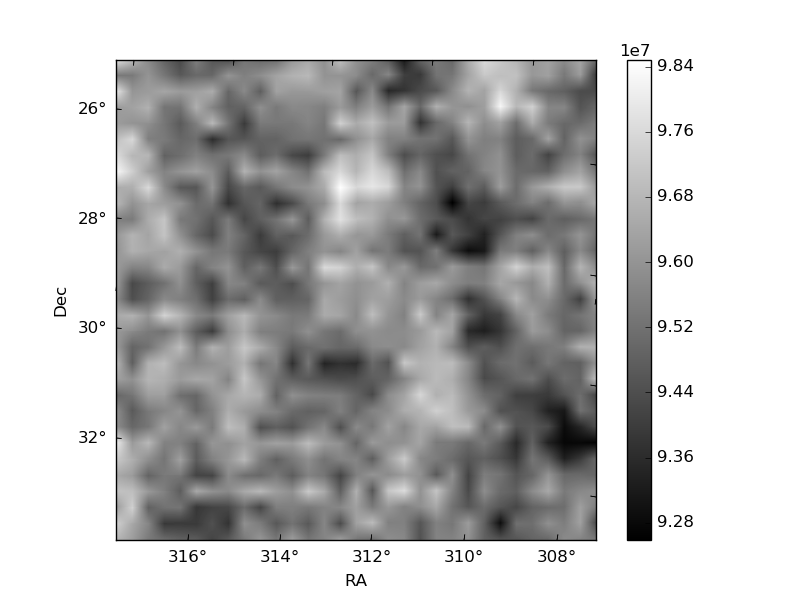
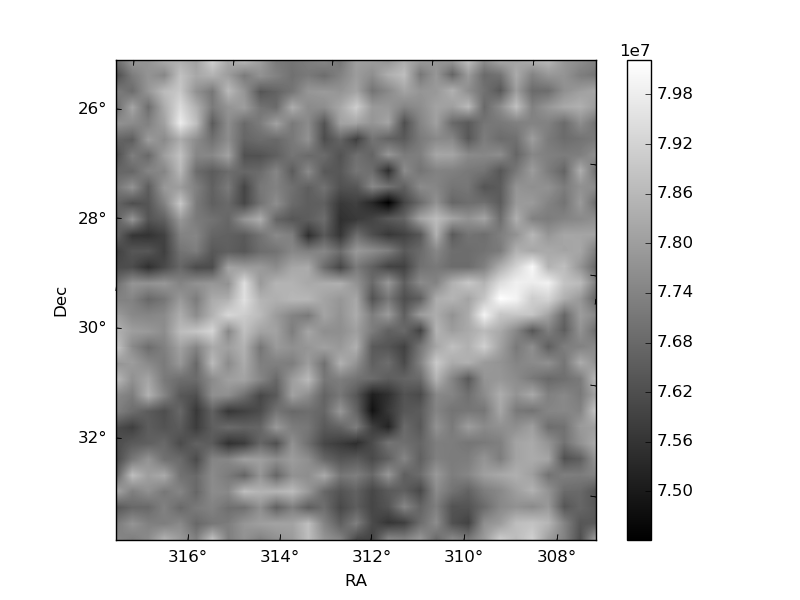
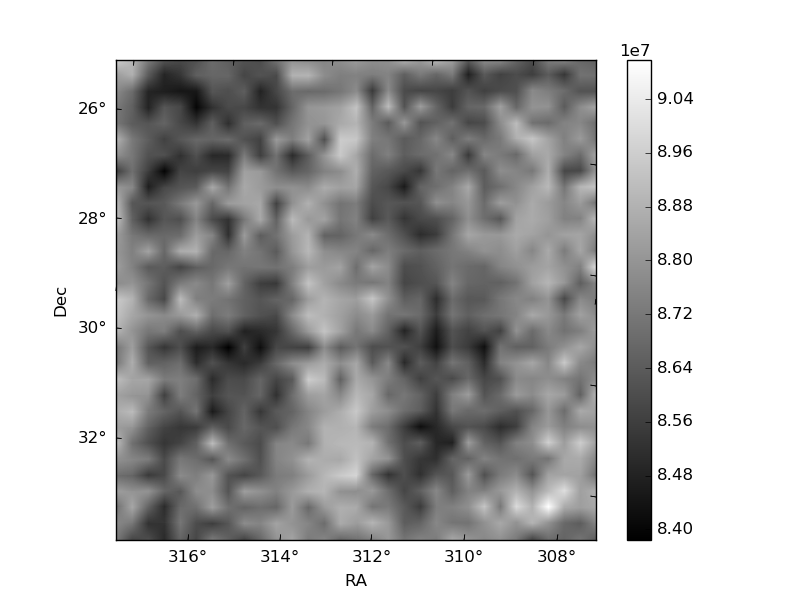
Histogram calculated using DETX and DETY for each event in the final _common_clean file
| Quadrant A | 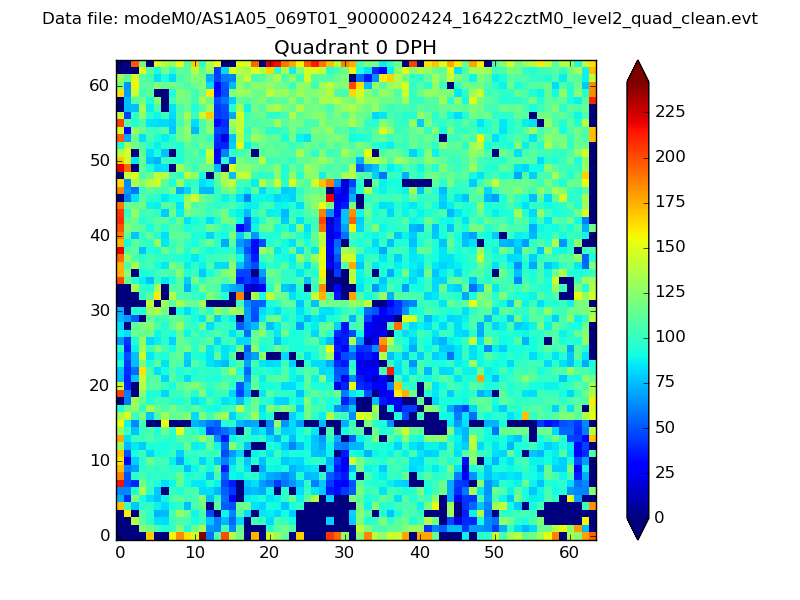 |
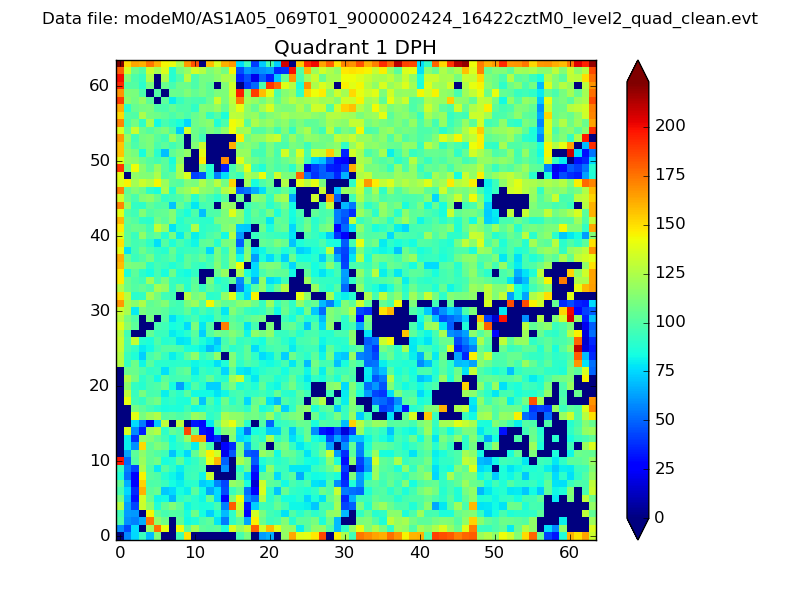 |
Quadrant B |
|---|---|---|---|
| Quadrant D | 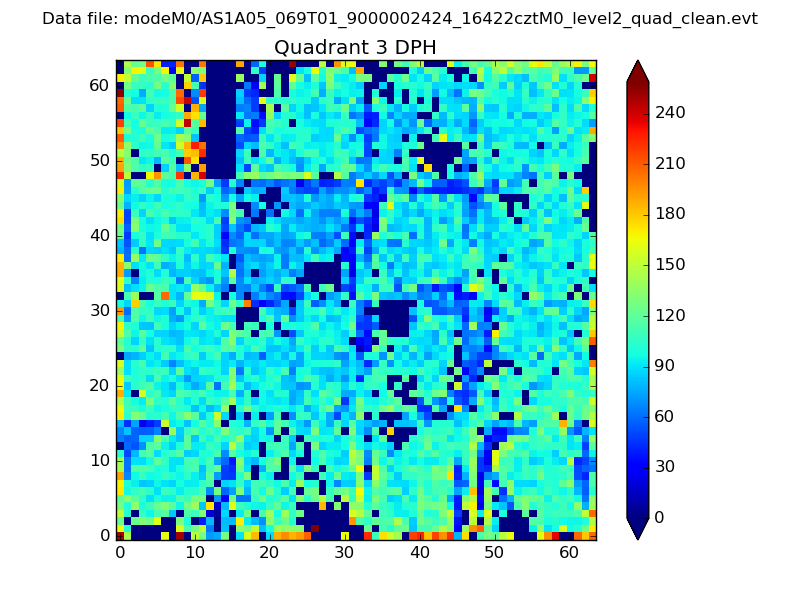 |
 |
Quadrant C |
| Plot type | Count rate plots | Images |
|---|---|---|
| Comparison with Poisson distribution Blue bars denote a histogram of data divided into 1 sec bins. Red curve is a Poisson curve with rate = median count rate of data. |
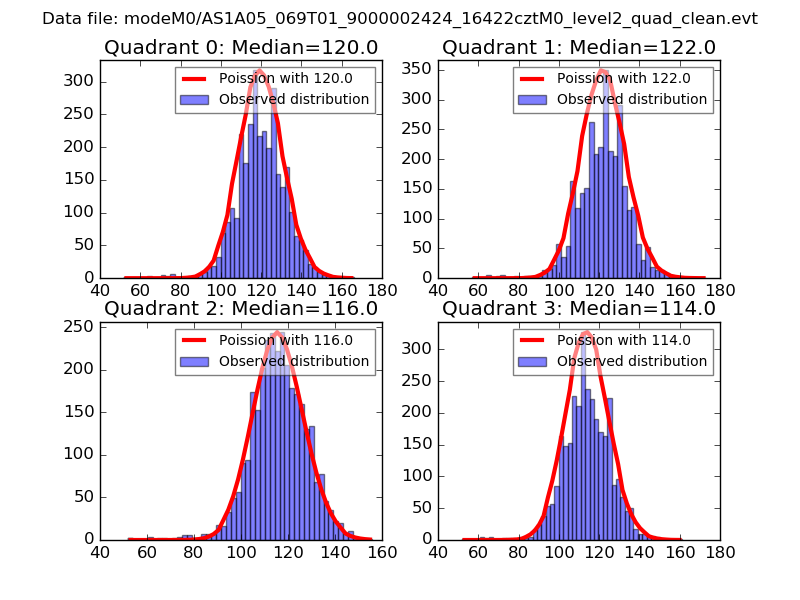 |
 |
| Quadrant-wise count rates Data is divided into 100 sec bins |
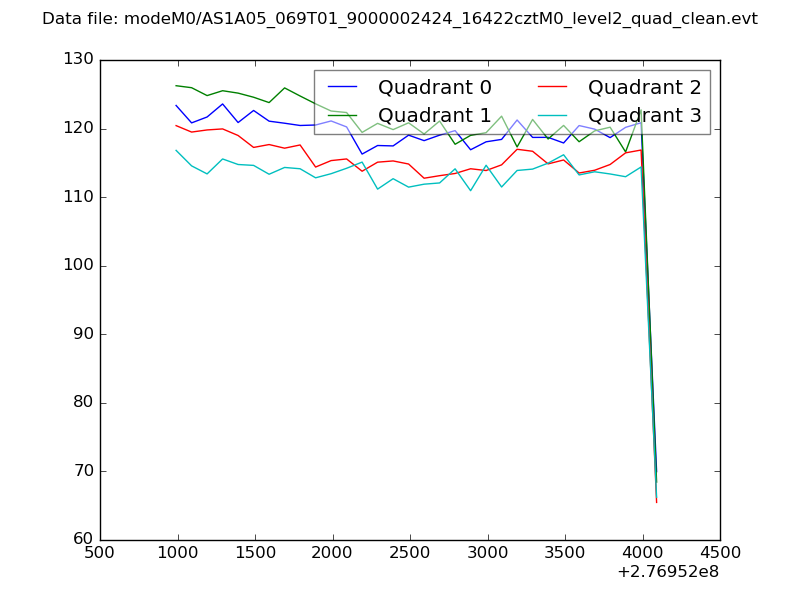 |
|
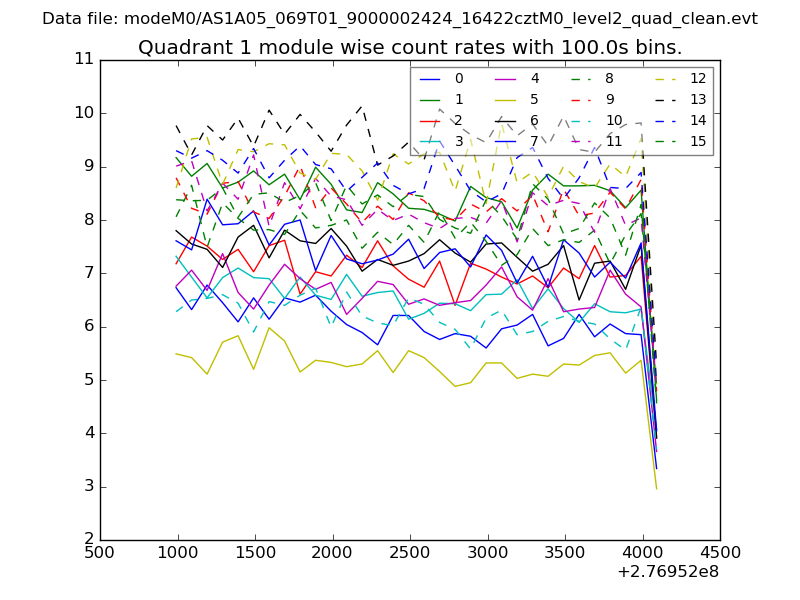
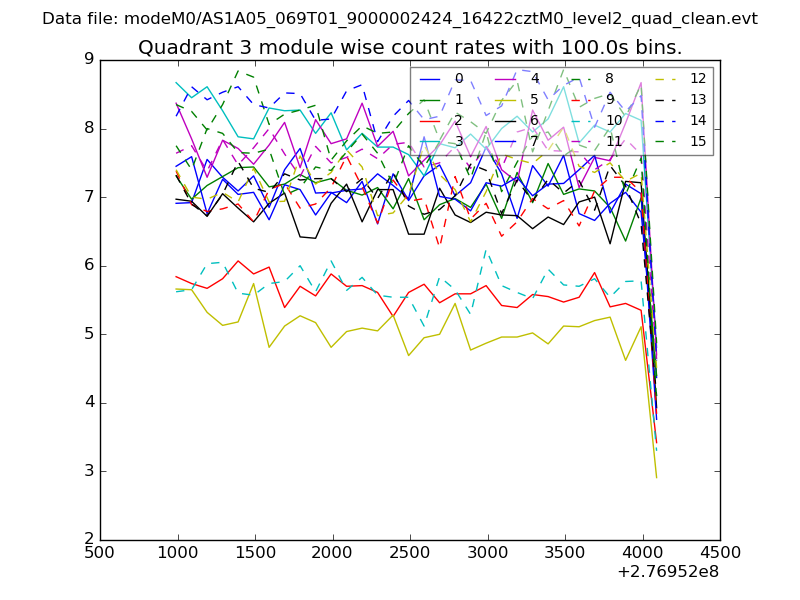
| Module-wise count rates for Quadrant A Data is divided into 100 sec bins |
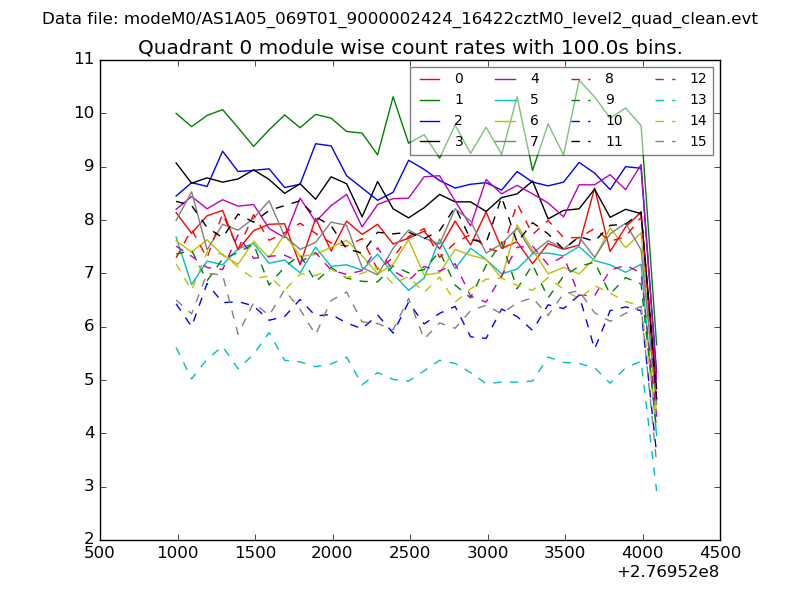 |
 |
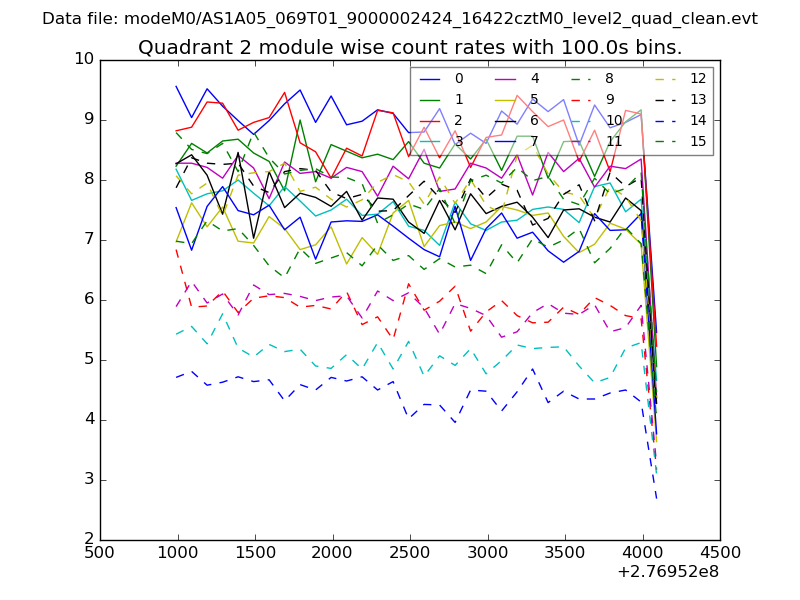
| Module-wise count rates for Quadrant B Data is divided into 100 sec bins |
 |
 |
| Module-wise count rates for Quadrant C Data is divided into 100 sec bins |
 |
 |
| Module-wise count rates for Quadrant D Data is divided into 100 sec bins |
 |
 |
| Parameter | Plot |
|---|---|
| CZT HV Monitor | 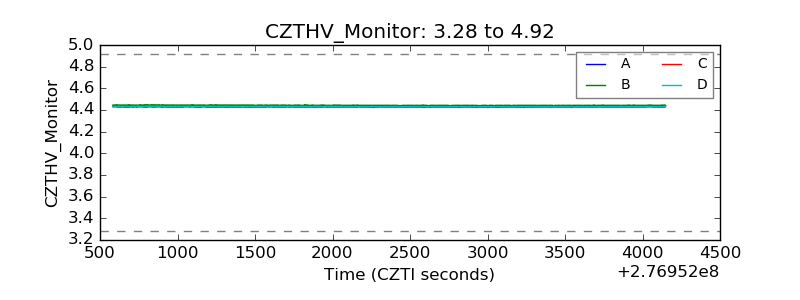 |
| D_VDD | 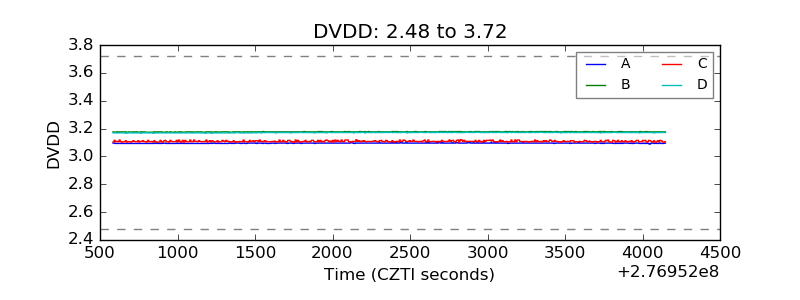 |
| Temperature 1 | 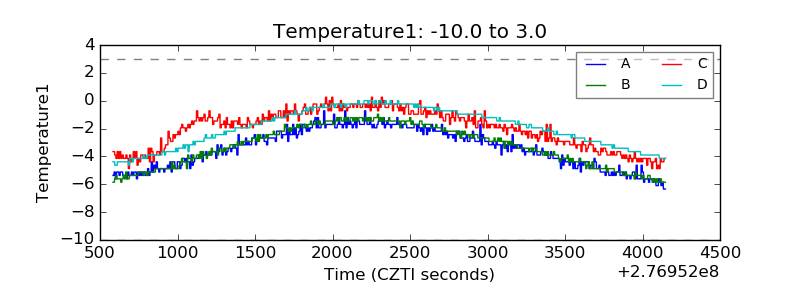 |
| Veto HV Monitor | 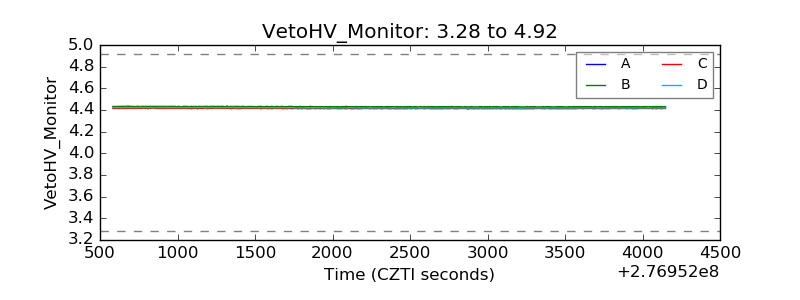 |
| Veto LLD | 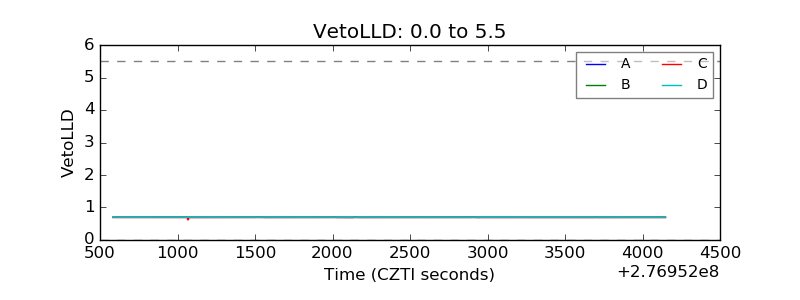 |
| Alpha Counter | 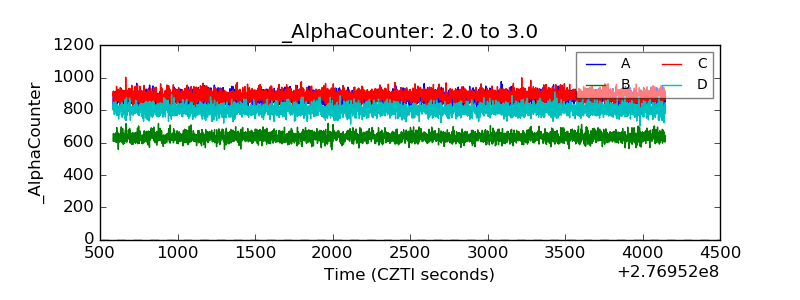 |
| _CPM_Rate | 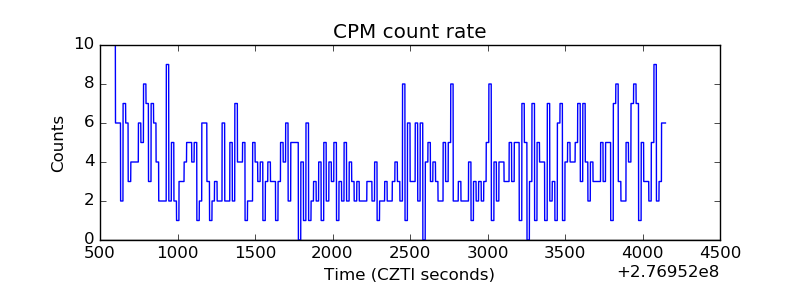 |
| CZT Counter | 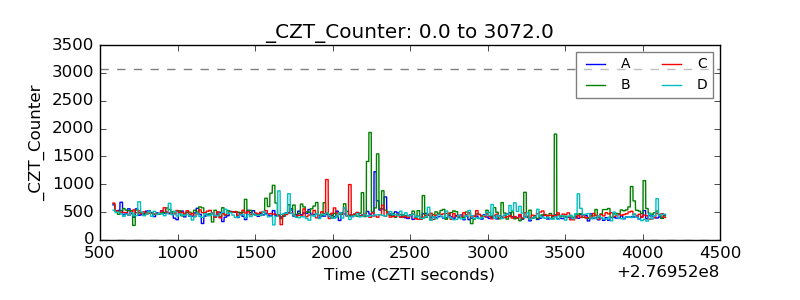 |
| +2.5 Volts monitor |  |
| +5 Volts monitor |  |
| _ROLL_ROT | 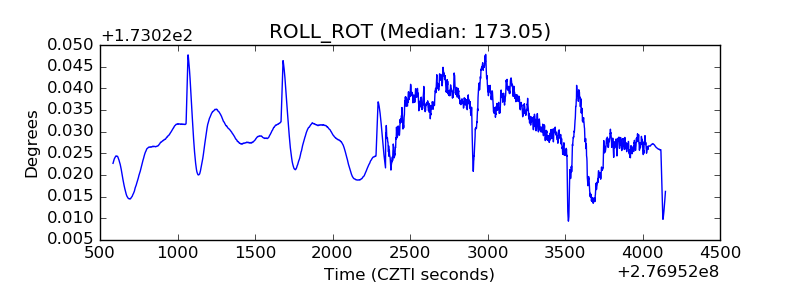 |
| _Roll_DEC | 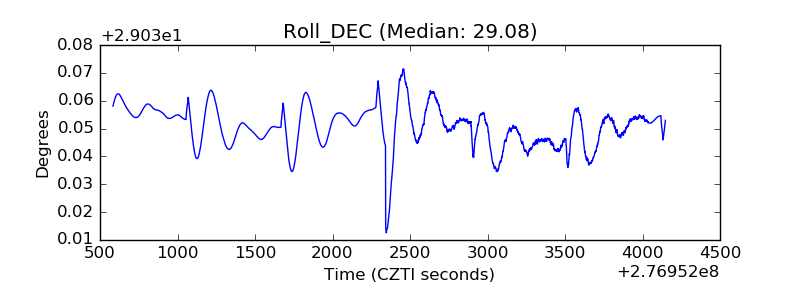 |
| _Roll_RA | 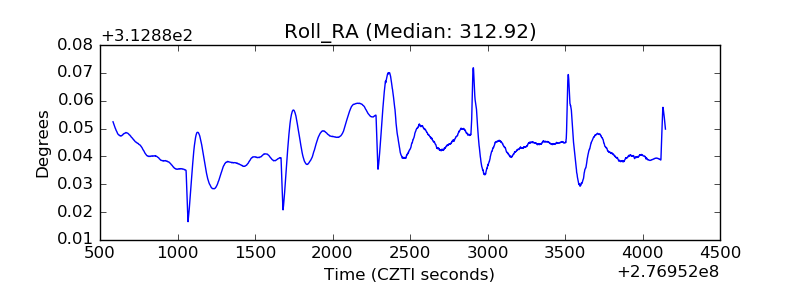 |
| Veto Counter | 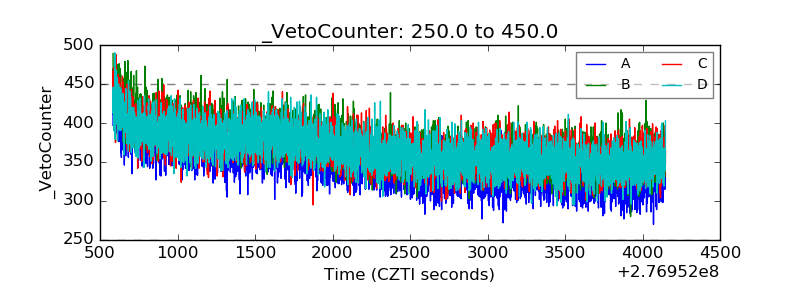 |