| Param | Original file | Final file |
|---|---|---|
| Filename | modeM0/AS1A05_069T03_9000002426cztM0_level2.fits | modeM0/AS1A05_069T03_9000002426cztM0_level2_quad_clean.evt |
| Size (bytes) | 665,308,800 | 580,032,000 |
| Size | 634.5 MB | 553.2 MB |
| Events in quadrant A | 4,067,010 | 3,341,425 |
| Events in quadrant B | 3,923,276 | 3,389,611 |
| Events in quadrant C | 3,968,510 | 3,184,644 |
| Events in quadrant D | 3,426,666 | 2,887,221 |
| Mode SS | |||
|---|---|---|---|
| Quadrant | BADHDUFLAG | Total packets | Discarded packets |
| A | 0 | 1416 | 0 |
| B | 0 | 1416 | 0 |
| C | 0 | 1416 | 0 |
| D | 0 | 1416 | 0 |
| Mode M0 | |||
|---|---|---|---|
| Quadrant | BADHDUFLAG | Total packets | Discarded packets |
| A | 0 | 147914 | 0 |
| B | 0 | 156469 | 0 |
| C | 0 | 147981 | 0 |
| D | 0 | 156350 | 0 |
| Mode M9 | |||
|---|---|---|---|
| Quadrant | BADHDUFLAG | Total packets | Discarded packets |
| A | 0 | 112 | 0 |
| B | 0 | 112 | 0 |
| C | 0 | 112 | 0 |
| D | 0 | 112 | 0 |
| Quadrant | Total seconds | Saturated seconds | Saturation percentage |
|---|---|---|---|
| A | 69448 | 1379 | 1.985658% |
| B | 69448 | 1408 | 2.027416% |
| C | 69448 | 1316 | 1.894943% |
| D | 69448 | 1407 | 2.025976% |
Noise dominated data is calculated using 1-second bins in cleaned event files. If a bin has >2000 counts, and if more than 50% of those come from <1% of pixels, then it is considered to be noise-dominated and hence unusable.
| Quadrant | # 1 sec bins | Bins with >0 counts | Bins with >2000 counts | High rate bins dominated by noise | Noise dominated (total time) | Noise dominated (detector-on time) | Marked lightcurve |
|---|---|---|---|---|---|---|---|
| A | 80698 | 69441 | 0 | 0 | 0.00% | 0.00% | 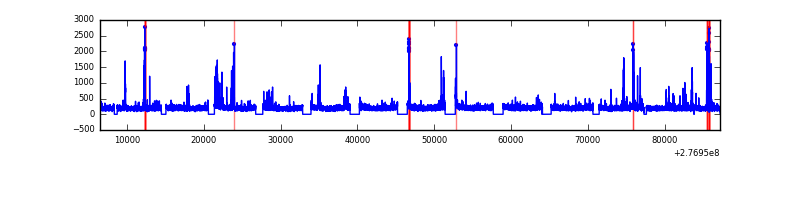 |
| B | 80698 | 69439 | 0 | 0 | 0.00% | 0.00% | 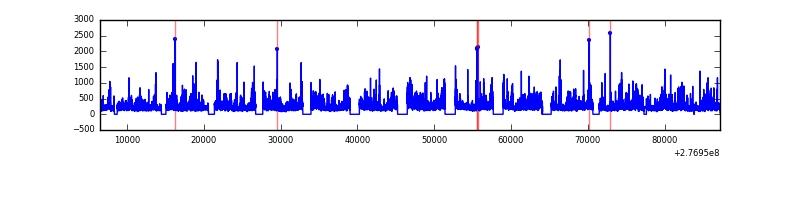 |
| C | 80698 | 69439 | 0 | 0 | 0.00% | 0.00% | 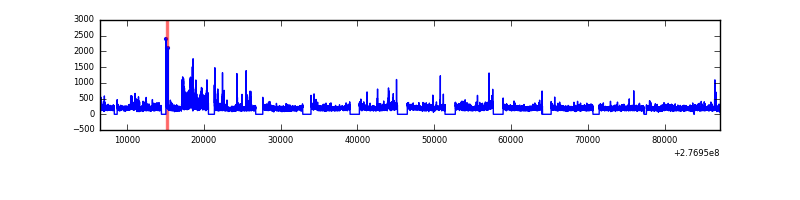 |
| D | 80698 | 69424 | 0 | 0 | 0.00% | 0.00% | 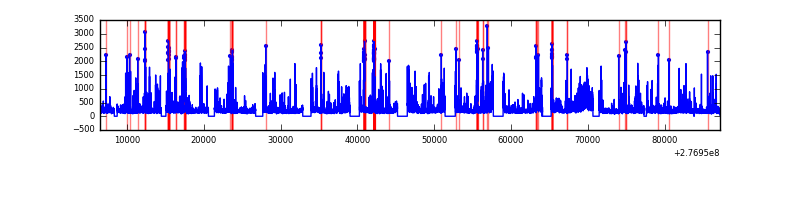 |
Top three noisy pixels from each quadrant. If the there are fewer than three noisy pixels in the level2.evt file, extra rows are filled as -1
| Pixel properties | Quadrant properties | ||||||
|---|---|---|---|---|---|---|---|
| Quadrant | DetID | PixID | Counts | Sigma | Mean | Median | Sigma |
| A | 0 | 29 | 3922 | 11.31 | 1057 | 991 | 259.2 |
| A | 7 | 110 | 3327 | 9.01 | 1057 | 991 | 259.2 |
| A | 0 | 30 | 3115 | 8.19 | 1057 | 991 | 259.2 |
| B | 2 | 9 | 3176 | 10.62 | 1039 | 991 | 205.7 |
| B | 2 | 8 | 2692 | 8.27 | 1039 | 991 | 205.7 |
| B | 3 | 17 | 2647 | 8.05 | 1039 | 991 | 205.7 |
| C | 1 | 80 | 2954 | 7.32 | 1047 | 973 | 270.8 |
| C | 1 | 81 | 2863 | 6.98 | 1047 | 973 | 270.8 |
| C | 12 | 241 | 2809 | 6.78 | 1047 | 973 | 270.8 |
| D | 3 | 14 | 2571 | 6.38 | 980 | 890 | 263.6 |
| D | 6 | 231 | 2442 | 5.89 | 980 | 890 | 263.6 |
| D | 10 | 189 | 2384 | 5.67 | 980 | 890 | 263.6 |
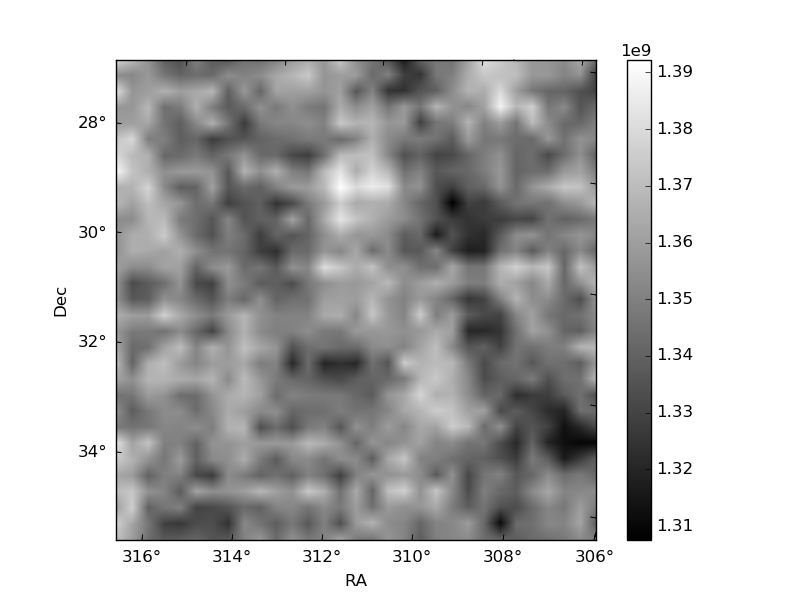
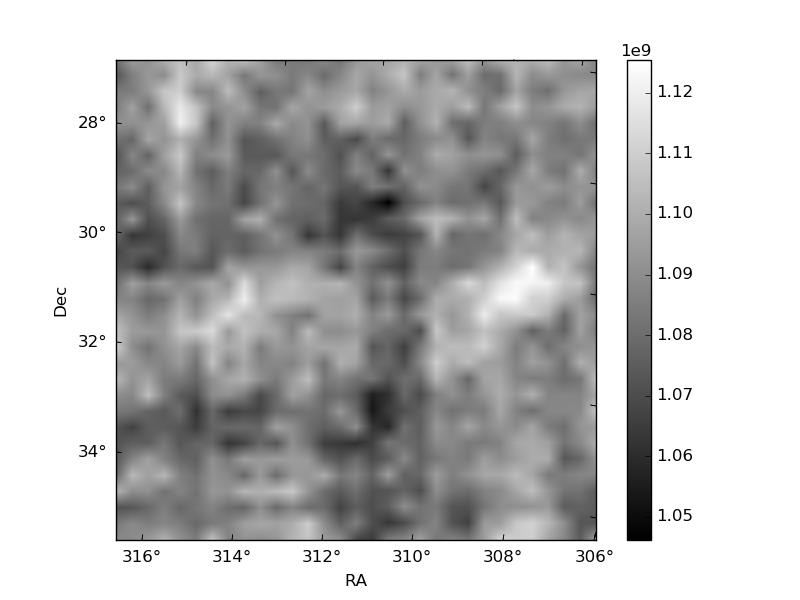
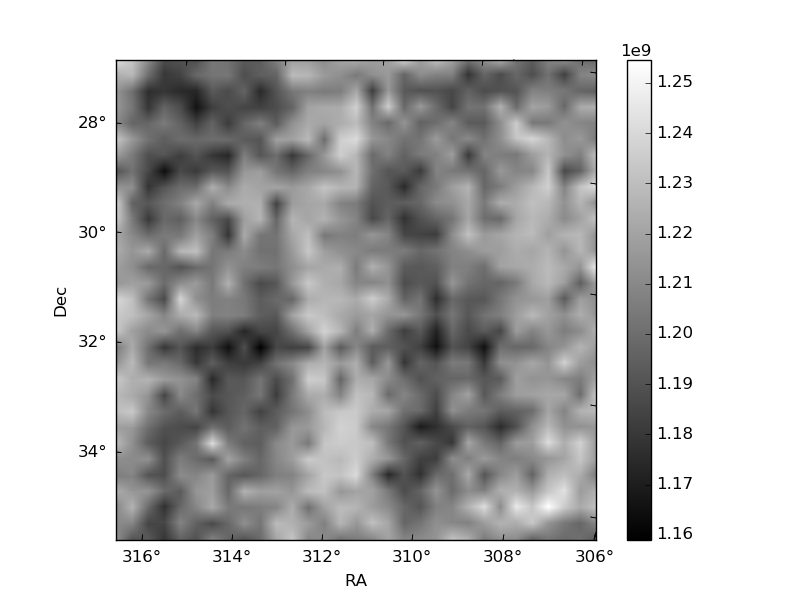
Histogram calculated using DETX and DETY for each event in the final _common_clean file
| Quadrant A | 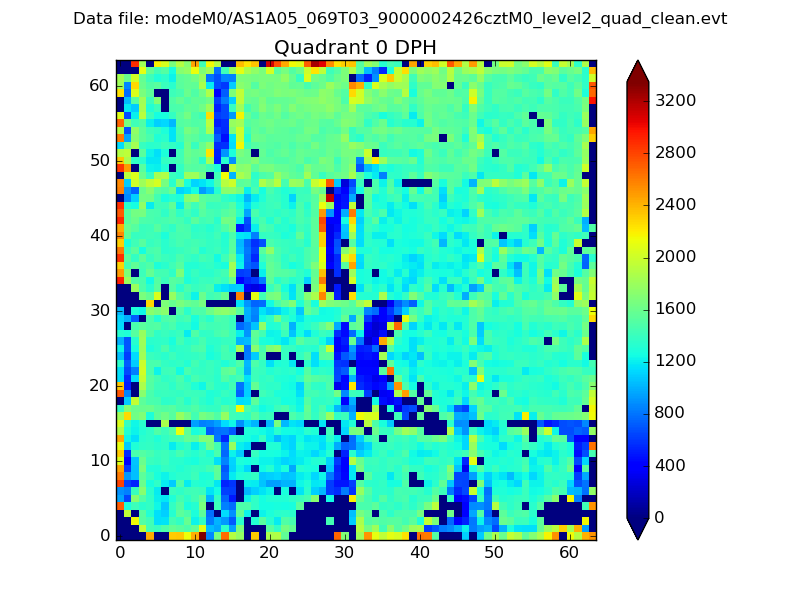 |
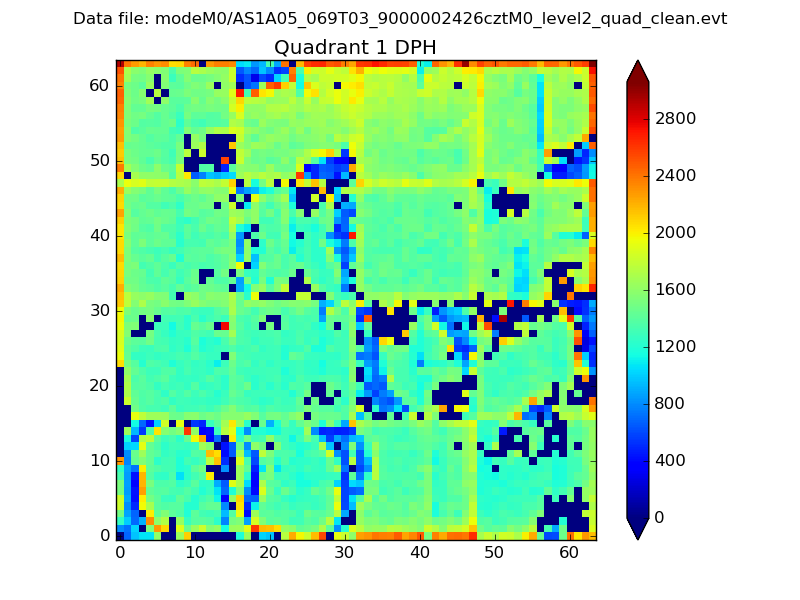 |
Quadrant B |
|---|---|---|---|
| Quadrant D | 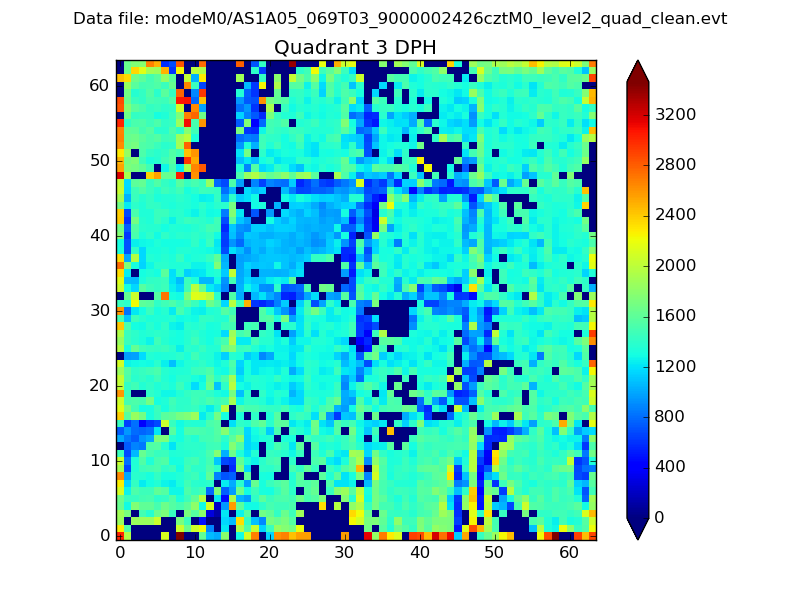 |
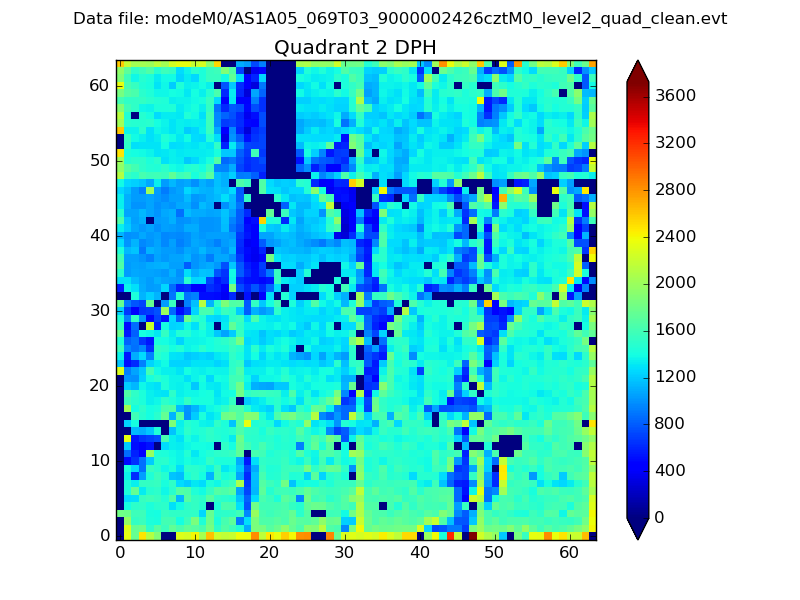 |
Quadrant C |
| Plot type | Count rate plots | Images |
|---|---|---|
| Comparison with Poisson distribution Blue bars denote a histogram of data divided into 1 sec bins. Red curve is a Poisson curve with rate = median count rate of data. |
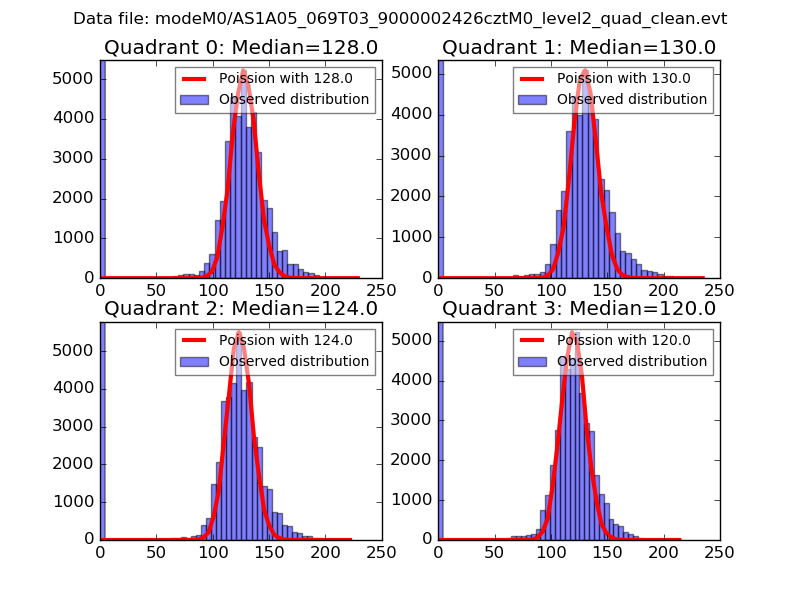 |
 |
| Quadrant-wise count rates Data is divided into 100 sec bins |
 |
|
| Module-wise count rates for Quadrant A Data is divided into 100 sec bins |
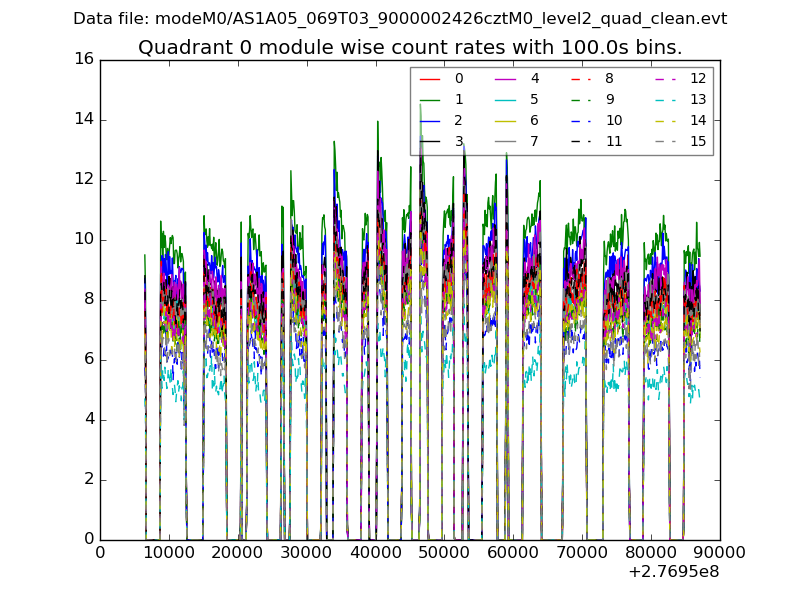 |
 |
| Module-wise count rates for Quadrant B Data is divided into 100 sec bins |
 |
 |
| Module-wise count rates for Quadrant C Data is divided into 100 sec bins |
 |
 |
| Module-wise count rates for Quadrant D Data is divided into 100 sec bins |
 |
 |
| Parameter | Plot |
|---|---|
| CZT HV Monitor |  |
| D_VDD | 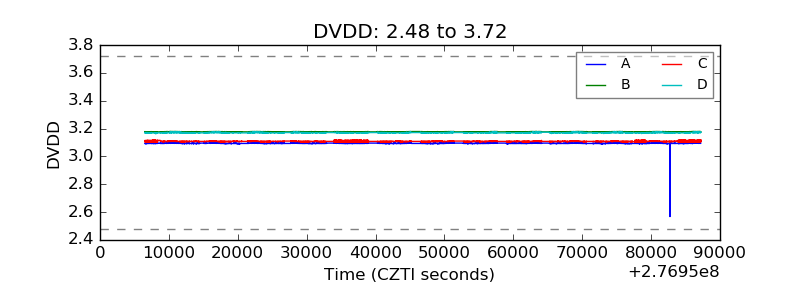 |
| Temperature 1 | 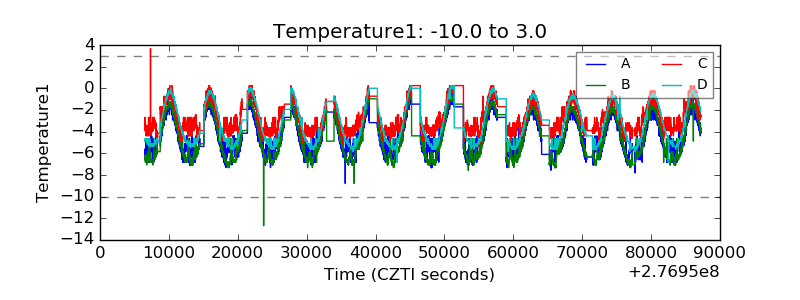 |
| Veto HV Monitor | 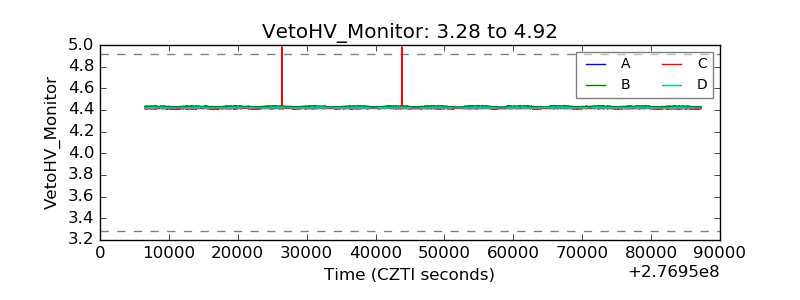 |
| Veto LLD | 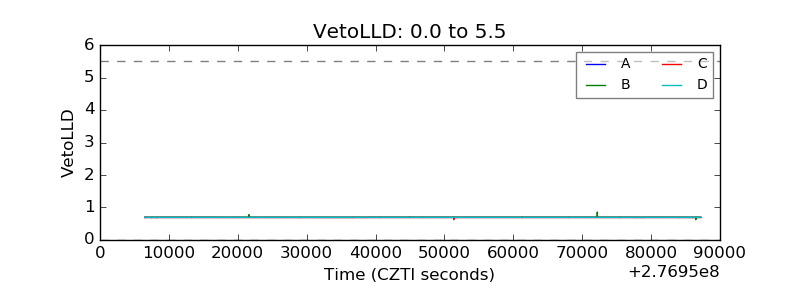 |
| Alpha Counter |  |
| _CPM_Rate | 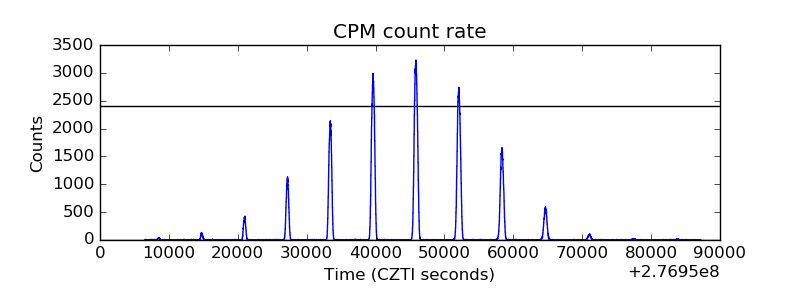 |
| CZT Counter | 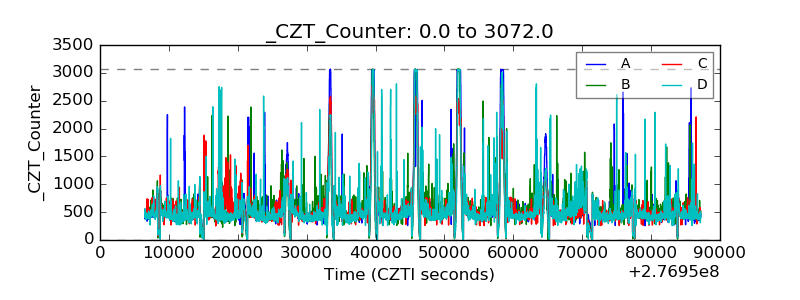 |
| +2.5 Volts monitor | 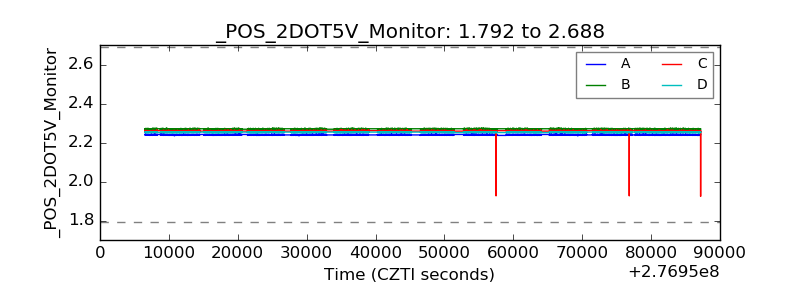 |
| +5 Volts monitor | 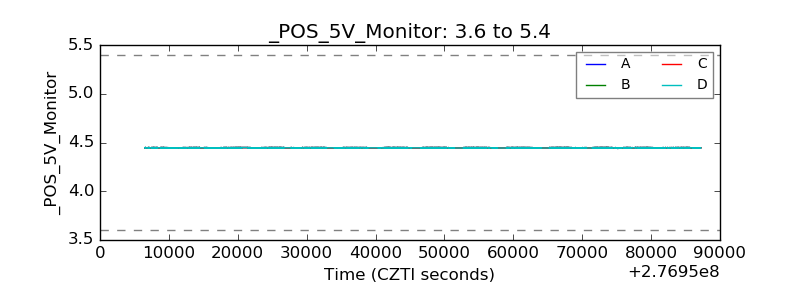 |
| _ROLL_ROT | 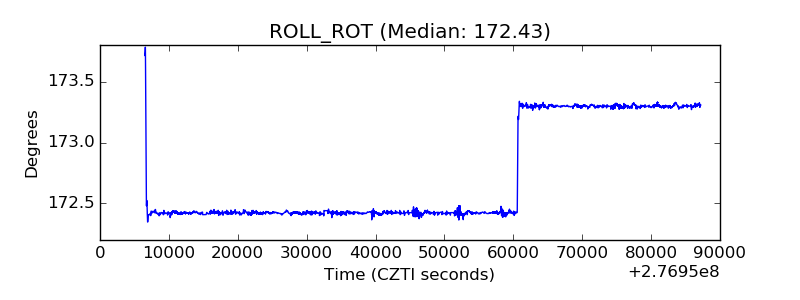 |
| _Roll_DEC | 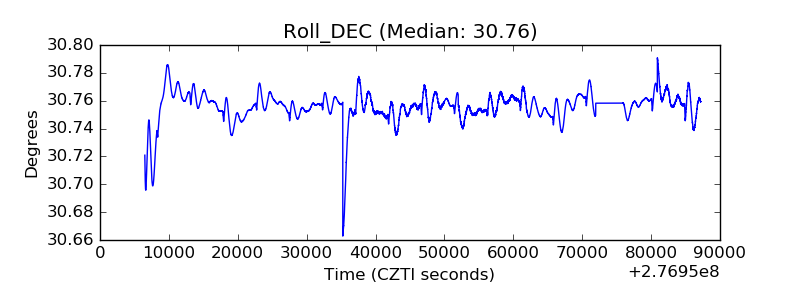 |
| _Roll_RA | 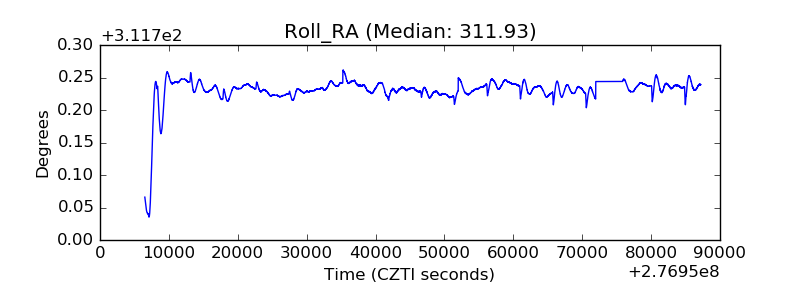 |
| Veto Counter | 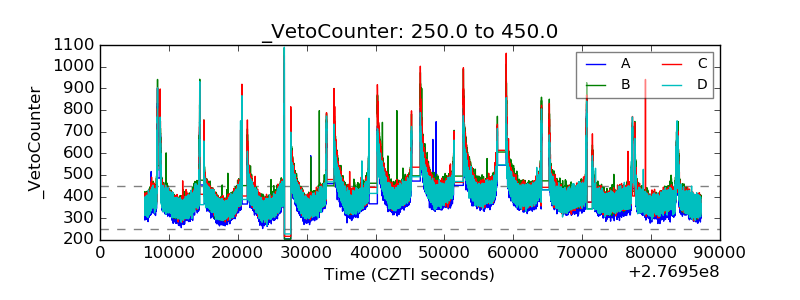 |