| Param | Original file | Final file |
|---|---|---|
| Filename | modeM0/AS1A05_069T03_9000002426_16423cztM0_level2.evt | modeM0/AS1A05_069T03_9000002426_16423cztM0_level2_quad_clean.evt |
| Size (bytes) | 470,393,280 | 89,409,600 |
| Size | 448.6 MB | 85.3 MB |
| Events in quadrant A | 3,703,591 | 566,377 |
| Events in quadrant B | 3,625,613 | 580,912 |
| Events in quadrant C | 3,273,845 | 555,365 |
| Events in quadrant D | 3,192,384 | 542,565 |
| Mode SS | |||
|---|---|---|---|
| Quadrant | BADHDUFLAG | Total packets | Discarded packets |
| A | 0 | 136 | 0 |
| B | 0 | 136 | 0 |
| C | 0 | 136 | 0 |
| D | 0 | 136 | 0 |
| Mode M0 | |||
|---|---|---|---|
| Quadrant | BADHDUFLAG | Total packets | Discarded packets |
| A | 0 | 15375 | 3 |
| B | 0 | 15128 | 2 |
| C | 0 | 14045 | 2 |
| D | 0 | 14124 | 2 |
| Mode M9 | |||
|---|---|---|---|
| Quadrant | BADHDUFLAG | Total packets | Discarded packets |
| A | 0 | 9 | 0 |
| B | 0 | 9 | 0 |
| C | 0 | 9 | 0 |
| D | 0 | 9 | 0 |
| Quadrant | Total seconds | Saturated seconds | Saturation percentage |
|---|---|---|---|
| A | 6626 | 173 | 2.610927% |
| B | 6626 | 106 | 1.599759% |
| C | 6626 | 96 | 1.448838% |
| D | 6626 | 61 | 0.920616% |
Noise dominated data is calculated using 1-second bins in cleaned event files. If a bin has >2000 counts, and if more than 50% of those come from <1% of pixels, then it is considered to be noise-dominated and hence unusable.
| Quadrant | # 1 sec bins | Bins with >0 counts | Bins with >2000 counts | High rate bins dominated by noise | Noise dominated (total time) | Noise dominated (detector-on time) | Marked lightcurve |
|---|---|---|---|---|---|---|---|
| A | 7557 | 6627 | 65 | 65 | 0.86% | 0.98% | 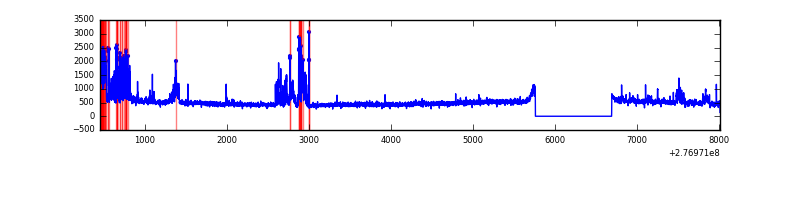 |
| B | 7557 | 6627 | 18 | 18 | 0.24% | 0.27% | 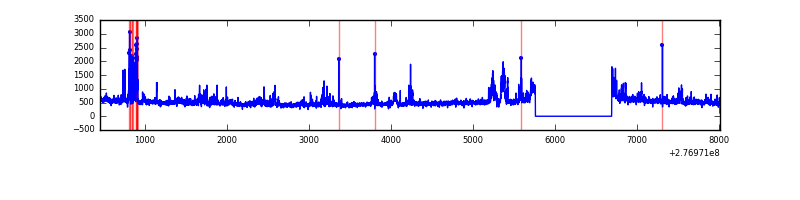 |
| C | 7557 | 6627 | 5 | 5 | 0.07% | 0.08% | 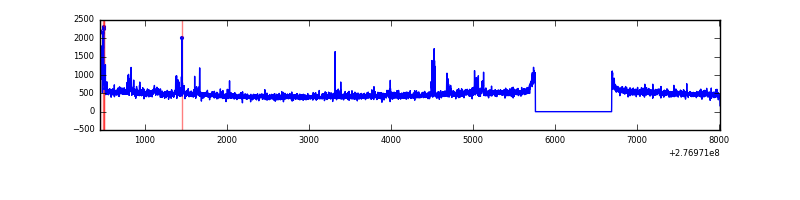 |
| D | 7557 | 6627 | 35 | 35 | 0.46% | 0.53% | 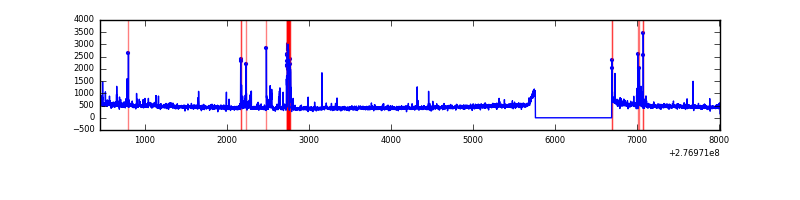 |
Top three noisy pixels from each quadrant. If the there are fewer than three noisy pixels in the level2.evt file, extra rows are filled as -1
| Pixel properties | Quadrant properties | ||||||
|---|---|---|---|---|---|---|---|
| Quadrant | DetID | PixID | Counts | Sigma | Mean | Median | Sigma |
| A | 15 | 174 | 563067 | 3504.42 | 784 | 766 | 160.5 |
| A | 15 | 223 | 79258 | 489.18 | 784 | 766 | 160.5 |
| A | 15 | 239 | 26505 | 160.41 | 784 | 766 | 160.5 |
| B | 15 | 35 | 157088 | 1033.67 | 789 | 766 | 151.2 |
| B | 0 | 244 | 109662 | 720.07 | 789 | 766 | 151.2 |
| B | 0 | 189 | 75369 | 493.31 | 789 | 766 | 151.2 |
| C | 3 | 233 | 149250 | 833.42 | 758 | 761 | 178.2 |
| C | 14 | 238 | 115832 | 645.85 | 758 | 761 | 178.2 |
| C | 3 | 9 | 35953 | 197.52 | 758 | 761 | 178.2 |
| D | 7 | 38 | 99569 | 525.15 | 769 | 744 | 188.2 |
| D | 10 | 70 | 83102 | 437.64 | 769 | 744 | 188.2 |
| D | 12 | 218 | 43041 | 224.76 | 769 | 744 | 188.2 |
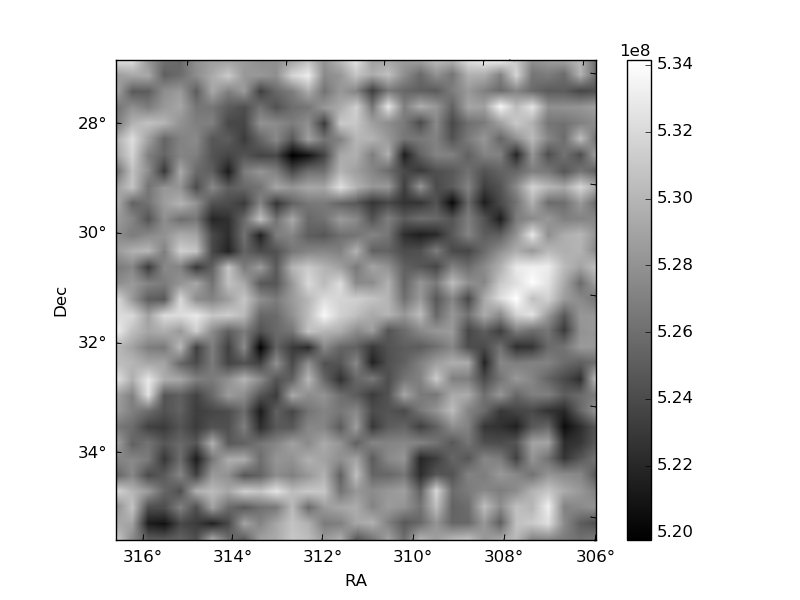
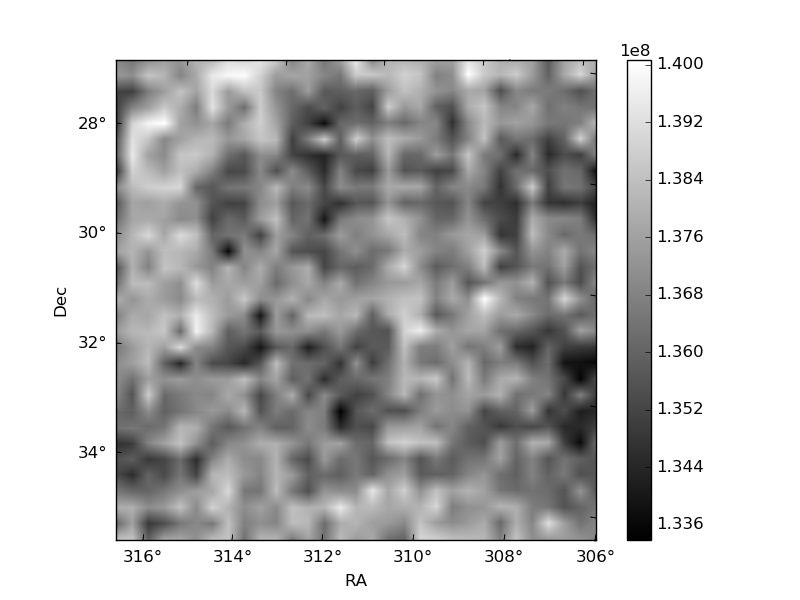
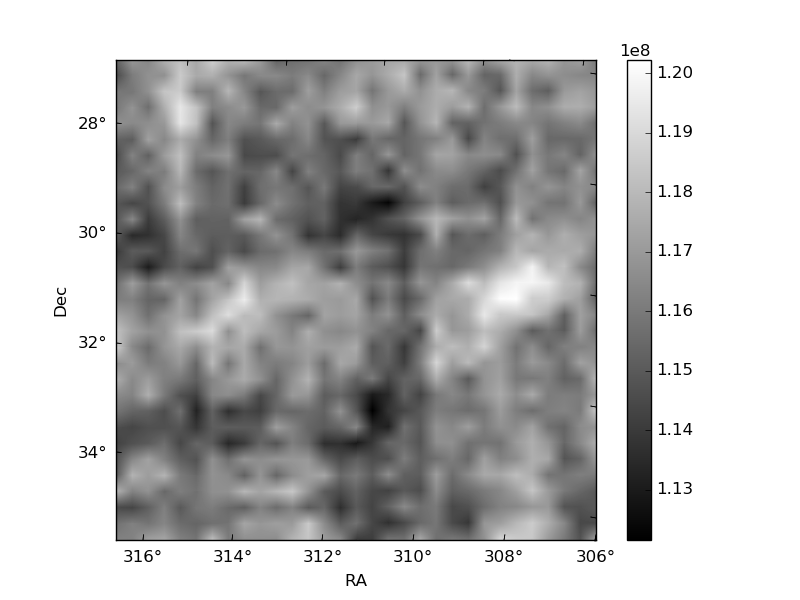
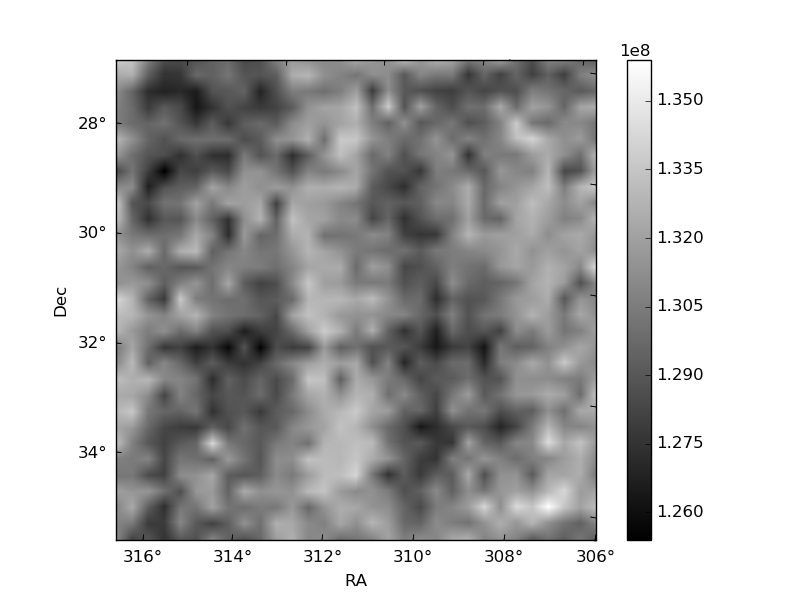
Histogram calculated using DETX and DETY for each event in the final _common_clean file
| Quadrant A | 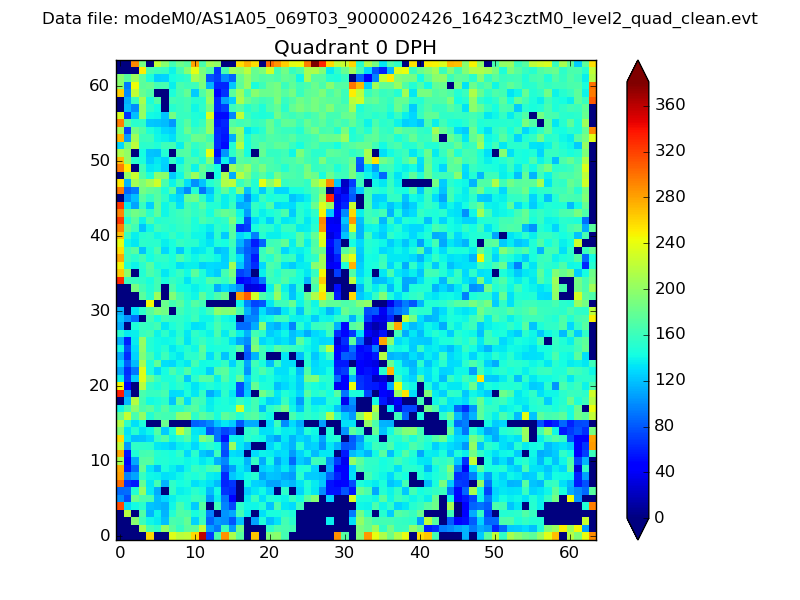 |
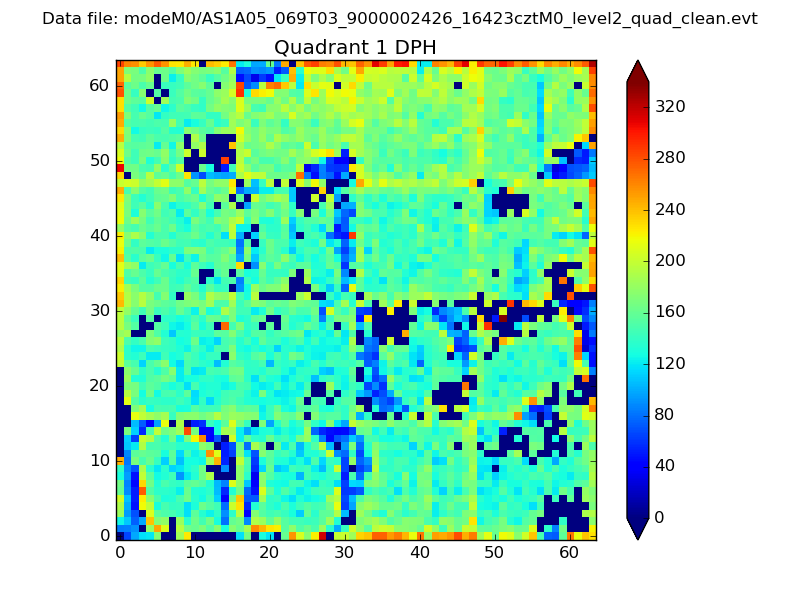 |
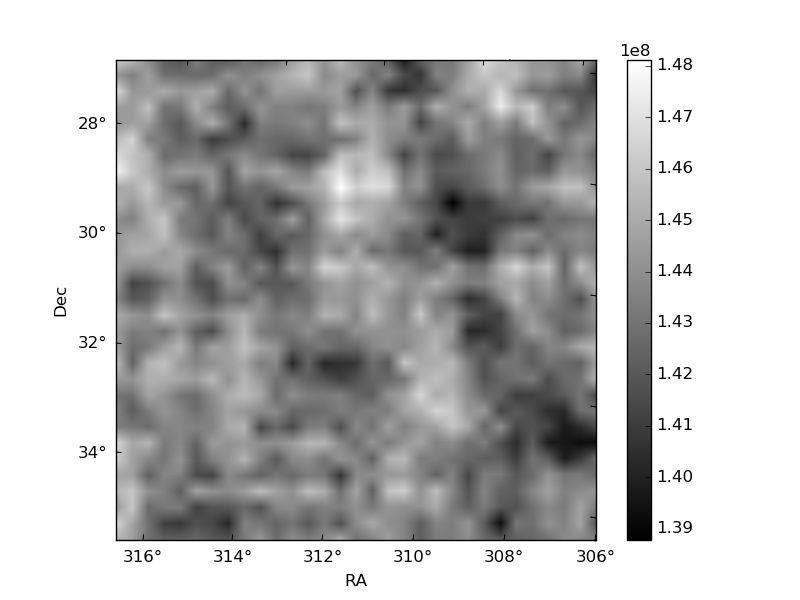
Quadrant B |
|---|---|---|---|
| Quadrant D | 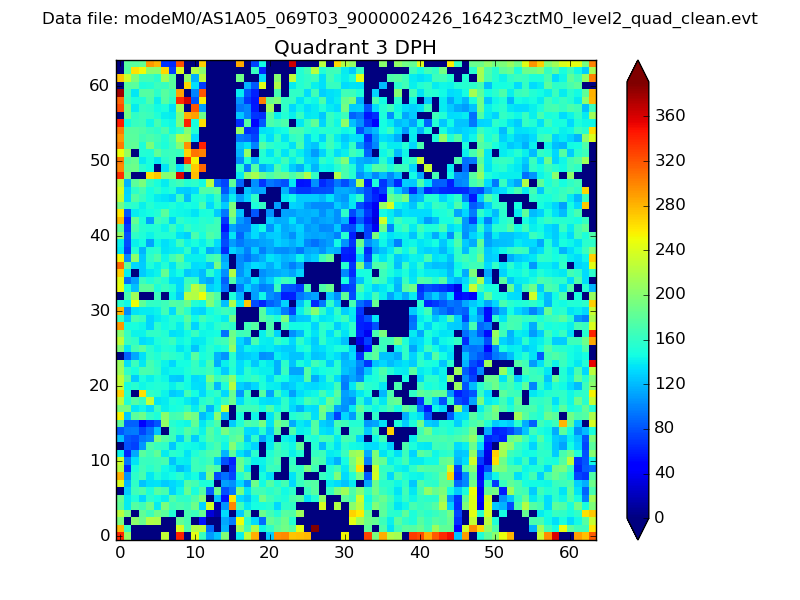 |
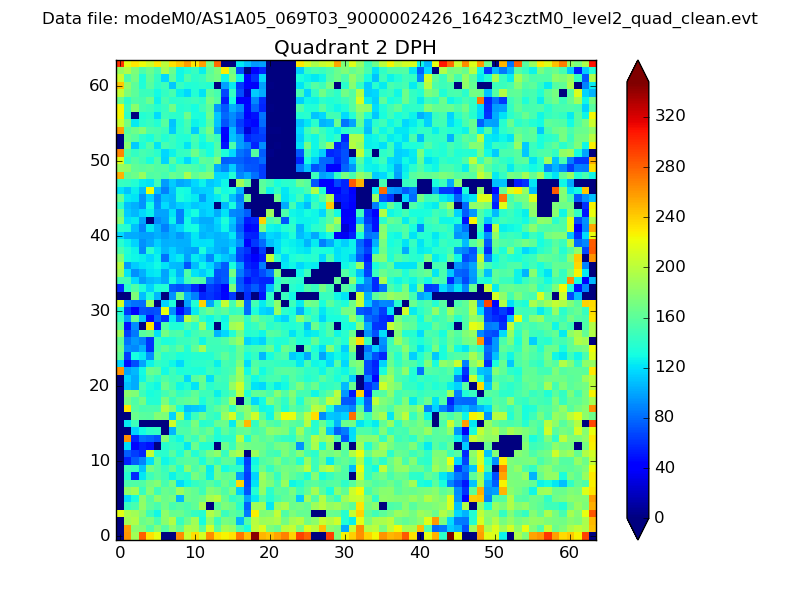 |
Quadrant C |
| Plot type | Count rate plots | Images |
|---|---|---|
| Comparison with Poisson distribution Blue bars denote a histogram of data divided into 1 sec bins. Red curve is a Poisson curve with rate = median count rate of data. |
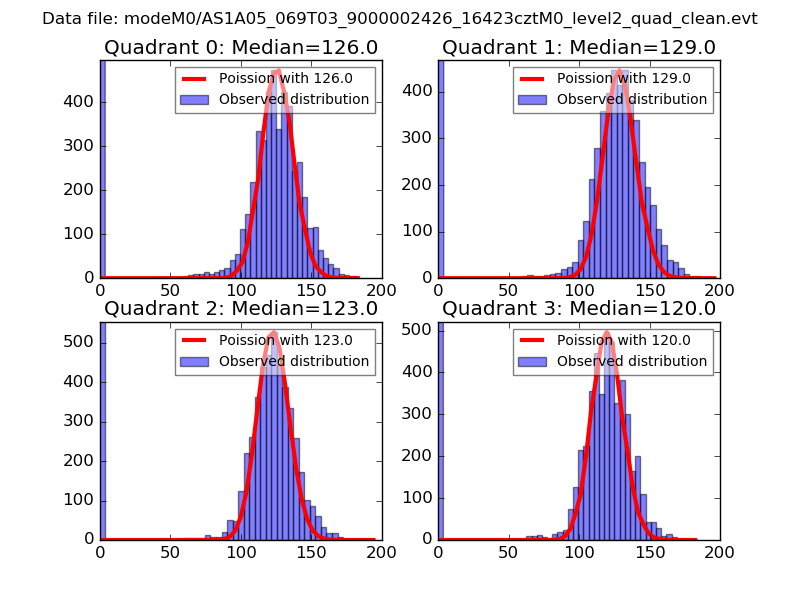 |
 |
| Quadrant-wise count rates Data is divided into 100 sec bins |
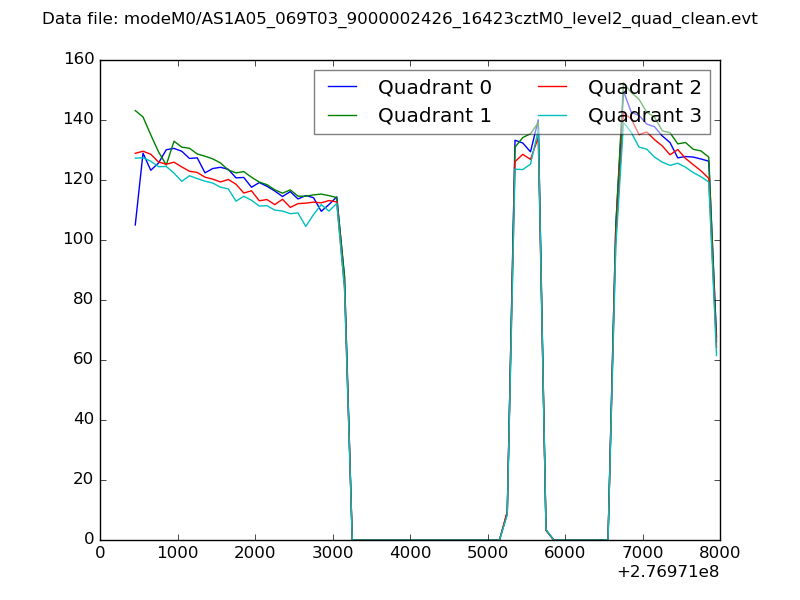 |
|
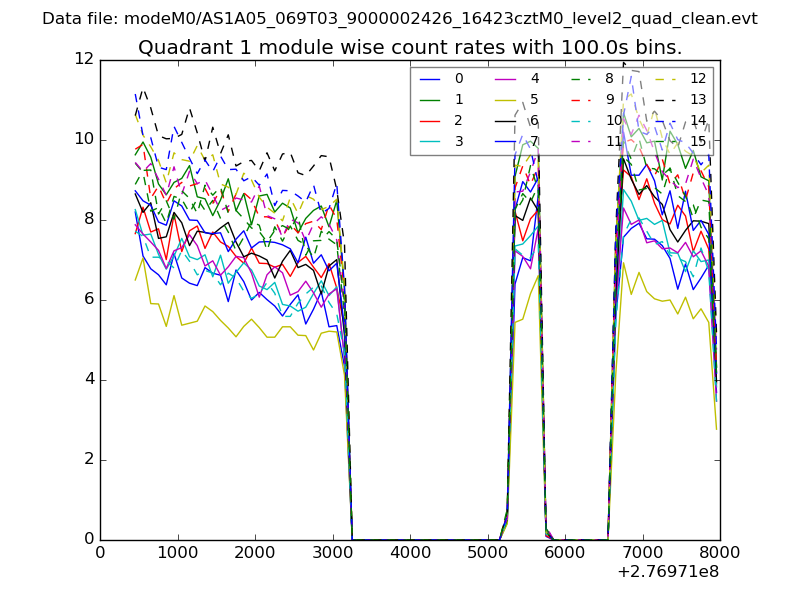
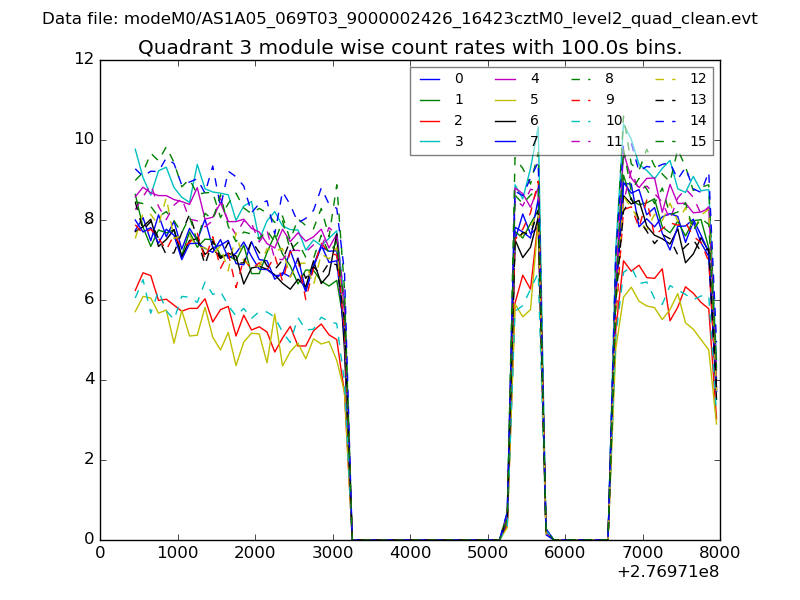
| Module-wise count rates for Quadrant A Data is divided into 100 sec bins |
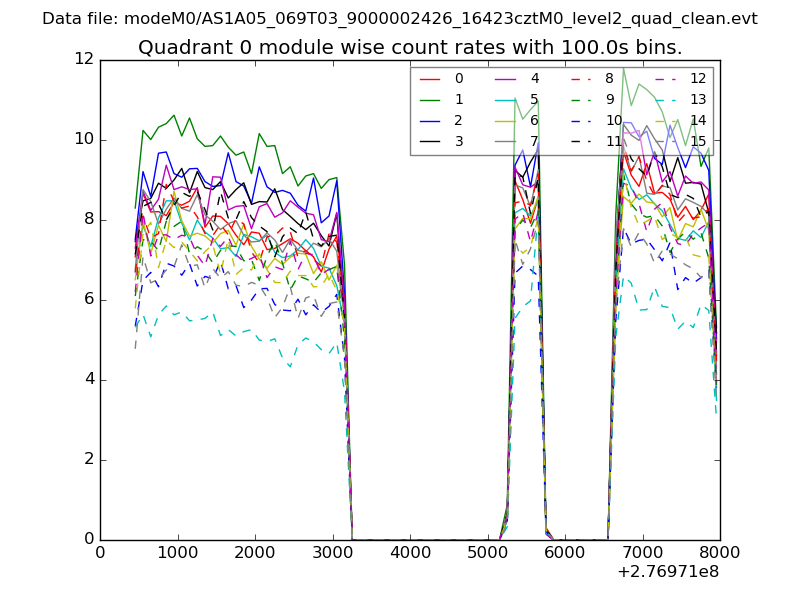 |
 |
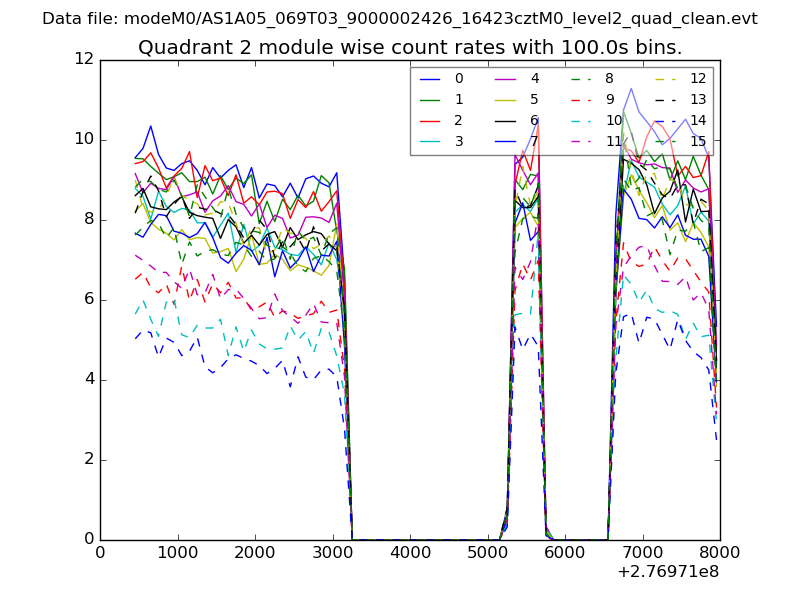
| Module-wise count rates for Quadrant B Data is divided into 100 sec bins |
 |
 |
| Module-wise count rates for Quadrant C Data is divided into 100 sec bins |
 |
 |
| Module-wise count rates for Quadrant D Data is divided into 100 sec bins |
 |
 |
| Parameter | Plot |
|---|---|
| CZT HV Monitor | 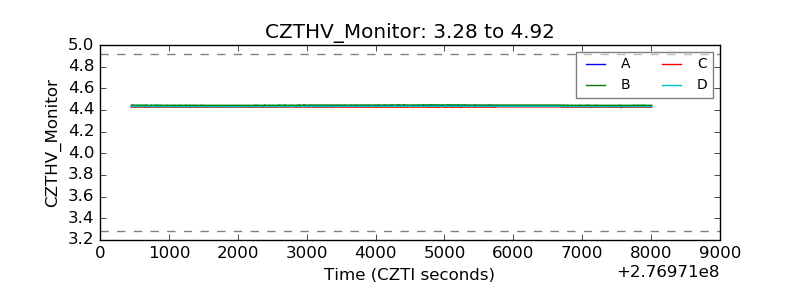 |
| D_VDD | 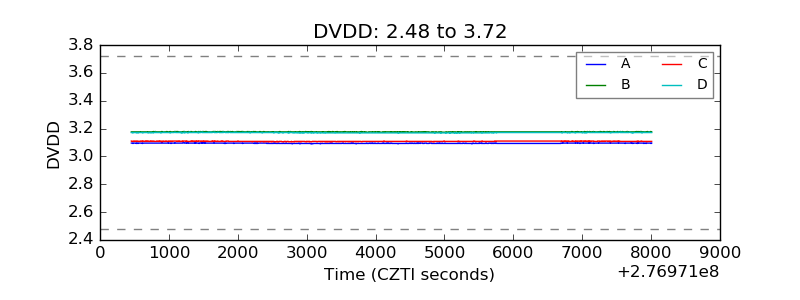 |
| Temperature 1 | 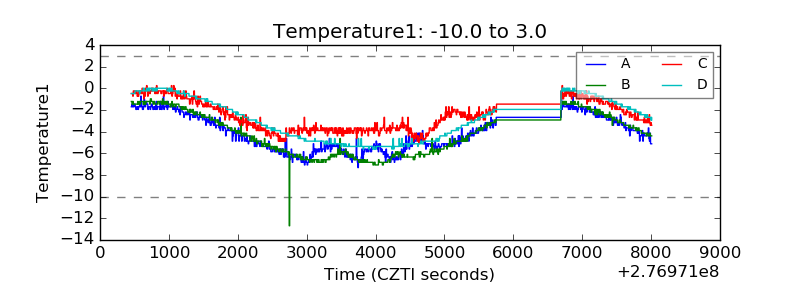 |
| Veto HV Monitor |  |
| Veto LLD | 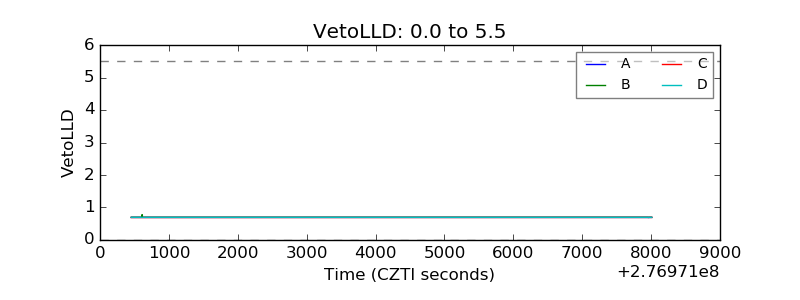 |
| Alpha Counter | 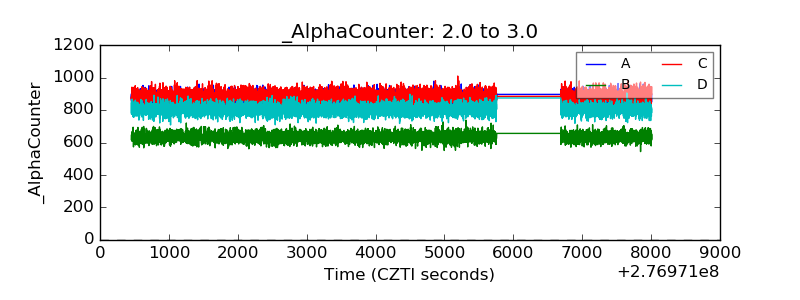 |
| _CPM_Rate | 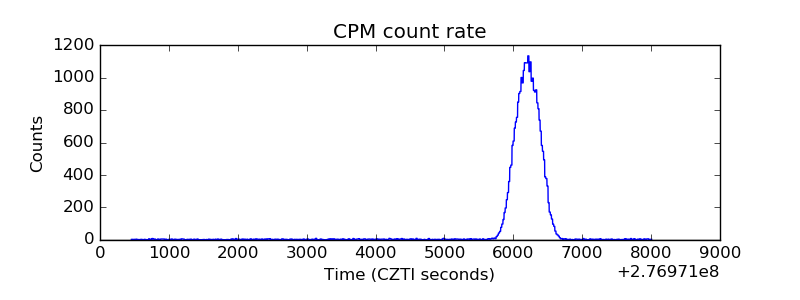 |
| CZT Counter | 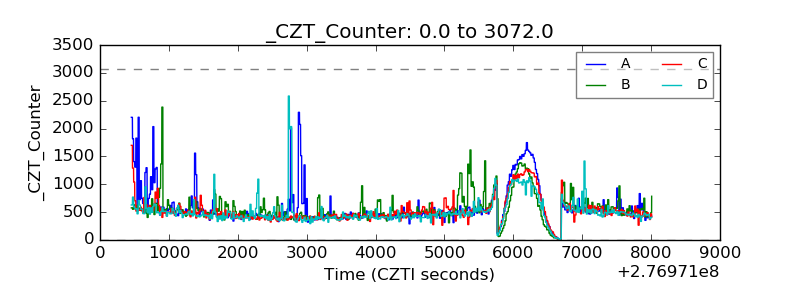 |
| +2.5 Volts monitor |  |
| +5 Volts monitor |  |
| _ROLL_ROT | 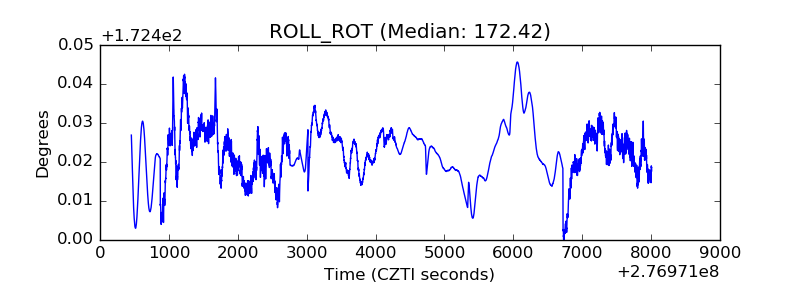 |
| _Roll_DEC | 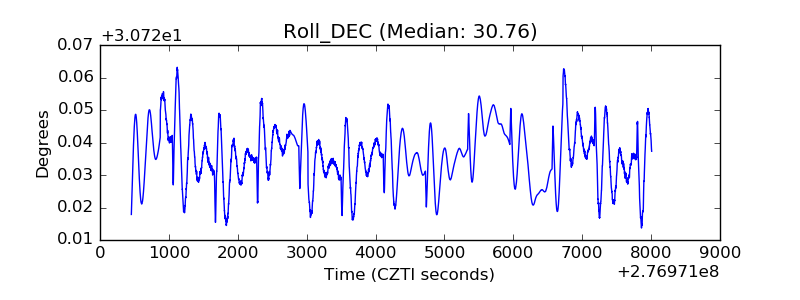 |
| _Roll_RA | 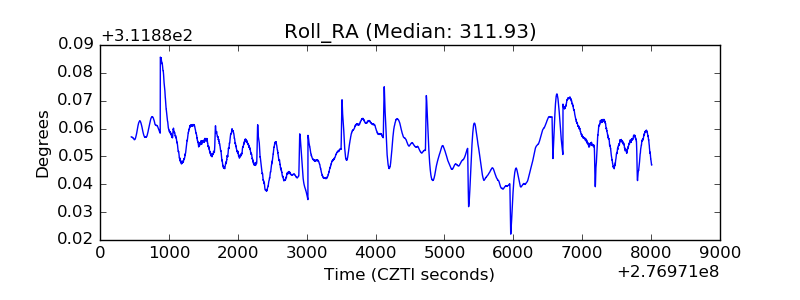 |
| Veto Counter | 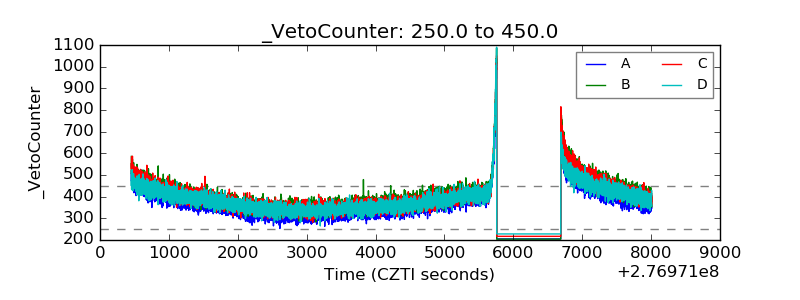 |