| Param | Original file | Final file |
|---|---|---|
| Filename | modeM0/AS1A05_069T03_9000002426_16425cztM0_level2.evt | modeM0/AS1A05_069T03_9000002426_16425cztM0_level2_quad_clean.evt |
| Size (bytes) | 456,730,560 | 94,334,400 |
| Size | 435.6 MB | 90.0 MB |
| Events in quadrant A | 3,251,837 | 608,163 |
| Events in quadrant B | 3,642,861 | 621,256 |
| Events in quadrant C | 3,231,517 | 589,909 |
| Events in quadrant D | 3,252,998 | 572,794 |
| Mode SS | |||
|---|---|---|---|
| Quadrant | BADHDUFLAG | Total packets | Discarded packets |
| A | 0 | 138 | 0 |
| B | 0 | 138 | 0 |
| C | 0 | 138 | 0 |
| D | 0 | 138 | 0 |
| Mode M0 | |||
|---|---|---|---|
| Quadrant | BADHDUFLAG | Total packets | Discarded packets |
| A | 0 | 14148 | 3 |
| B | 0 | 15269 | 2 |
| C | 0 | 13944 | 2 |
| D | 0 | 14385 | 2 |
| Mode M9 | |||
|---|---|---|---|
| Quadrant | BADHDUFLAG | Total packets | Discarded packets |
| A | 0 | 20 | 0 |
| B | 0 | 20 | 0 |
| C | 0 | 20 | 0 |
| D | 0 | 20 | 0 |
| Quadrant | Total seconds | Saturated seconds | Saturation percentage |
|---|---|---|---|
| A | 6663 | 58 | 0.870479% |
| B | 6663 | 108 | 1.620891% |
| C | 6663 | 94 | 1.410776% |
| D | 6663 | 76 | 1.140627% |
Noise dominated data is calculated using 1-second bins in cleaned event files. If a bin has >2000 counts, and if more than 50% of those come from <1% of pixels, then it is considered to be noise-dominated and hence unusable.
| Quadrant | # 1 sec bins | Bins with >0 counts | Bins with >2000 counts | High rate bins dominated by noise | Noise dominated (total time) | Noise dominated (detector-on time) | Marked lightcurve |
|---|---|---|---|---|---|---|---|
| A | 8674 | 6665 | 0 | 0 | 0.00% | 0.00% | 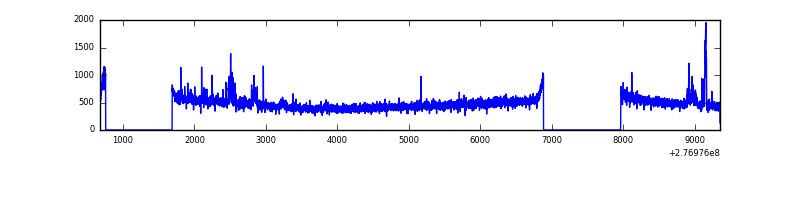 |
| B | 8674 | 6665 | 8 | 8 | 0.09% | 0.12% | 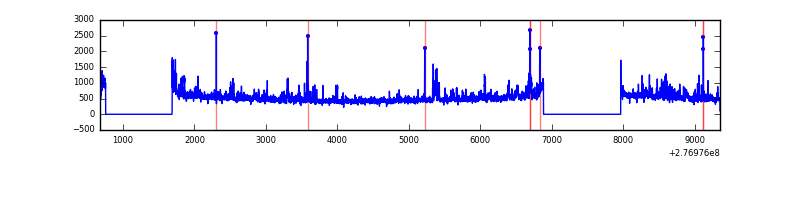 |
| C | 8674 | 6665 | 0 | 0 | 0.00% | 0.00% | 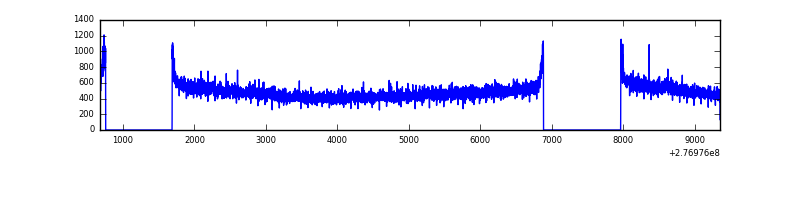 |
| D | 8674 | 6665 | 27 | 27 | 0.31% | 0.41% | 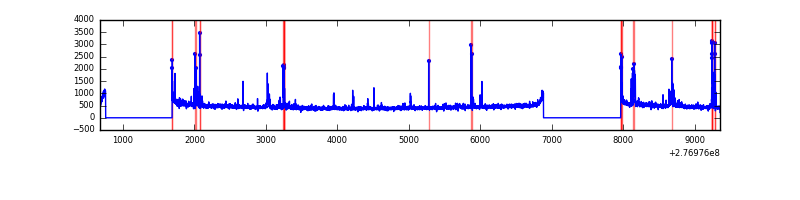 |
Top three noisy pixels from each quadrant. If the there are fewer than three noisy pixels in the level2.evt file, extra rows are filled as -1
| Pixel properties | Quadrant properties | ||||||
|---|---|---|---|---|---|---|---|
| Quadrant | DetID | PixID | Counts | Sigma | Mean | Median | Sigma |
| A | 15 | 174 | 102906 | 624.04 | 807 | 789 | 163.6 |
| A | 13 | 248 | 24952 | 147.66 | 807 | 789 | 163.6 |
| A | 15 | 223 | 13893 | 80.08 | 807 | 789 | 163.6 |
| B | 15 | 35 | 143601 | 928.32 | 811 | 790 | 153.8 |
| B | 0 | 189 | 113396 | 731.98 | 811 | 790 | 153.8 |
| B | 0 | 198 | 69332 | 445.55 | 811 | 790 | 153.8 |
| C | 14 | 238 | 120287 | 651.87 | 780 | 785 | 183.3 |
| C | 3 | 233 | 46942 | 251.78 | 780 | 785 | 183.3 |
| C | 7 | 247 | 17941 | 93.58 | 780 | 785 | 183.3 |
| D | 12 | 218 | 154346 | 798.41 | 786 | 762 | 192.4 |
| D | 10 | 70 | 79365 | 408.62 | 786 | 762 | 192.4 |
| D | 2 | 234 | 26813 | 135.43 | 786 | 762 | 192.4 |
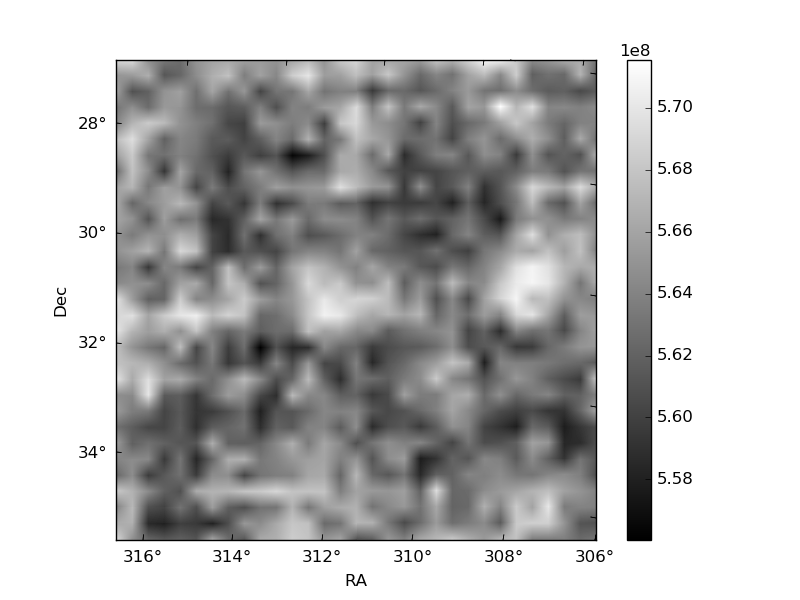
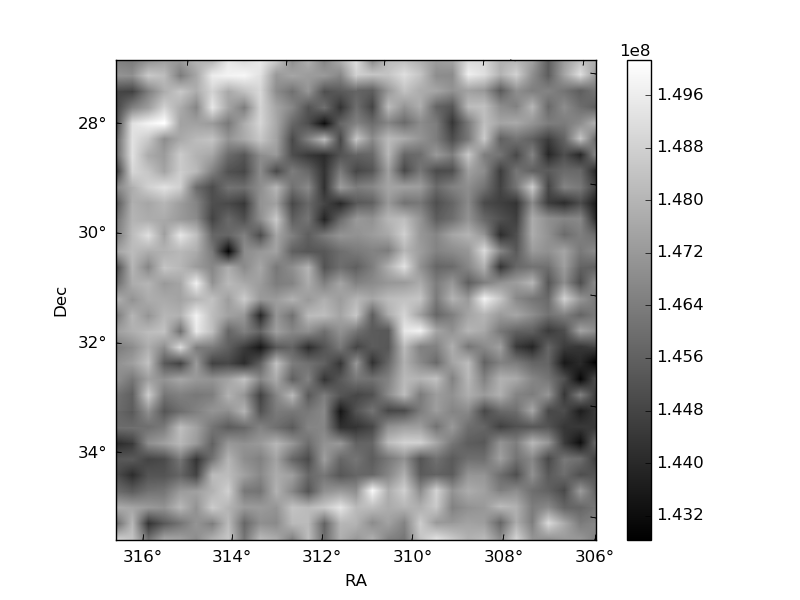
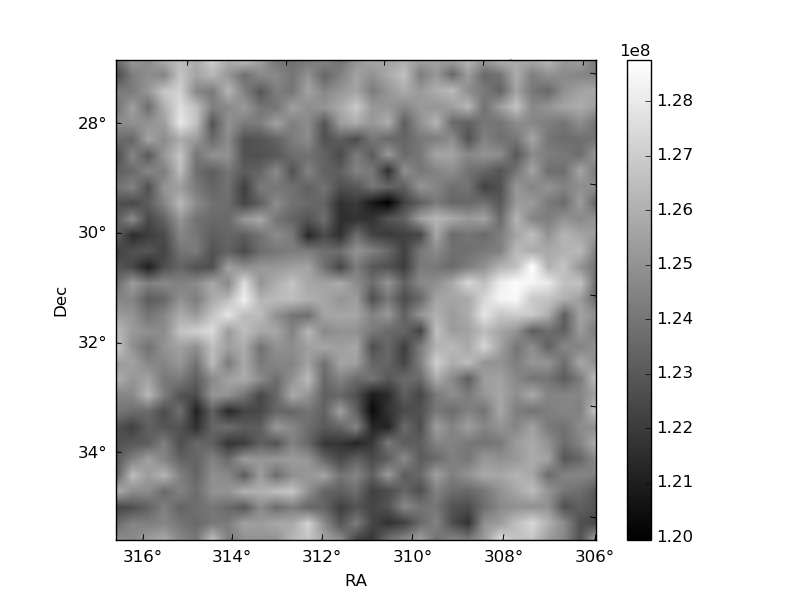
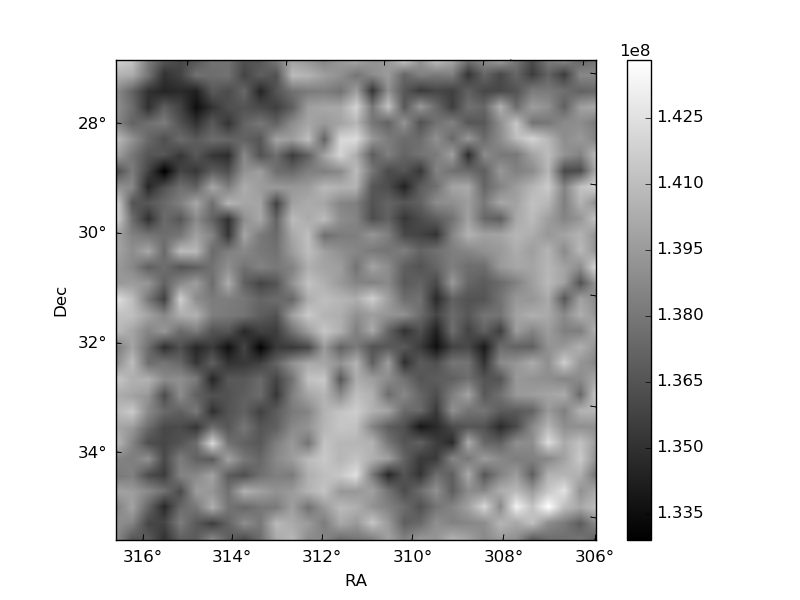
Histogram calculated using DETX and DETY for each event in the final _common_clean file
| Quadrant A | 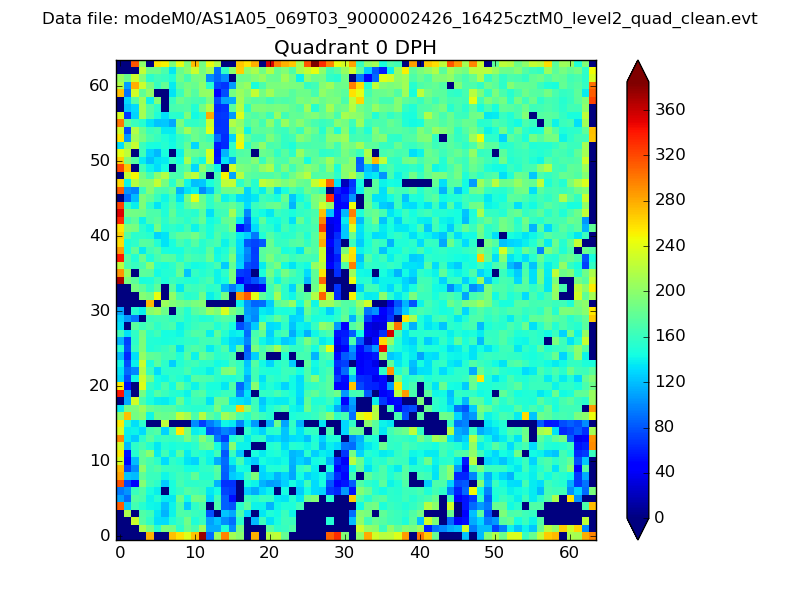 |
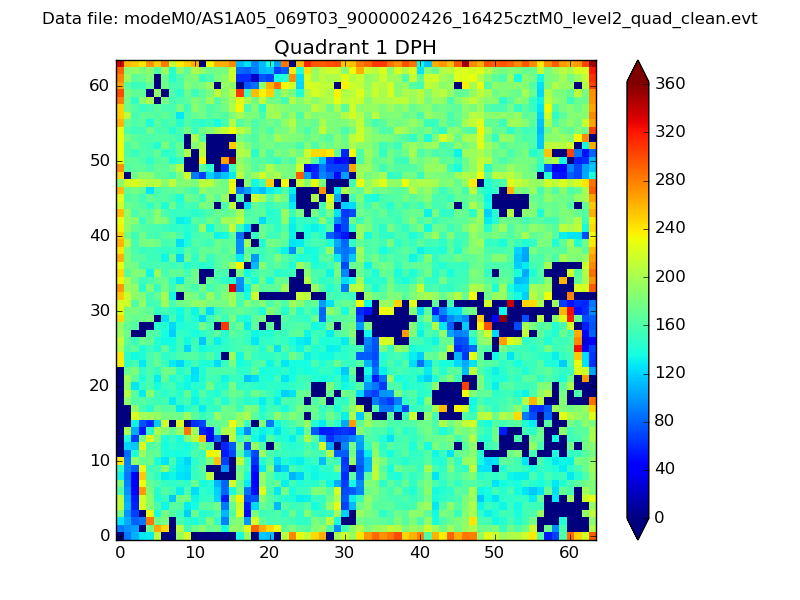 |
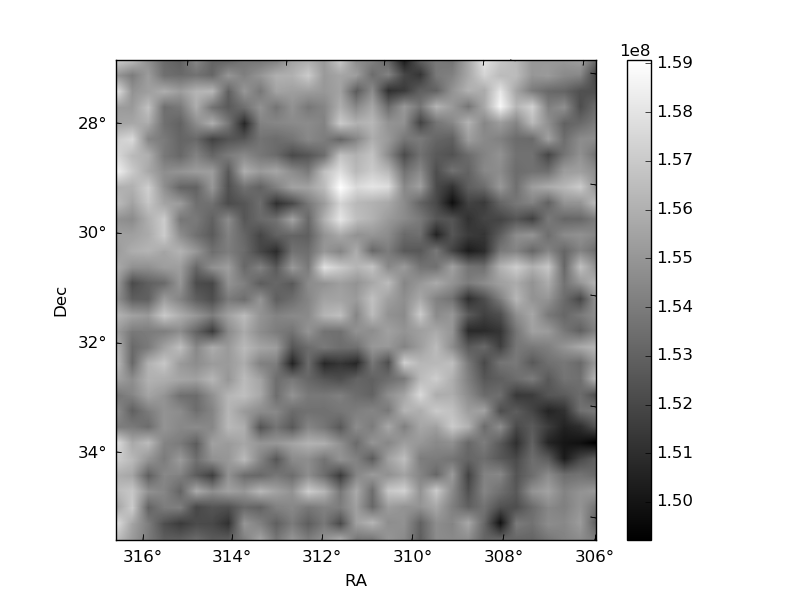
Quadrant B |
|---|---|---|---|
| Quadrant D | 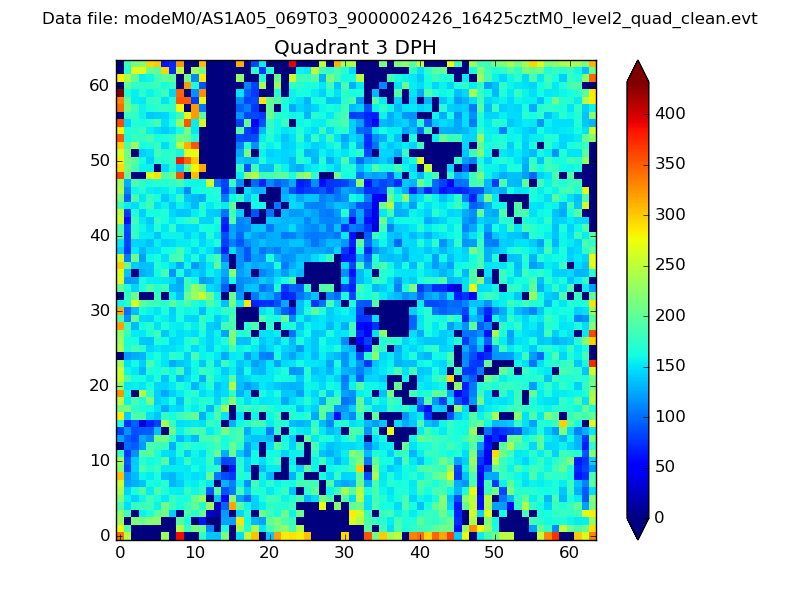 |
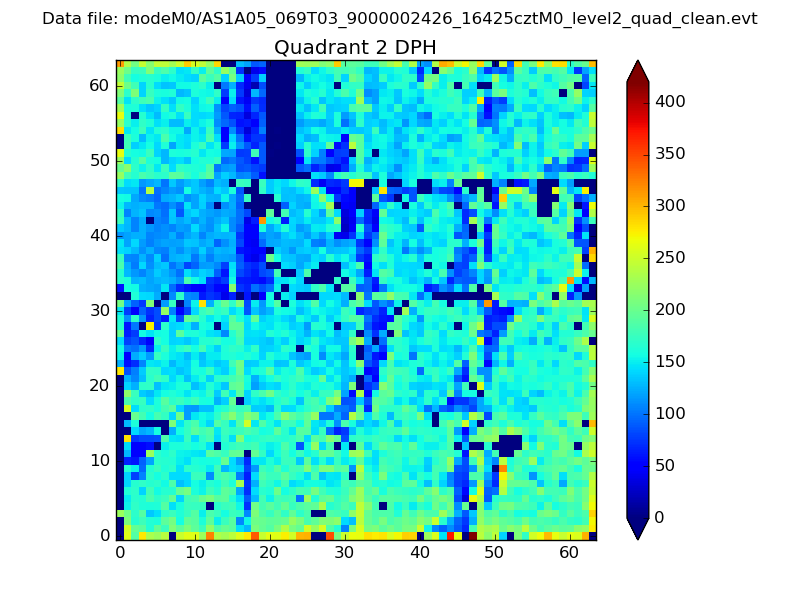 |
Quadrant C |
| Plot type | Count rate plots | Images |
|---|---|---|
| Comparison with Poisson distribution Blue bars denote a histogram of data divided into 1 sec bins. Red curve is a Poisson curve with rate = median count rate of data. |
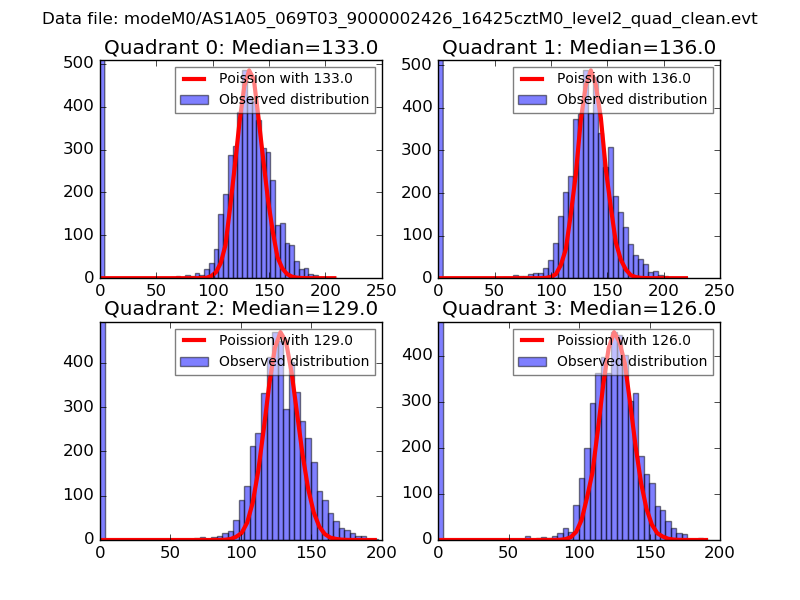 |
 |
| Quadrant-wise count rates Data is divided into 100 sec bins |
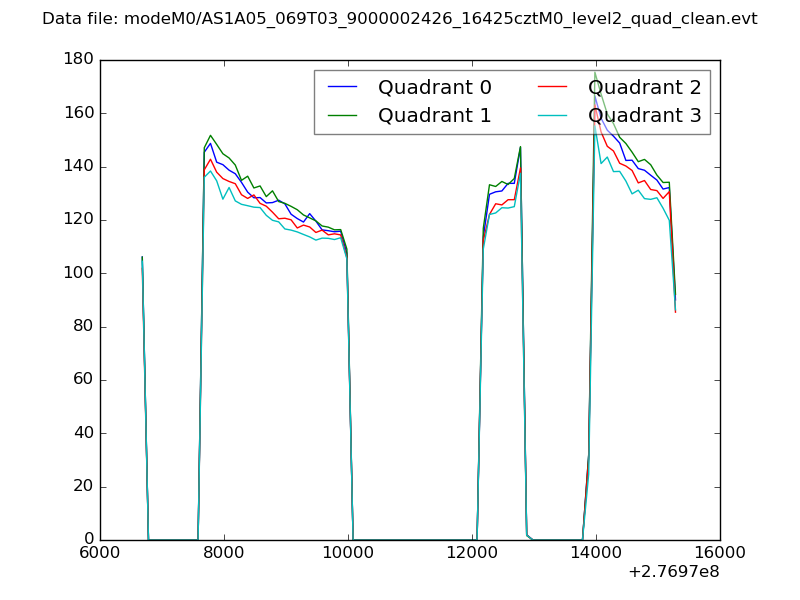 |
|
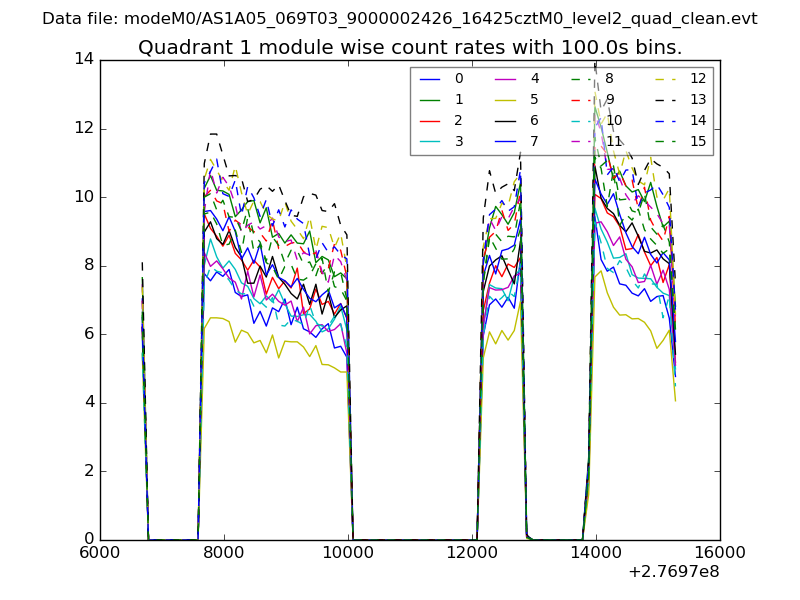
| Module-wise count rates for Quadrant A Data is divided into 100 sec bins |
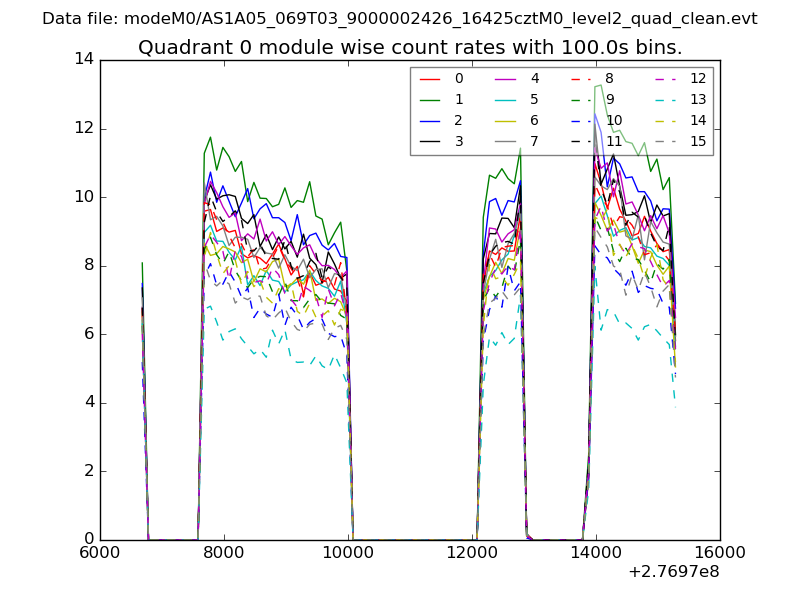 |
 |
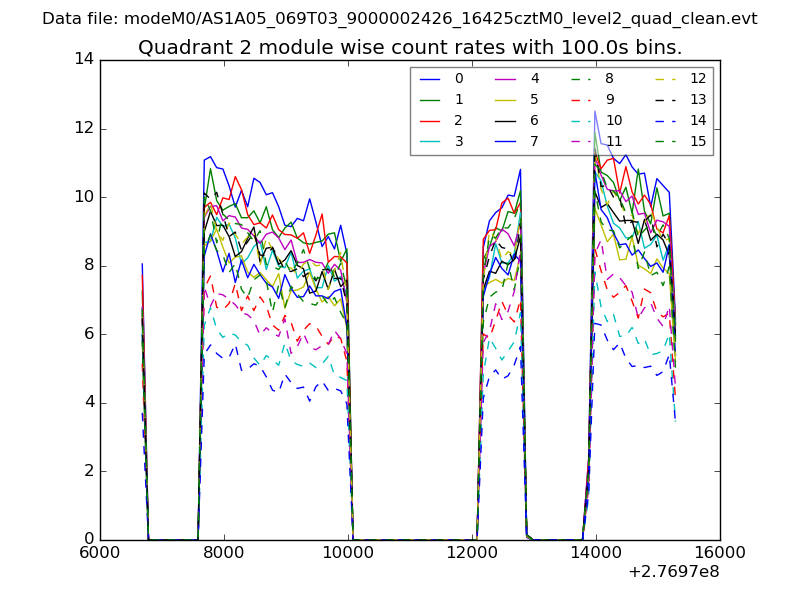
| Module-wise count rates for Quadrant B Data is divided into 100 sec bins |
 |
 |
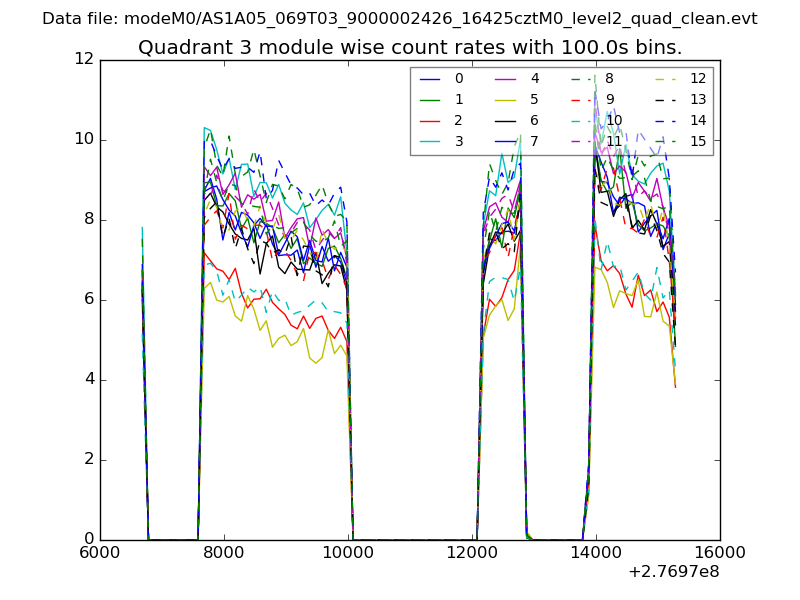
| Module-wise count rates for Quadrant C Data is divided into 100 sec bins |
 |
 |
| Module-wise count rates for Quadrant D Data is divided into 100 sec bins |
 |
 |
| Parameter | Plot |
|---|---|
| CZT HV Monitor | 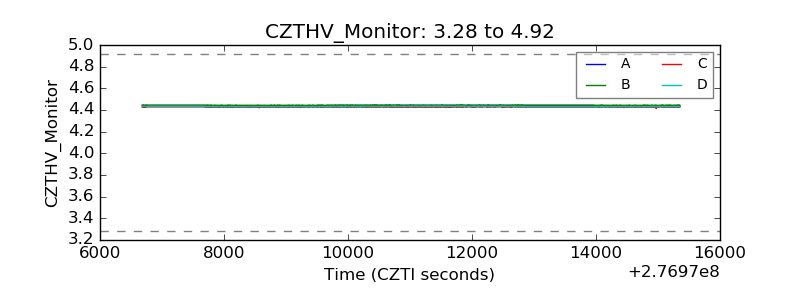 |
| D_VDD | 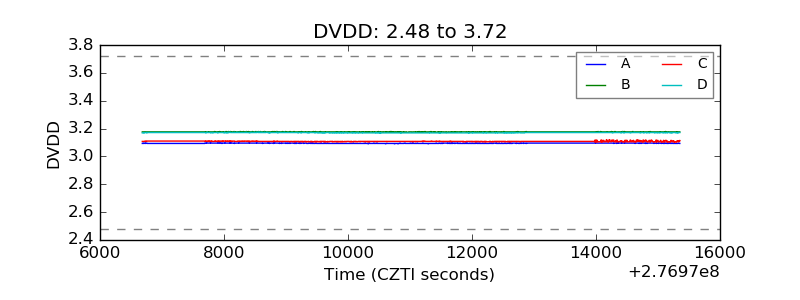 |
| Temperature 1 | 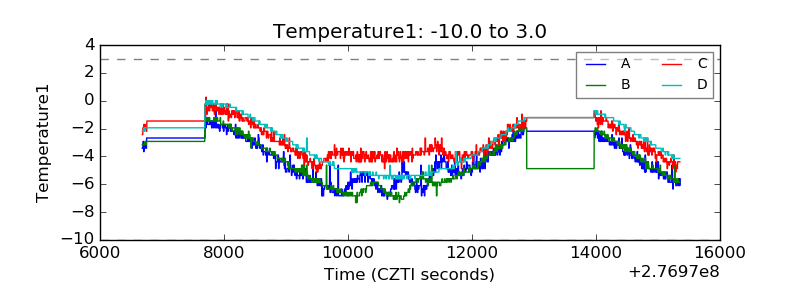 |
| Veto HV Monitor | 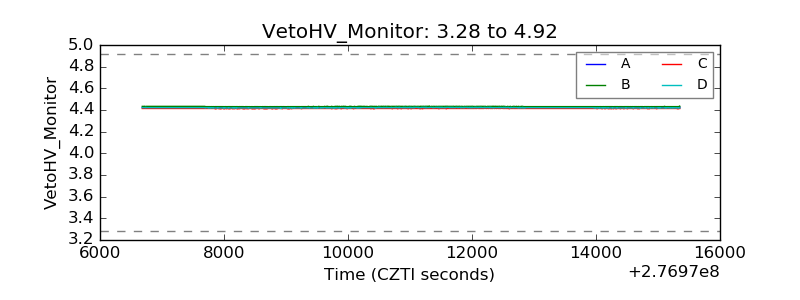 |
| Veto LLD | 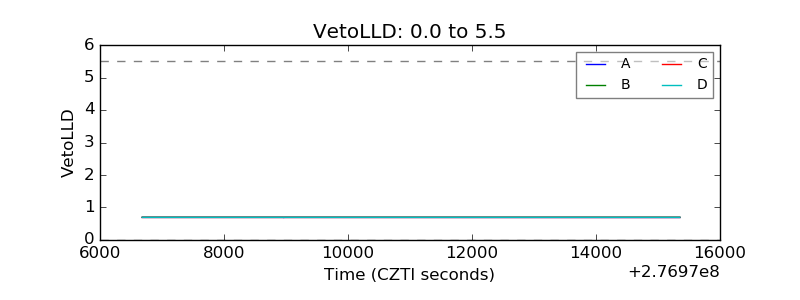 |
| Alpha Counter | 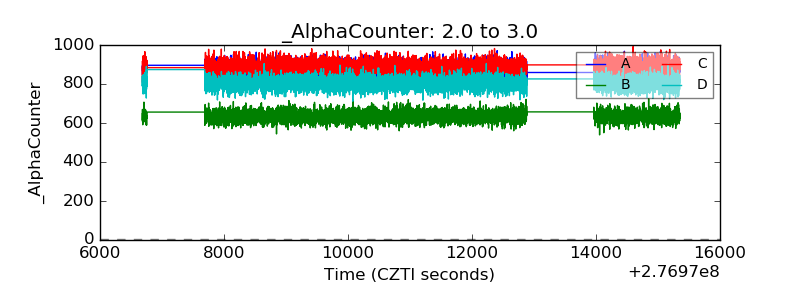 |
| _CPM_Rate | 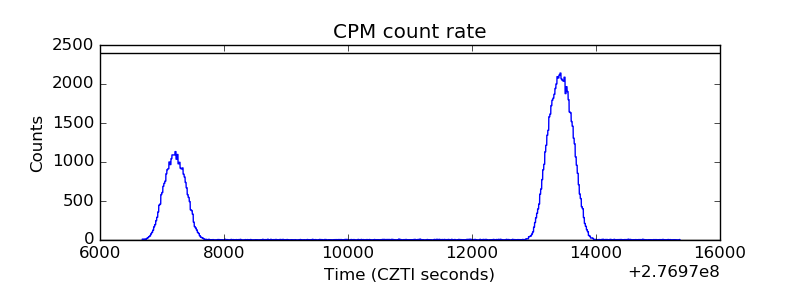 |
| CZT Counter | 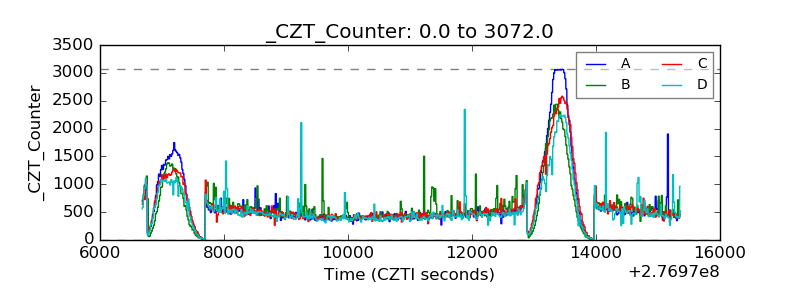 |
| +2.5 Volts monitor |  |
| +5 Volts monitor |  |
| _ROLL_ROT |  |
| _Roll_DEC | 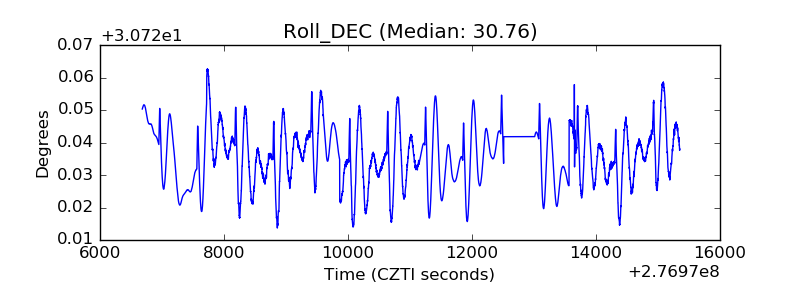 |
| _Roll_RA | 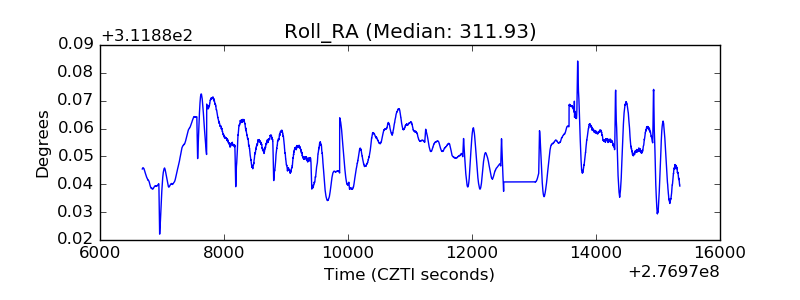 |
| Veto Counter | 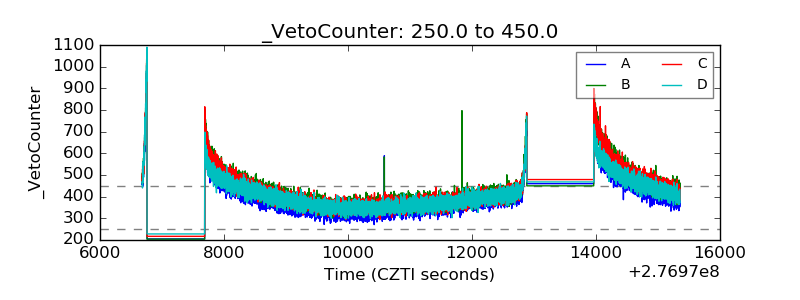 |