| Param | Original file | Final file |
|---|---|---|
| Filename | modeM0/AS1A05_069T03_9000002426_16427cztM0_level2.evt | modeM0/AS1A05_069T03_9000002426_16427cztM0_level2_quad_clean.evt |
| Size (bytes) | 454,858,560 | 89,729,280 |
| Size | 433.8 MB | 85.6 MB |
| Events in quadrant A | 3,085,133 | 579,515 |
| Events in quadrant B | 3,520,722 | 603,939 |
| Events in quadrant C | 3,198,284 | 568,614 |
| Events in quadrant D | 3,553,164 | 535,423 |
| Mode SS | |||
|---|---|---|---|
| Quadrant | BADHDUFLAG | Total packets | Discarded packets |
| A | 0 | 126 | 0 |
| B | 0 | 126 | 0 |
| C | 0 | 126 | 0 |
| D | 0 | 126 | 0 |
| Mode M0 | |||
|---|---|---|---|
| Quadrant | BADHDUFLAG | Total packets | Discarded packets |
| A | 0 | 13060 | 3 |
| B | 0 | 14464 | 2 |
| C | 0 | 13315 | 2 |
| D | 0 | 14759 | 2 |
| Mode M9 | |||
|---|---|---|---|
| Quadrant | BADHDUFLAG | Total packets | Discarded packets |
| A | 0 | 21 | 0 |
| B | 0 | 21 | 0 |
| C | 0 | 21 | 0 |
| D | 0 | 22 | 0 |
| Quadrant | Total seconds | Saturated seconds | Saturation percentage |
|---|---|---|---|
| A | 6153 | 49 | 0.796359% |
| B | 6153 | 57 | 0.926377% |
| C | 6153 | 67 | 1.088900% |
| D | 6153 | 181 | 2.941654% |
Noise dominated data is calculated using 1-second bins in cleaned event files. If a bin has >2000 counts, and if more than 50% of those come from <1% of pixels, then it is considered to be noise-dominated and hence unusable.
| Quadrant | # 1 sec bins | Bins with >0 counts | Bins with >2000 counts | High rate bins dominated by noise | Noise dominated (total time) | Noise dominated (detector-on time) | Marked lightcurve |
|---|---|---|---|---|---|---|---|
| A | 7434 | 6155 | 19 | 19 | 0.26% | 0.31% | 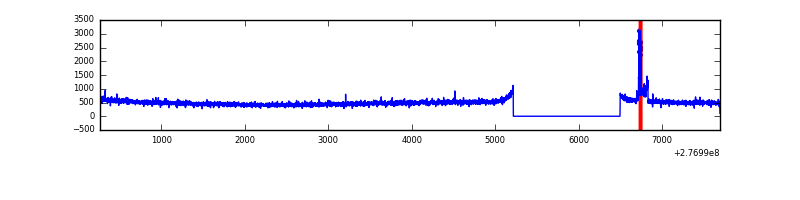 |
| B | 7434 | 6155 | 3 | 3 | 0.04% | 0.05% | 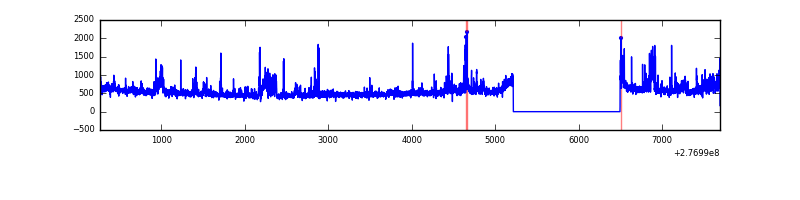 |
| C | 7434 | 6155 | 0 | 0 | 0.00% | 0.00% | 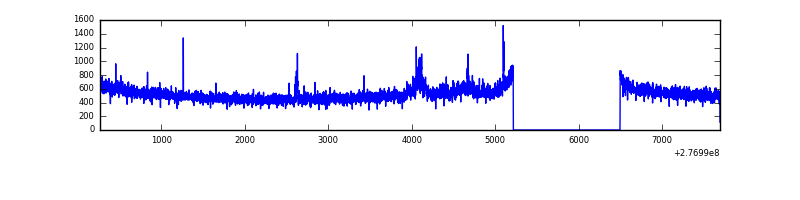 |
| D | 7434 | 6155 | 159 | 159 | 2.14% | 2.58% | 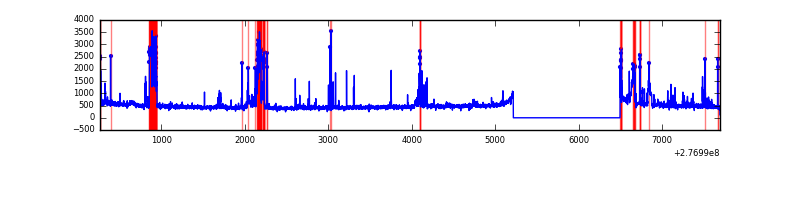 |
Top three noisy pixels from each quadrant. If the there are fewer than three noisy pixels in the level2.evt file, extra rows are filled as -1
| Pixel properties | Quadrant properties | ||||||
|---|---|---|---|---|---|---|---|
| Quadrant | DetID | PixID | Counts | Sigma | Mean | Median | Sigma |
| A | 15 | 174 | 102075 | 659.25 | 774 | 757 | 153.7 |
| A | 0 | 226 | 6718 | 38.79 | 774 | 757 | 153.7 |
| A | 12 | 194 | 5775 | 32.65 | 774 | 757 | 153.7 |
| B | 15 | 35 | 243865 | 1664.94 | 785 | 768 | 146.0 |
| B | 0 | 198 | 39657 | 266.34 | 785 | 768 | 146.0 |
| B | 0 | 189 | 39202 | 263.23 | 785 | 768 | 146.0 |
| C | 3 | 233 | 124280 | 706.51 | 749 | 757 | 174.8 |
| C | 14 | 238 | 117023 | 665.0 | 749 | 757 | 174.8 |
| C | 7 | 247 | 33849 | 189.27 | 749 | 757 | 174.8 |
| D | 12 | 218 | 484601 | 2694.97 | 738 | 717 | 179.6 |
| D | 15 | 0 | 144580 | 801.24 | 738 | 717 | 179.6 |
| D | 5 | 222 | 61073 | 336.15 | 738 | 717 | 179.6 |
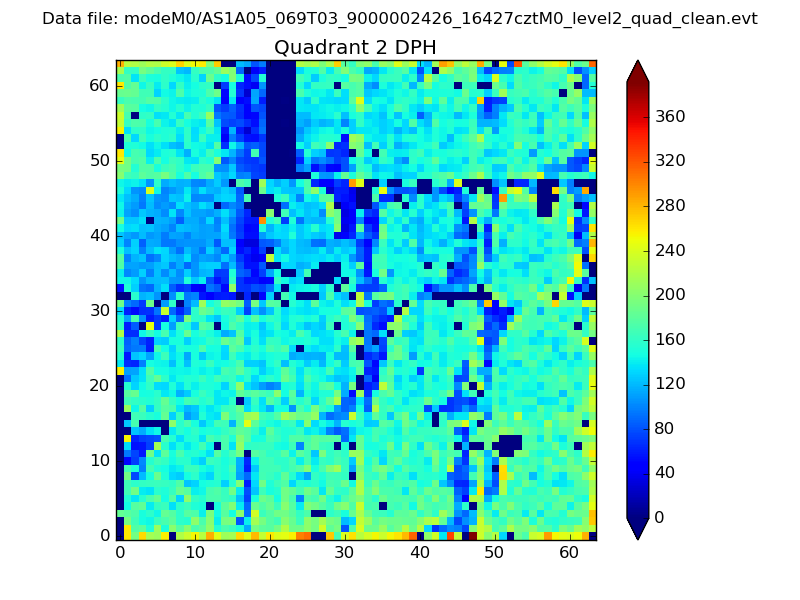
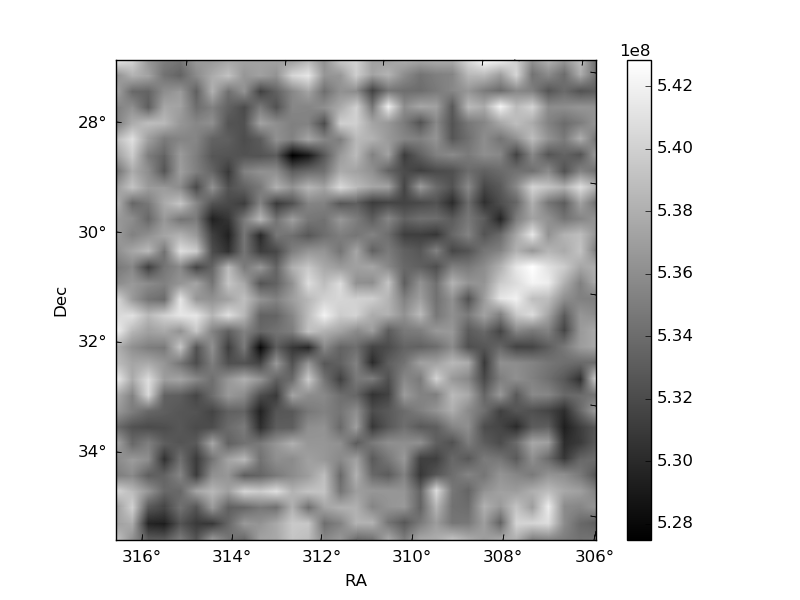
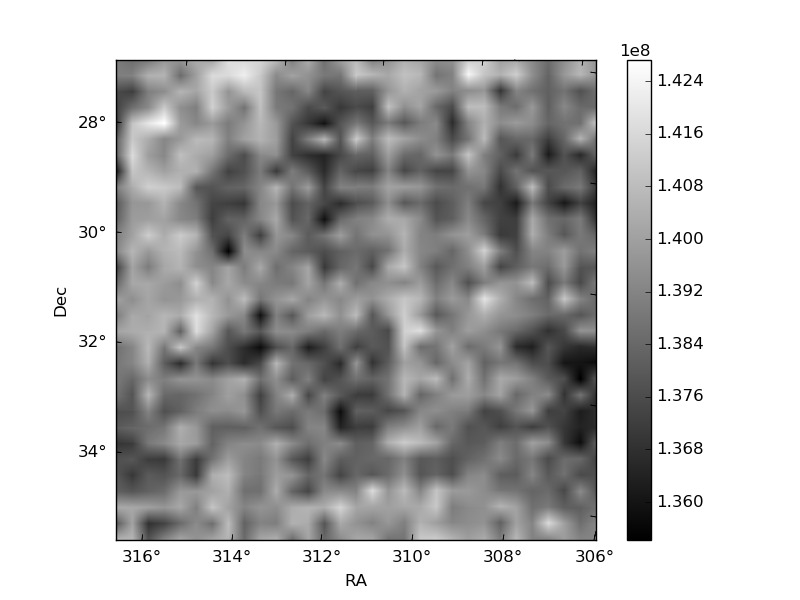
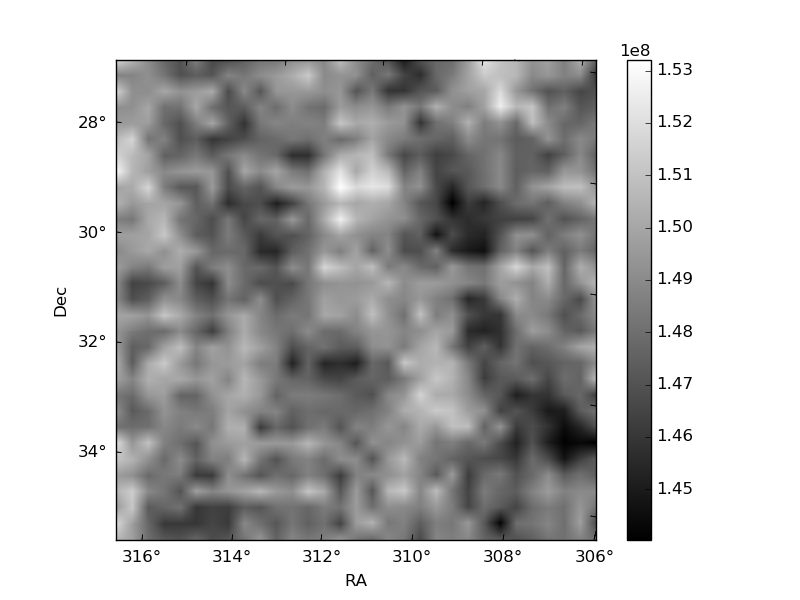
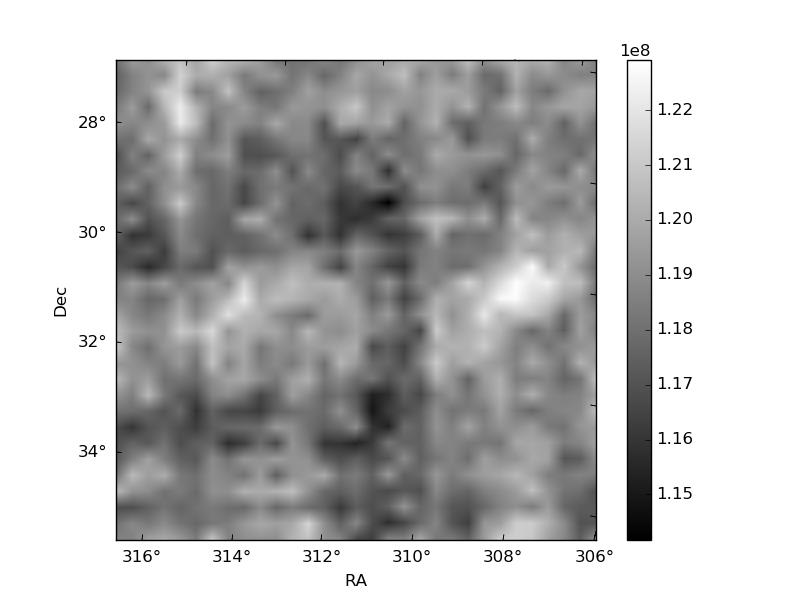
Histogram calculated using DETX and DETY for each event in the final _common_clean file
| Quadrant A | 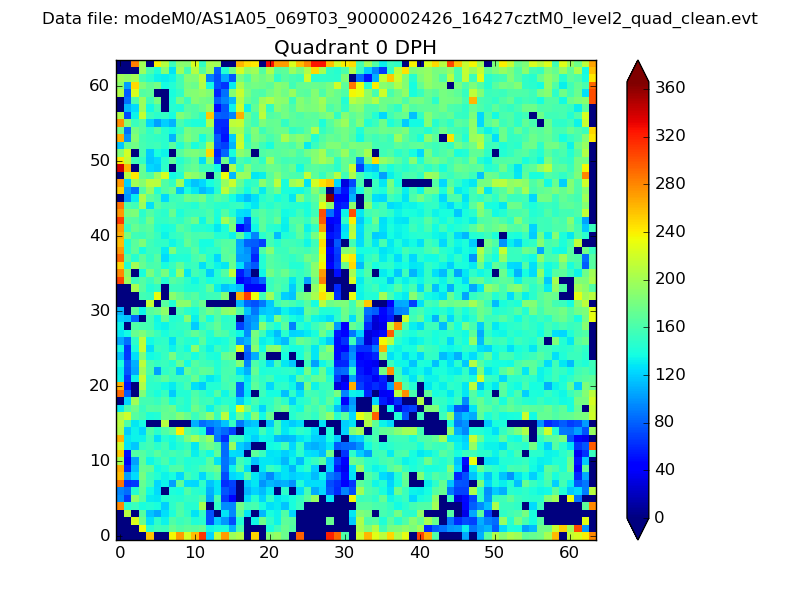 |
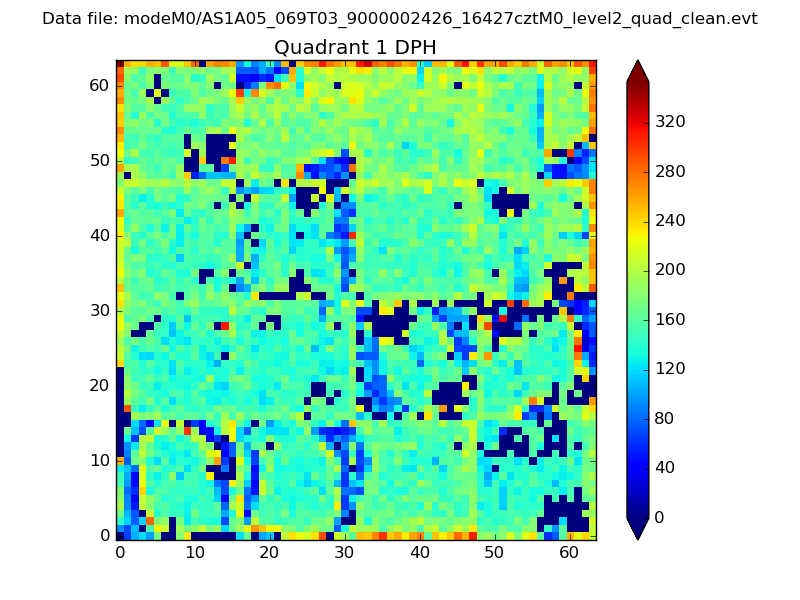 |
Quadrant B |
|---|---|---|---|
| Quadrant D | 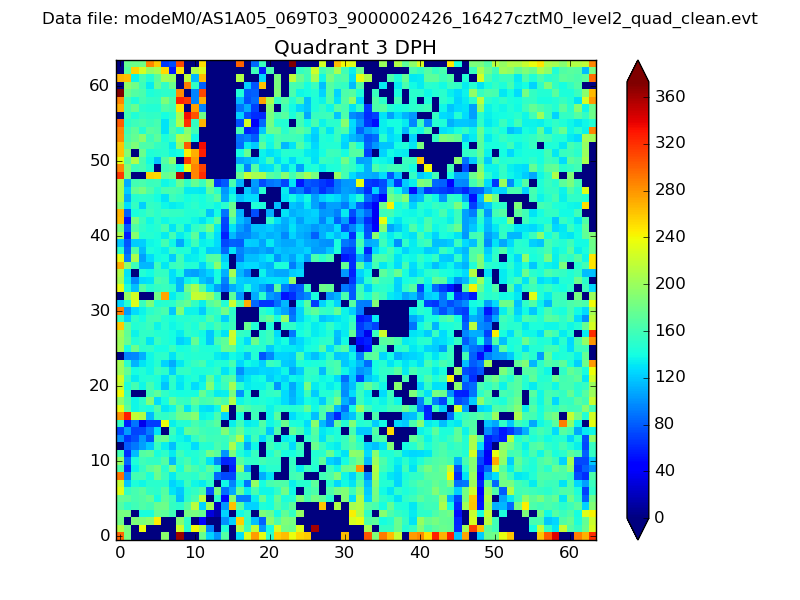 |
 |
Quadrant C |
| Plot type | Count rate plots | Images |
|---|---|---|
| Comparison with Poisson distribution Blue bars denote a histogram of data divided into 1 sec bins. Red curve is a Poisson curve with rate = median count rate of data. |
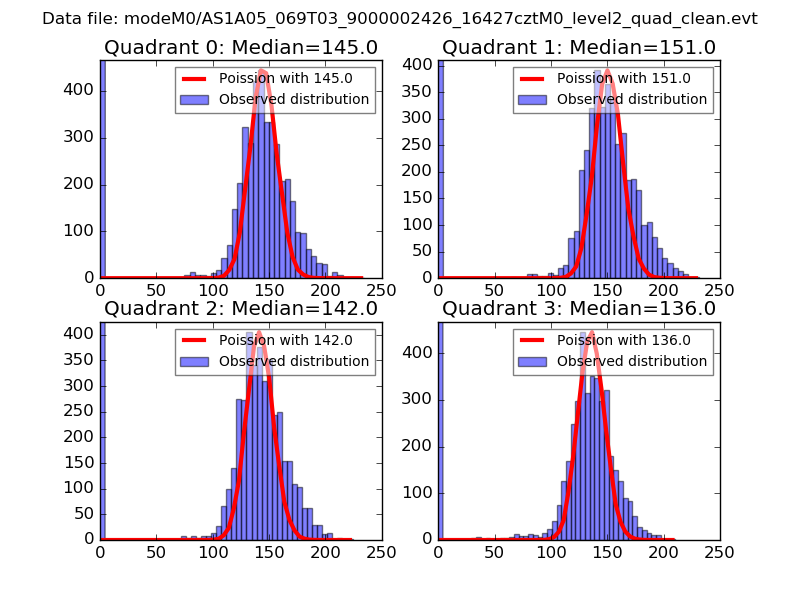 |
 |
| Quadrant-wise count rates Data is divided into 100 sec bins |
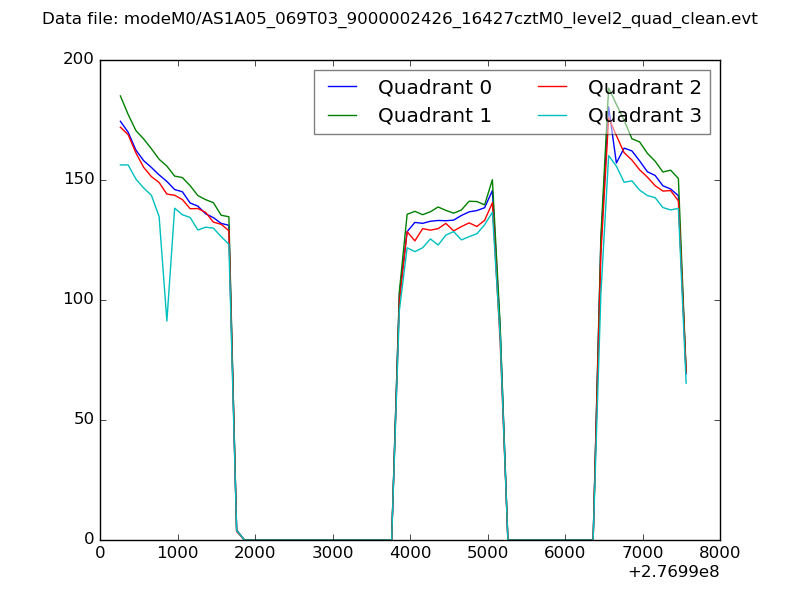 |
|
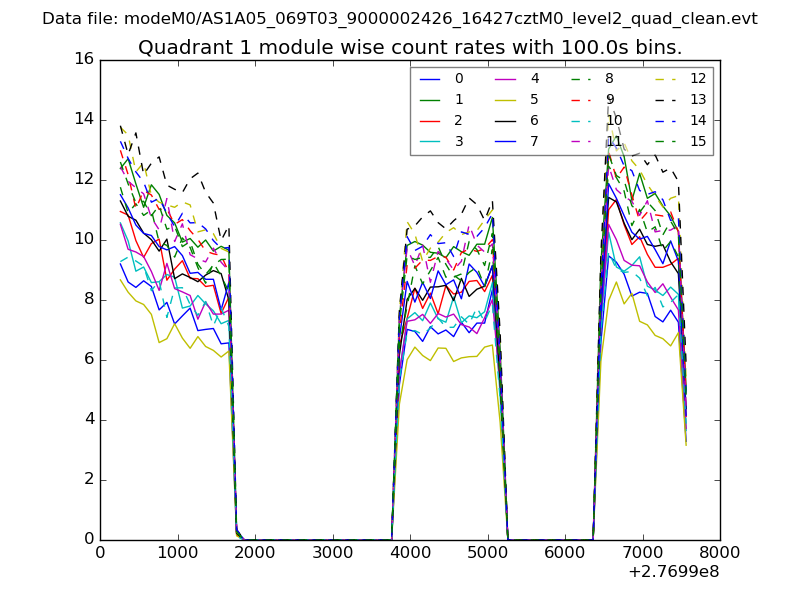
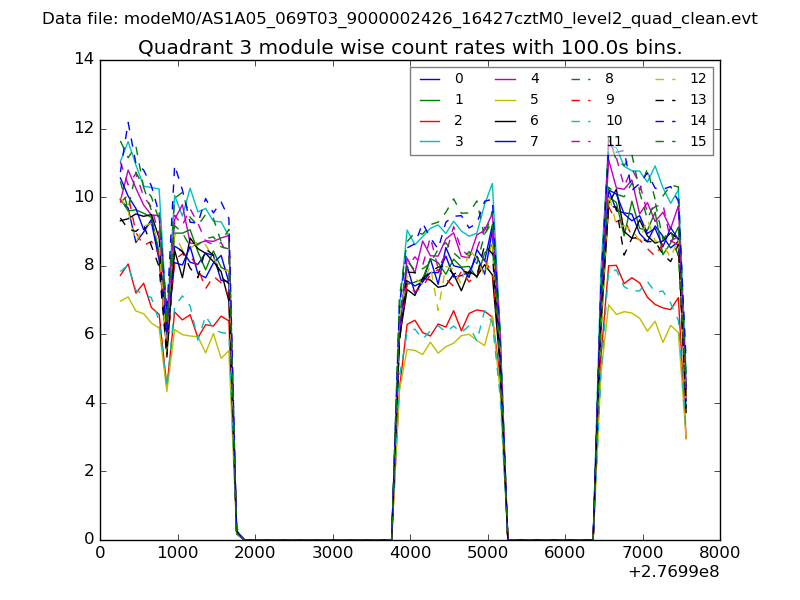
| Module-wise count rates for Quadrant A Data is divided into 100 sec bins |
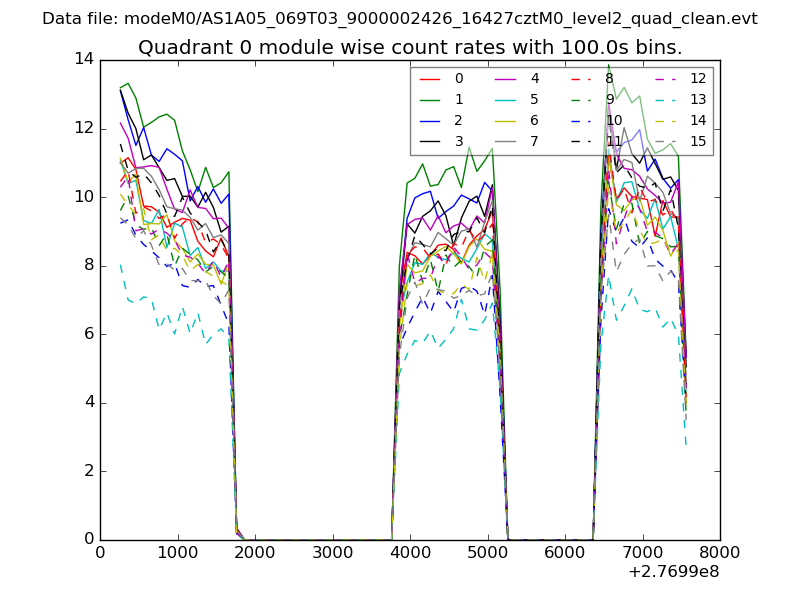 |
 |
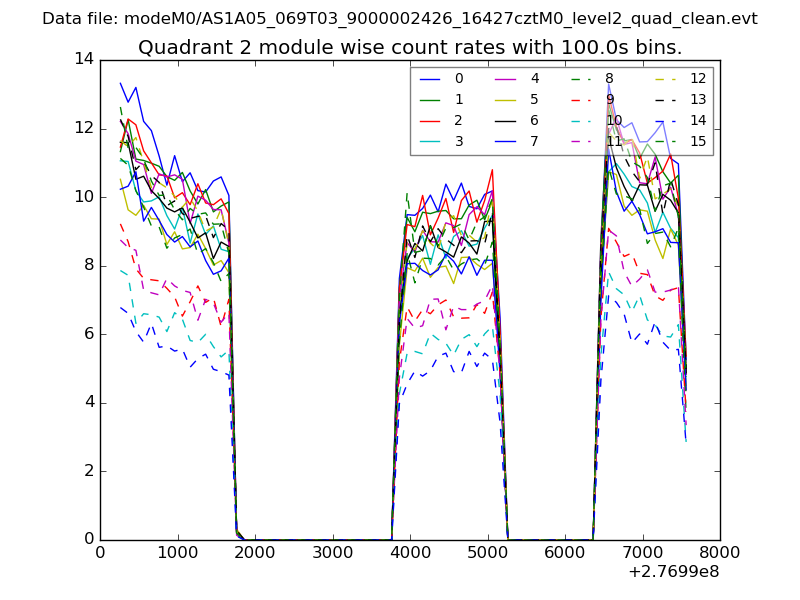
| Module-wise count rates for Quadrant B Data is divided into 100 sec bins |
 |
 |
| Module-wise count rates for Quadrant C Data is divided into 100 sec bins |
 |
 |
| Module-wise count rates for Quadrant D Data is divided into 100 sec bins |
 |
 |
| Parameter | Plot |
|---|---|
| CZT HV Monitor | 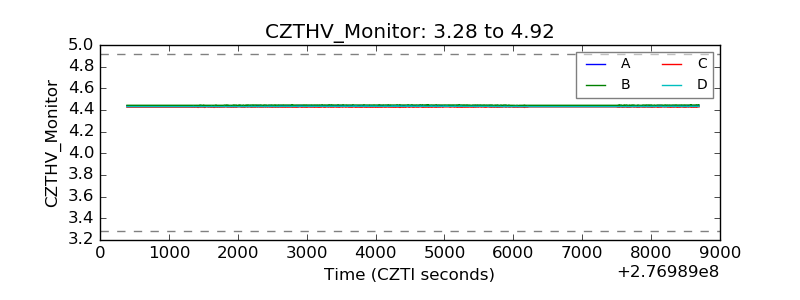 |
| D_VDD | 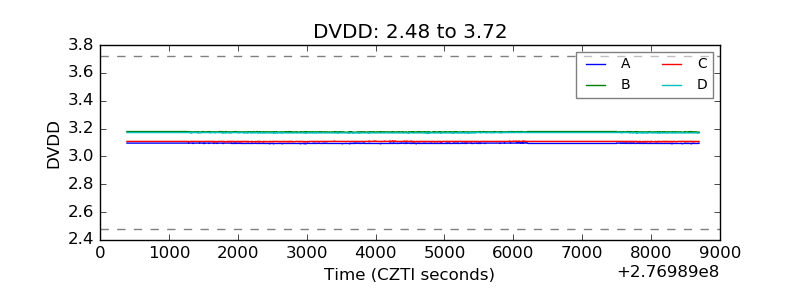 |
| Temperature 1 | 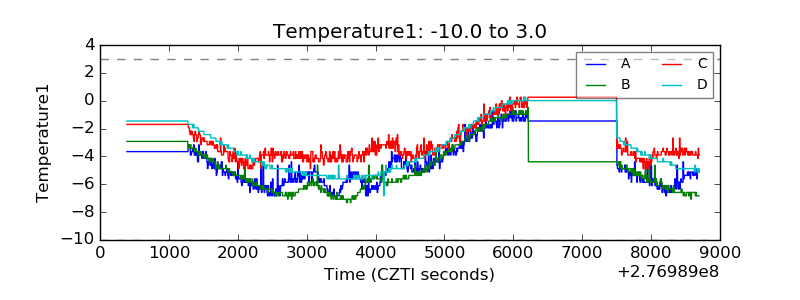 |
| Veto HV Monitor | 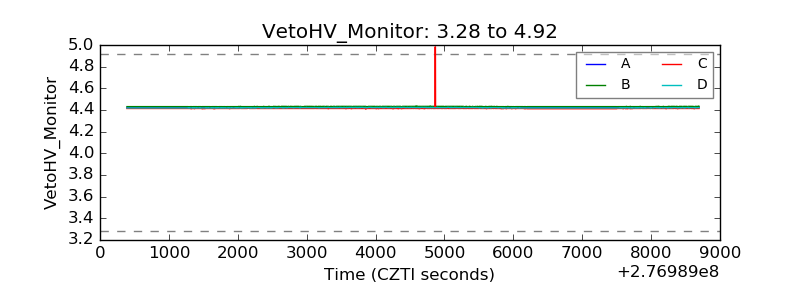 |
| Veto LLD | 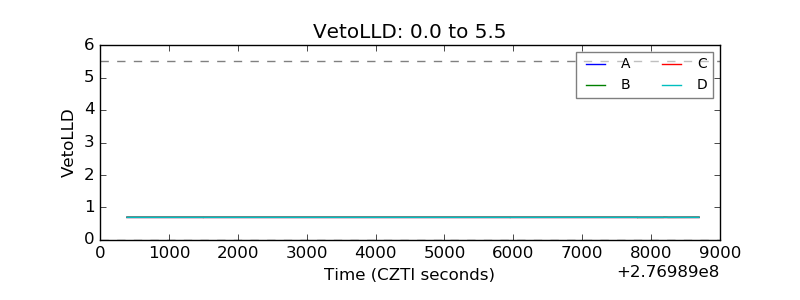 |
| Alpha Counter | 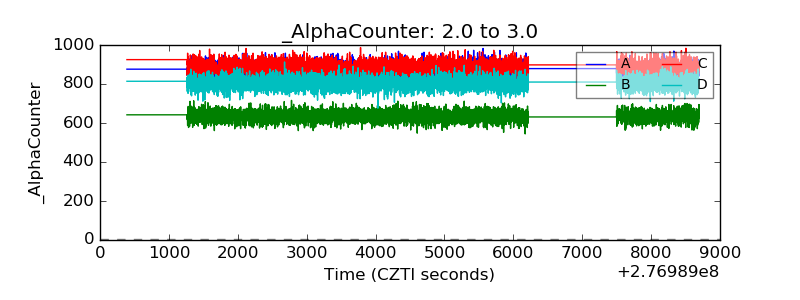 |
| _CPM_Rate | 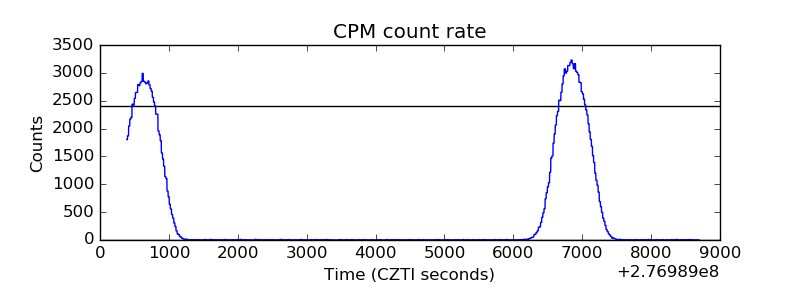 |
| CZT Counter | 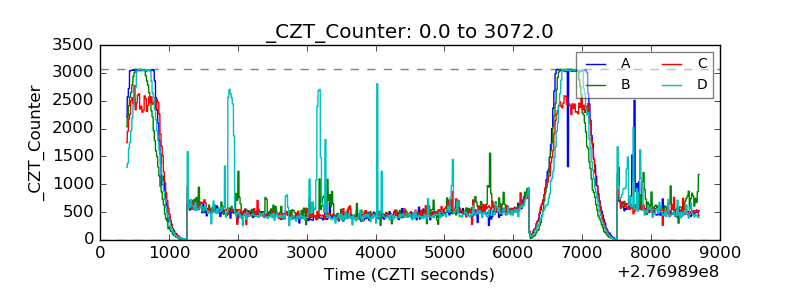 |
| +2.5 Volts monitor |  |
| +5 Volts monitor |  |
| _ROLL_ROT | 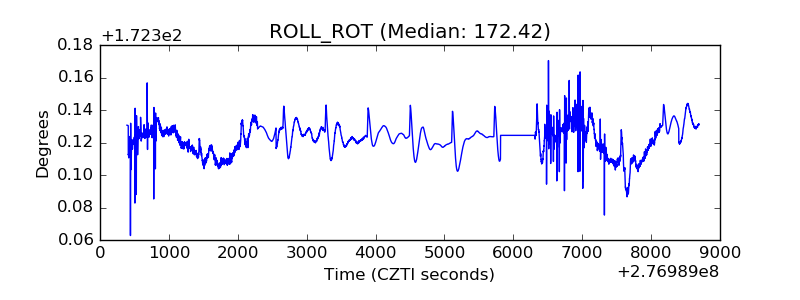 |
| _Roll_DEC | 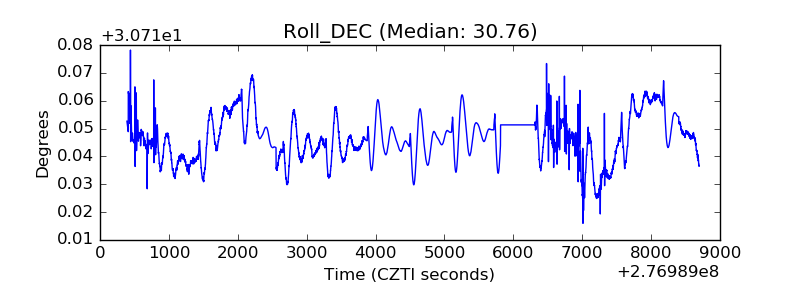 |
| _Roll_RA | 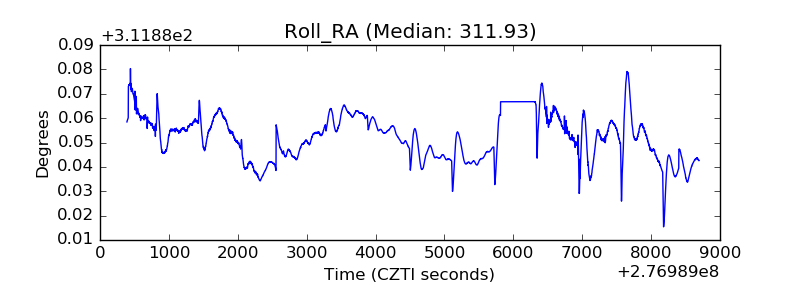 |
| Veto Counter | 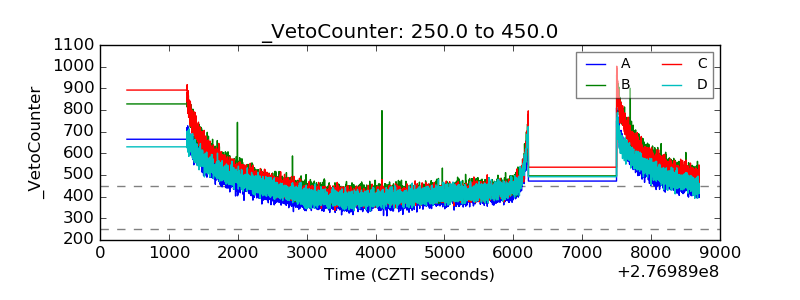 |