| Param | Original file | Final file |
|---|---|---|
| Filename | modeM0/AS1A05_069T03_9000002426_16428cztM0_level2.evt | modeM0/AS1A05_069T03_9000002426_16428cztM0_level2_quad_clean.evt |
| Size (bytes) | 459,135,360 | 82,324,800 |
| Size | 437.9 MB | 78.5 MB |
| Events in quadrant A | 3,262,214 | 522,158 |
| Events in quadrant B | 3,720,153 | 542,178 |
| Events in quadrant C | 3,178,497 | 509,213 |
| Events in quadrant D | 3,321,521 | 485,010 |
| Mode SS | |||
|---|---|---|---|
| Quadrant | BADHDUFLAG | Total packets | Discarded packets |
| A | 0 | 126 | 0 |
| B | 0 | 126 | 0 |
| C | 0 | 126 | 0 |
| D | 0 | 126 | 0 |
| Mode M0 | |||
|---|---|---|---|
| Quadrant | BADHDUFLAG | Total packets | Discarded packets |
| A | 0 | 13535 | 3 |
| B | 0 | 15043 | 2 |
| C | 0 | 13138 | 2 |
| D | 0 | 14057 | 2 |
| Mode M9 | |||
|---|---|---|---|
| Quadrant | BADHDUFLAG | Total packets | Discarded packets |
| A | 0 | 24 | 0 |
| B | 0 | 24 | 0 |
| C | 0 | 24 | 0 |
| D | 0 | 25 | 0 |
| Quadrant | Total seconds | Saturated seconds | Saturation percentage |
|---|---|---|---|
| A | 6225 | 66 | 1.060241% |
| B | 6225 | 89 | 1.429719% |
| C | 6225 | 53 | 0.851406% |
| D | 6225 | 55 | 0.883534% |
Noise dominated data is calculated using 1-second bins in cleaned event files. If a bin has >2000 counts, and if more than 50% of those come from <1% of pixels, then it is considered to be noise-dominated and hence unusable.
| Quadrant | # 1 sec bins | Bins with >0 counts | Bins with >2000 counts | High rate bins dominated by noise | Noise dominated (total time) | Noise dominated (detector-on time) | Marked lightcurve |
|---|---|---|---|---|---|---|---|
| A | 7566 | 6227 | 27 | 27 | 0.36% | 0.43% | 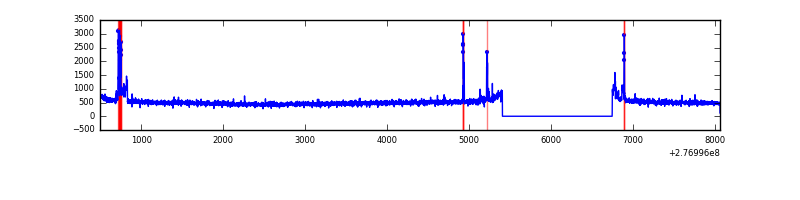 |
| B | 7566 | 6227 | 7 | 7 | 0.09% | 0.11% | 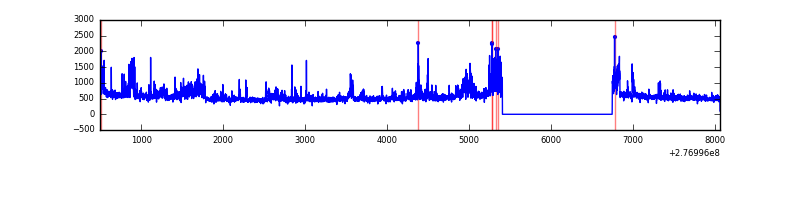 |
| C | 7566 | 6226 | 1 | 1 | 0.01% | 0.02% | 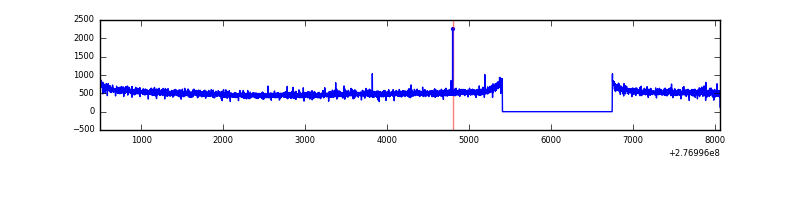 |
| D | 7566 | 6227 | 38 | 38 | 0.50% | 0.61% | 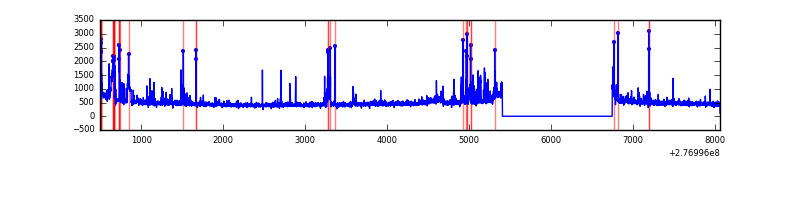 |
Top three noisy pixels from each quadrant. If the there are fewer than three noisy pixels in the level2.evt file, extra rows are filled as -1
| Pixel properties | Quadrant properties | ||||||
|---|---|---|---|---|---|---|---|
| Quadrant | DetID | PixID | Counts | Sigma | Mean | Median | Sigma |
| A | 15 | 174 | 180604 | 1140.8 | 793 | 778 | 157.6 |
| A | 15 | 223 | 27068 | 166.78 | 793 | 778 | 157.6 |
| A | 15 | 239 | 7898 | 45.17 | 793 | 778 | 157.6 |
| B | 15 | 35 | 283536 | 1861.13 | 807 | 788 | 151.9 |
| B | 0 | 189 | 107209 | 700.5 | 807 | 788 | 151.9 |
| B | 7 | 220 | 45343 | 293.27 | 807 | 788 | 151.9 |
| C | 14 | 238 | 118534 | 656.14 | 769 | 774 | 179.5 |
| C | 7 | 247 | 39428 | 215.37 | 769 | 774 | 179.5 |
| C | 3 | 233 | 19978 | 107.0 | 769 | 774 | 179.5 |
| D | 12 | 218 | 154508 | 826.79 | 763 | 741 | 186.0 |
| D | 15 | 0 | 137743 | 736.65 | 763 | 741 | 186.0 |
| D | 12 | 110 | 55107 | 292.32 | 763 | 741 | 186.0 |
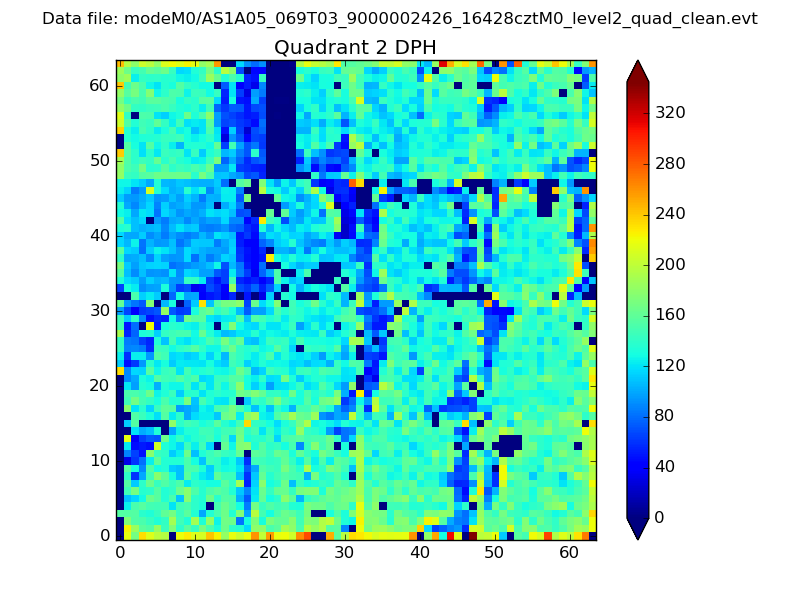
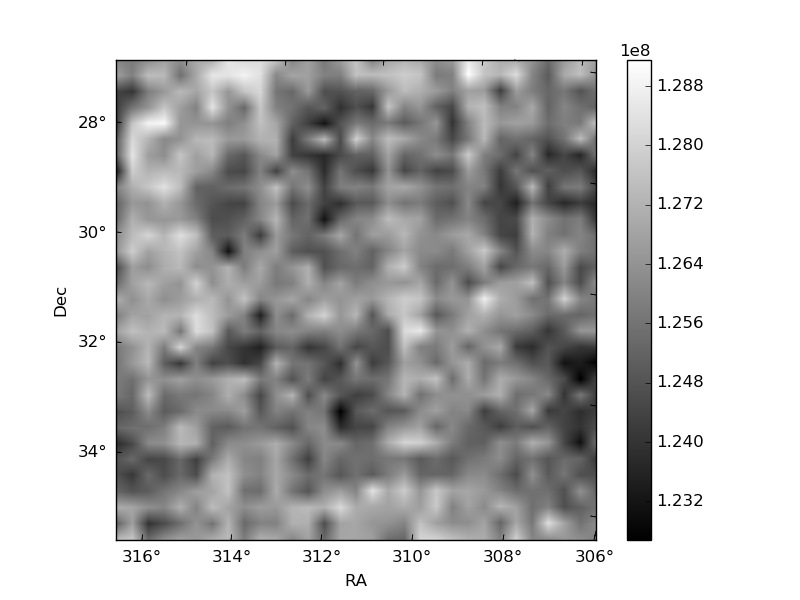
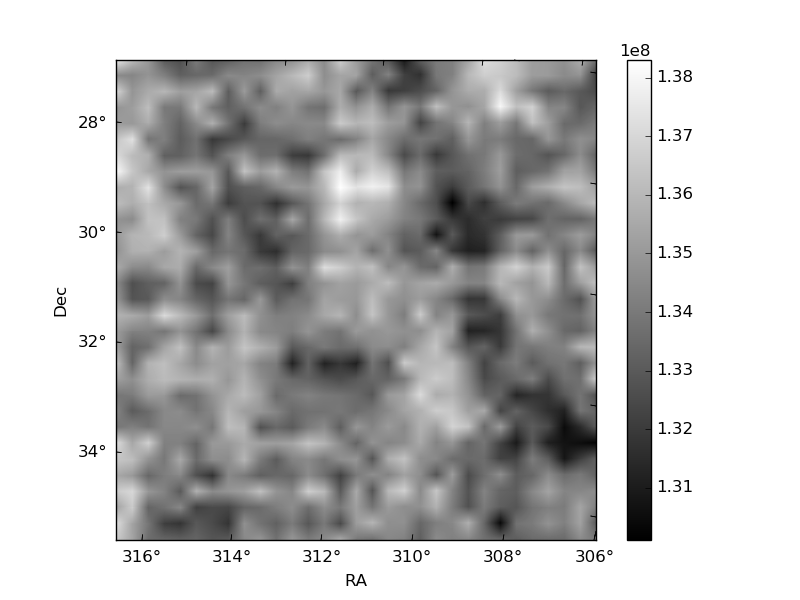
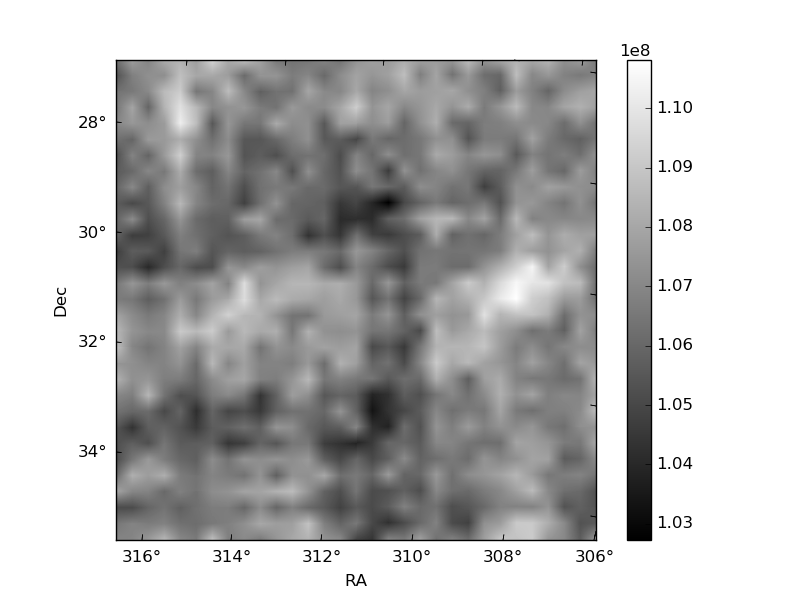
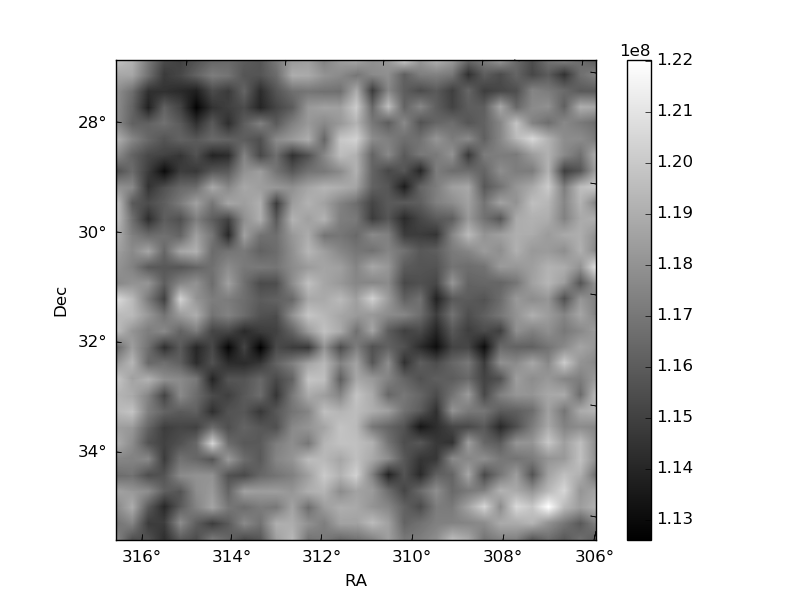
Histogram calculated using DETX and DETY for each event in the final _common_clean file
| Quadrant A | 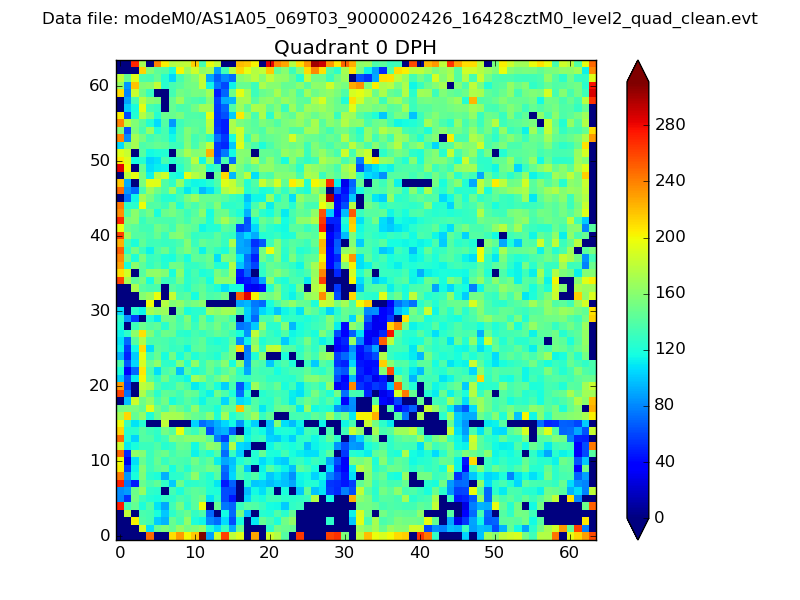 |
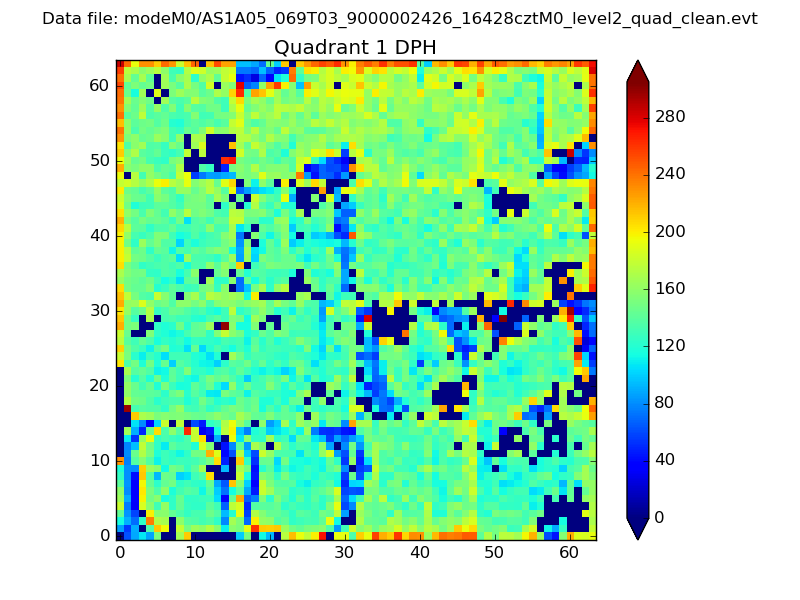 |
Quadrant B |
|---|---|---|---|
| Quadrant D | 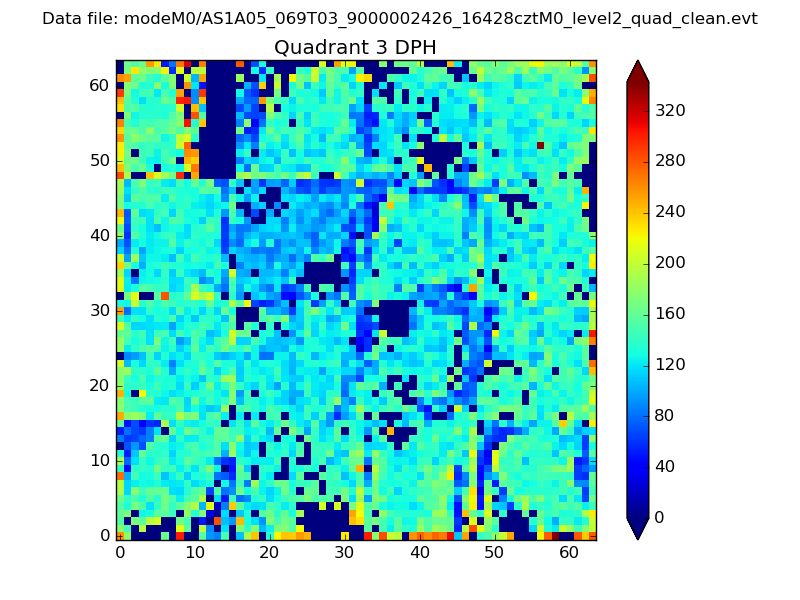 |
 |
Quadrant C |
| Plot type | Count rate plots | Images |
|---|---|---|
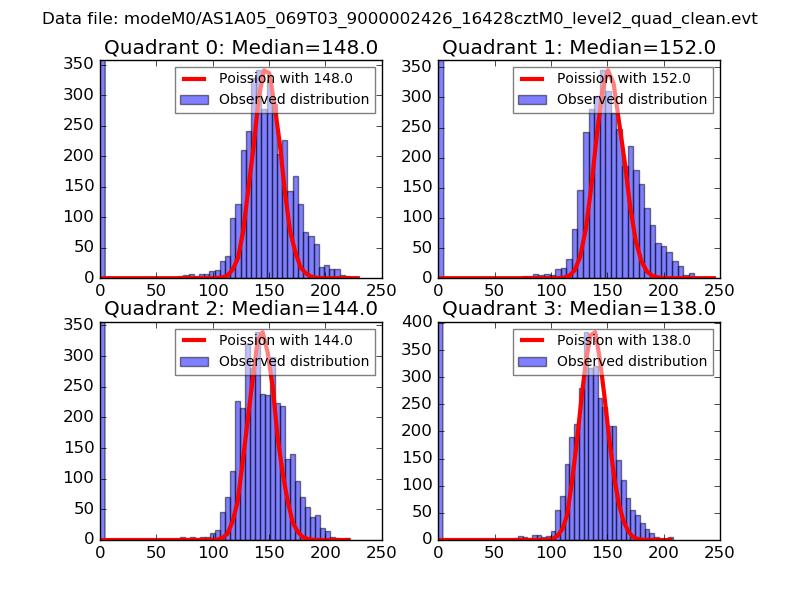
| Comparison with Poisson distribution Blue bars denote a histogram of data divided into 1 sec bins. Red curve is a Poisson curve with rate = median count rate of data. |
 |
 |
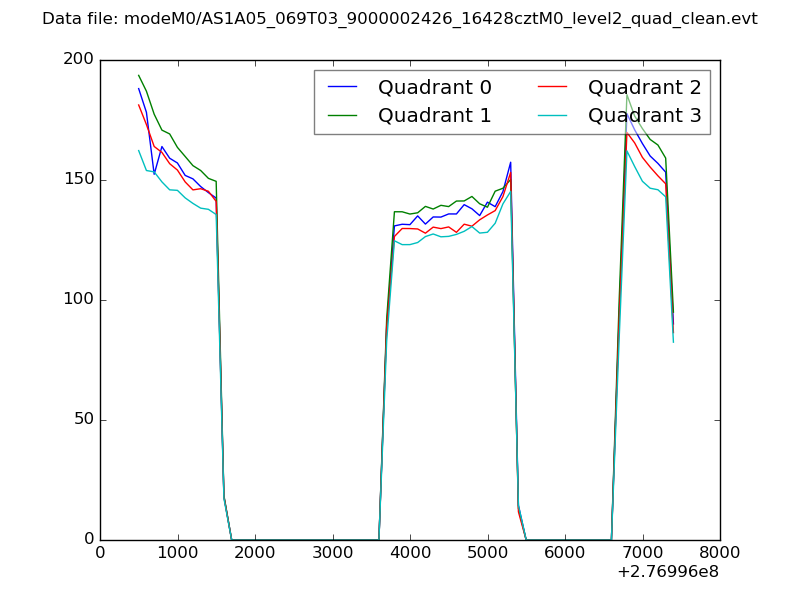
| Quadrant-wise count rates Data is divided into 100 sec bins |
 |
|
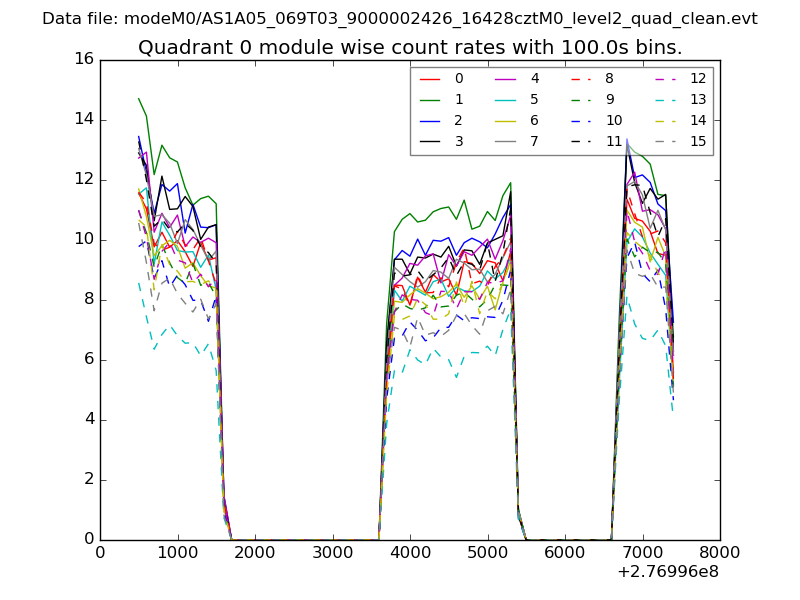
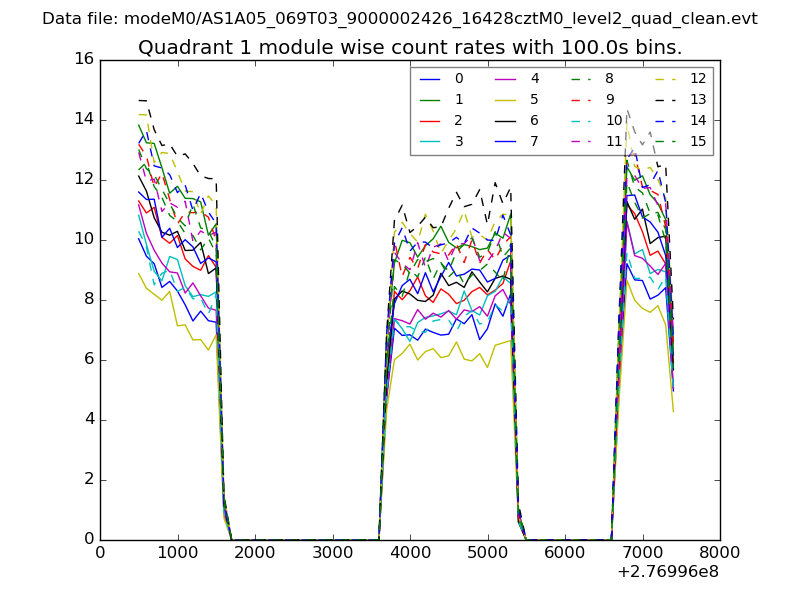
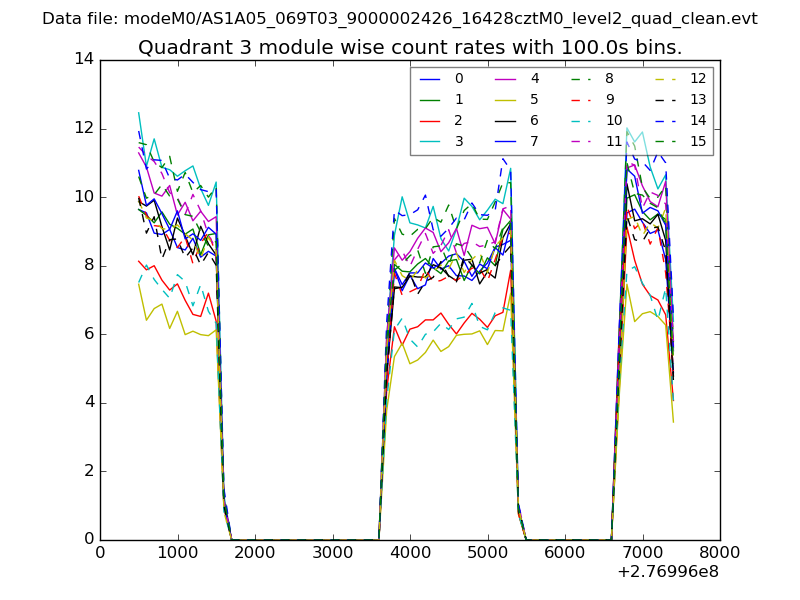
| Module-wise count rates for Quadrant A Data is divided into 100 sec bins |
 |
 |
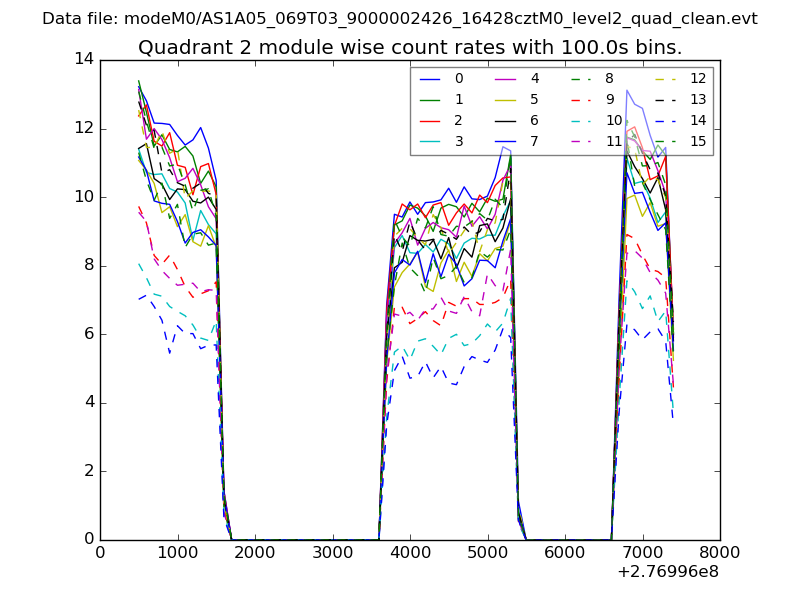
| Module-wise count rates for Quadrant B Data is divided into 100 sec bins |
 |
 |
| Module-wise count rates for Quadrant C Data is divided into 100 sec bins |
 |
 |
| Module-wise count rates for Quadrant D Data is divided into 100 sec bins |
 |
 |
| Parameter | Plot |
|---|---|
| CZT HV Monitor | 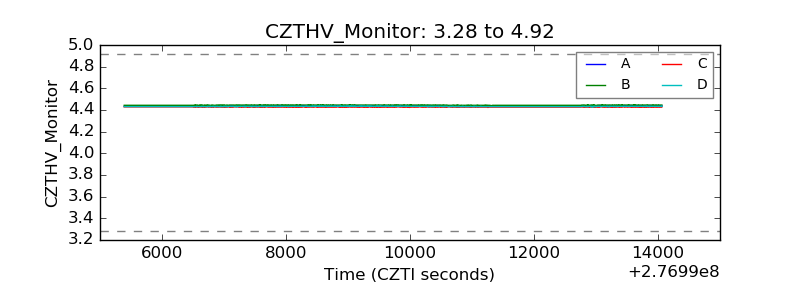 |
| D_VDD | 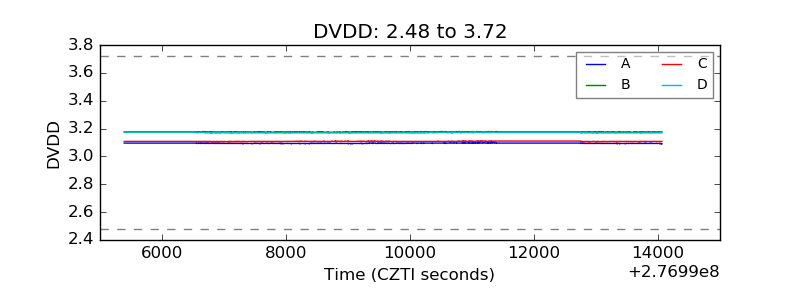 |
| Temperature 1 |  |
| Veto HV Monitor | 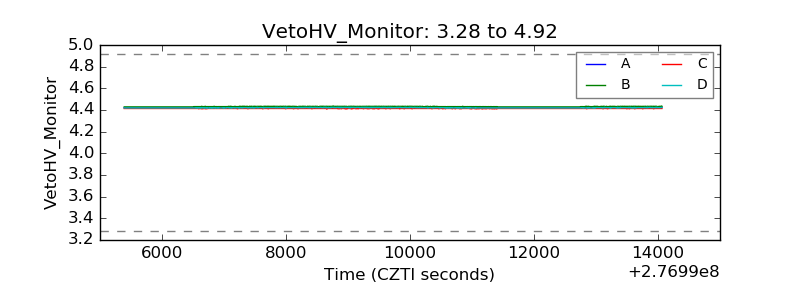 |
| Veto LLD | 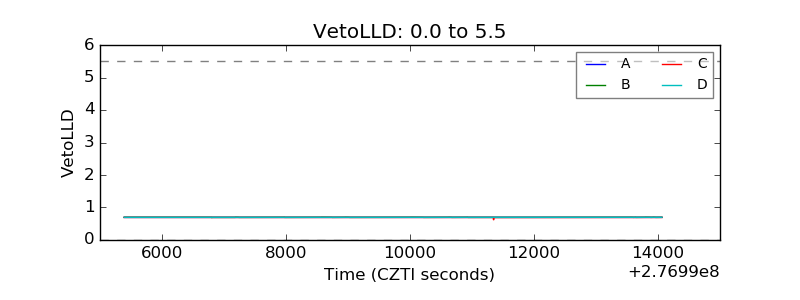 |
| Alpha Counter | 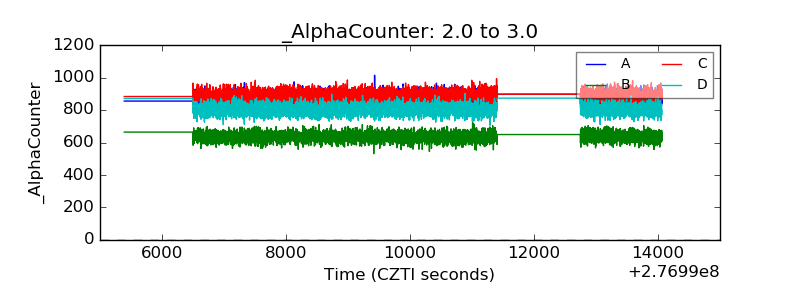 |
| _CPM_Rate | 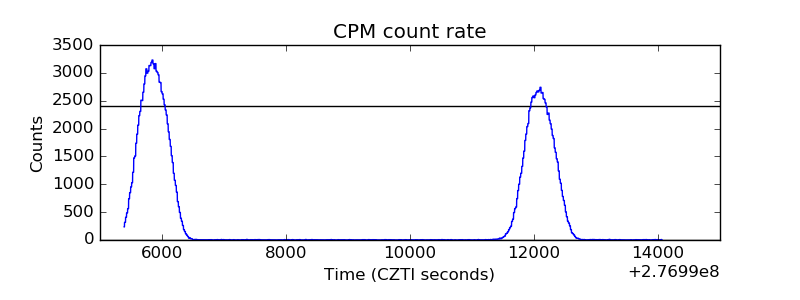 |
| CZT Counter | 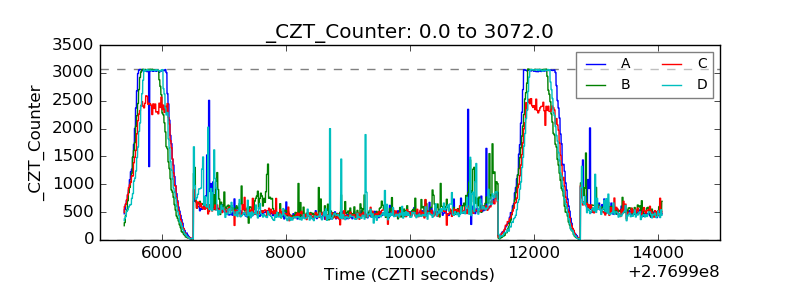 |
| +2.5 Volts monitor |  |
| +5 Volts monitor |  |
| _ROLL_ROT | 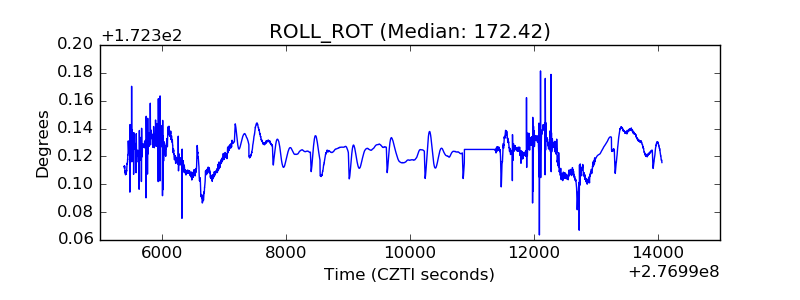 |
| _Roll_DEC | 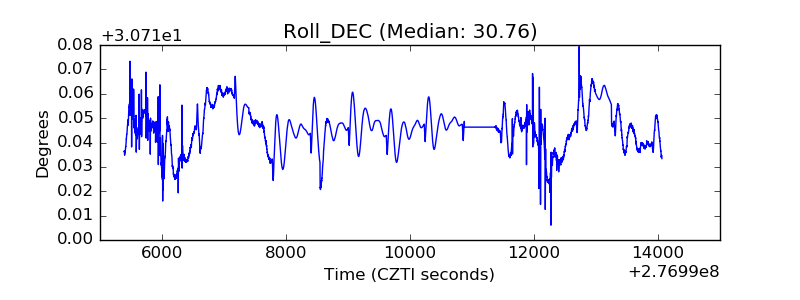 |
| _Roll_RA | 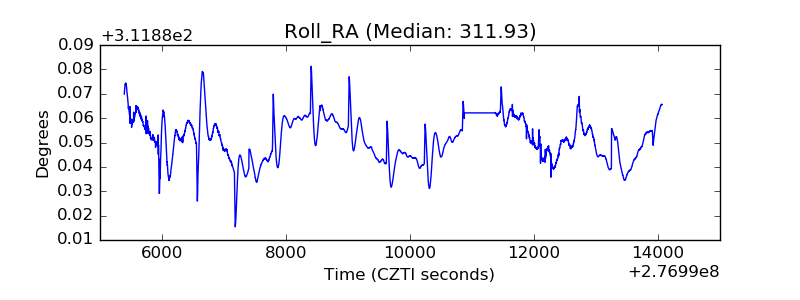 |
| Veto Counter | 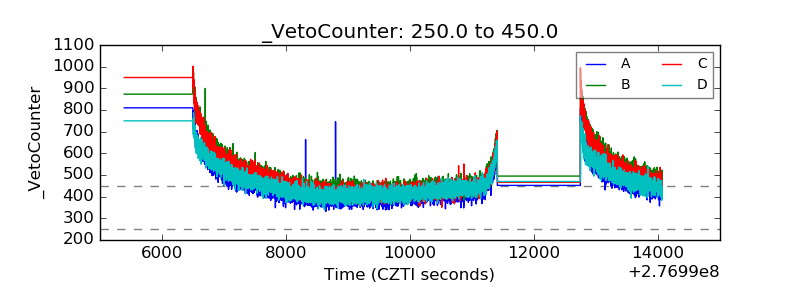 |