| Param | Original file | Final file |
|---|---|---|
| Filename | modeM0/AS1A05_069T03_9000002426_16429cztM0_level2.evt | modeM0/AS1A05_069T03_9000002426_16429cztM0_level2_quad_clean.evt |
| Size (bytes) | 471,844,800 | 74,914,560 |
| Size | 450.0 MB | 71.4 MB |
| Events in quadrant A | 3,269,152 | 465,632 |
| Events in quadrant B | 3,692,228 | 478,064 |
| Events in quadrant C | 3,339,775 | 448,867 |
| Events in quadrant D | 3,551,724 | 426,941 |
| Mode SS | |||
|---|---|---|---|
| Quadrant | BADHDUFLAG | Total packets | Discarded packets |
| A | 0 | 134 | 0 |
| B | 0 | 134 | 0 |
| C | 0 | 134 | 0 |
| D | 0 | 134 | 0 |
| Mode M0 | |||
|---|---|---|---|
| Quadrant | BADHDUFLAG | Total packets | Discarded packets |
| A | 0 | 13535 | 3 |
| B | 0 | 14791 | 2 |
| C | 0 | 13800 | 2 |
| D | 0 | 14846 | 2 |
| Mode M9 | |||
|---|---|---|---|
| Quadrant | BADHDUFLAG | Total packets | Discarded packets |
| A | 0 | 26 | 0 |
| B | 0 | 26 | 0 |
| C | 0 | 26 | 0 |
| D | 0 | 26 | 0 |
| Quadrant | Total seconds | Saturated seconds | Saturation percentage |
|---|---|---|---|
| A | 6428 | 99 | 1.540137% |
| B | 6428 | 174 | 2.706907% |
| C | 6428 | 119 | 1.851276% |
| D | 6428 | 141 | 2.193528% |
Noise dominated data is calculated using 1-second bins in cleaned event files. If a bin has >2000 counts, and if more than 50% of those come from <1% of pixels, then it is considered to be noise-dominated and hence unusable.
| Quadrant | # 1 sec bins | Bins with >0 counts | Bins with >2000 counts | High rate bins dominated by noise | Noise dominated (total time) | Noise dominated (detector-on time) | Marked lightcurve |
|---|---|---|---|---|---|---|---|
| A | 9049 | 6431 | 3 | 3 | 0.03% | 0.05% | 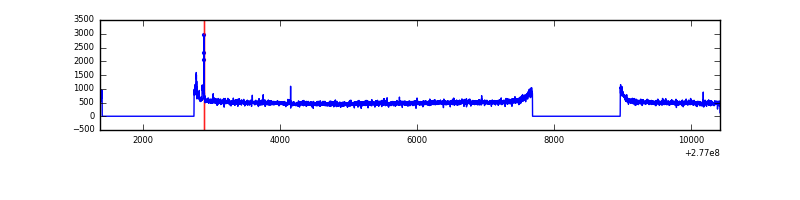 |
| B | 9049 | 6431 | 22 | 22 | 0.24% | 0.34% | 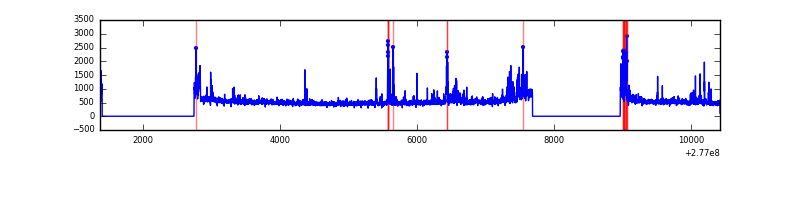 |
| C | 9049 | 6430 | 0 | 0 | 0.00% | 0.00% | 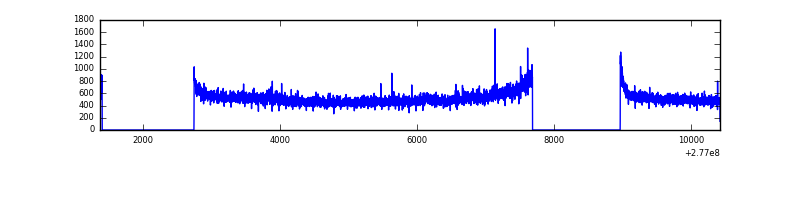 |
| D | 9049 | 6431 | 39 | 39 | 0.43% | 0.61% | 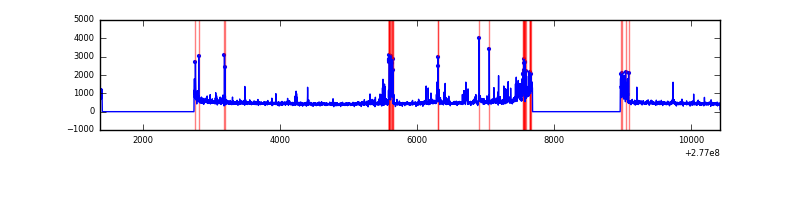 |
Top three noisy pixels from each quadrant. If the there are fewer than three noisy pixels in the level2.evt file, extra rows are filled as -1
| Pixel properties | Quadrant properties | ||||||
|---|---|---|---|---|---|---|---|
| Quadrant | DetID | PixID | Counts | Sigma | Mean | Median | Sigma |
| A | 15 | 174 | 45407 | 269.48 | 828 | 812 | 165.5 |
| A | 15 | 223 | 31303 | 184.25 | 828 | 812 | 165.5 |
| A | 15 | 239 | 8507 | 46.5 | 828 | 812 | 165.5 |
| B | 15 | 35 | 179174 | 1131.17 | 836 | 815 | 157.7 |
| B | 0 | 189 | 78684 | 493.85 | 836 | 815 | 157.7 |
| B | 0 | 198 | 45260 | 281.88 | 836 | 815 | 157.7 |
| C | 14 | 238 | 122036 | 656.78 | 794 | 801 | 184.6 |
| C | 3 | 233 | 92720 | 497.97 | 794 | 801 | 184.6 |
| C | 7 | 247 | 27942 | 147.03 | 794 | 801 | 184.6 |
| D | 5 | 222 | 333398 | 1730.42 | 788 | 764 | 192.2 |
| D | 12 | 218 | 84848 | 437.42 | 788 | 764 | 192.2 |
| D | 2 | 122 | 77625 | 399.85 | 788 | 764 | 192.2 |
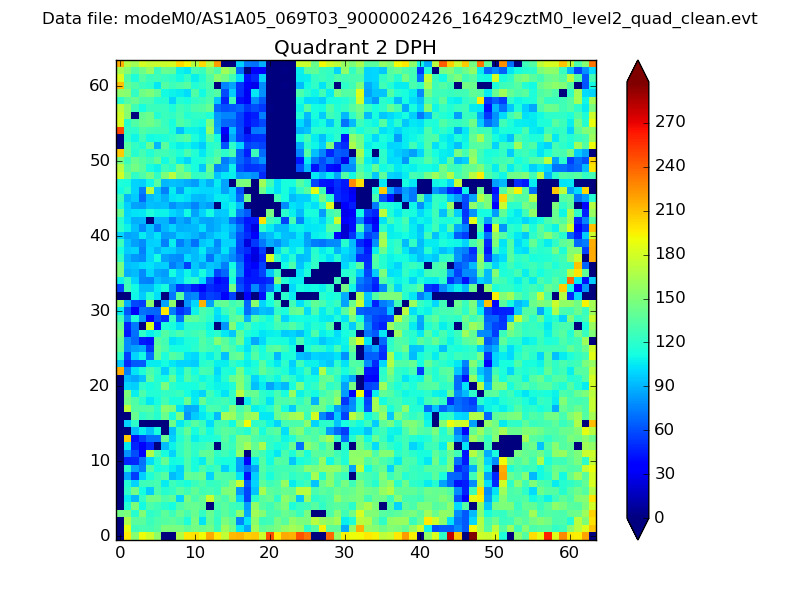
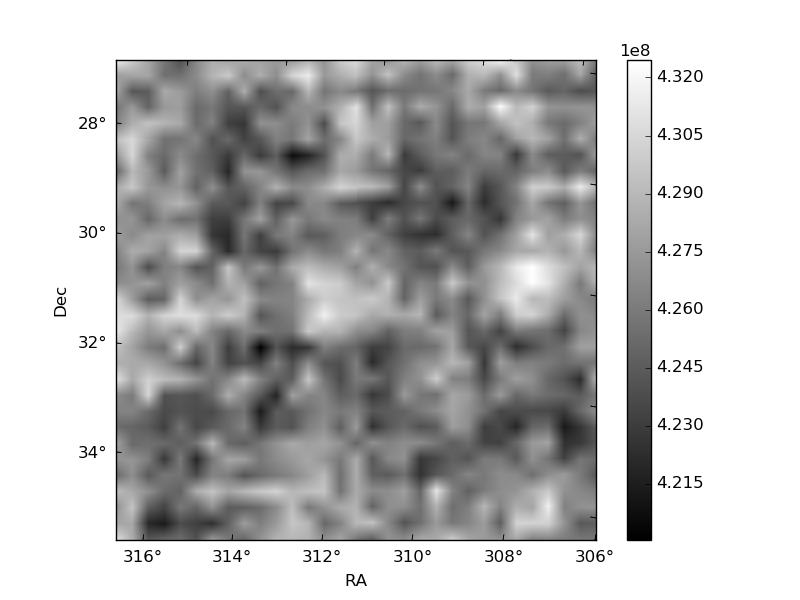
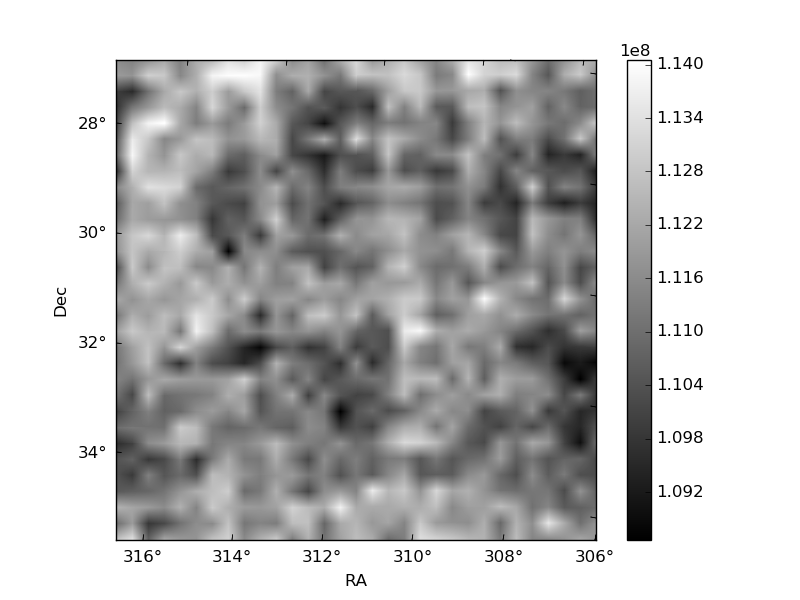
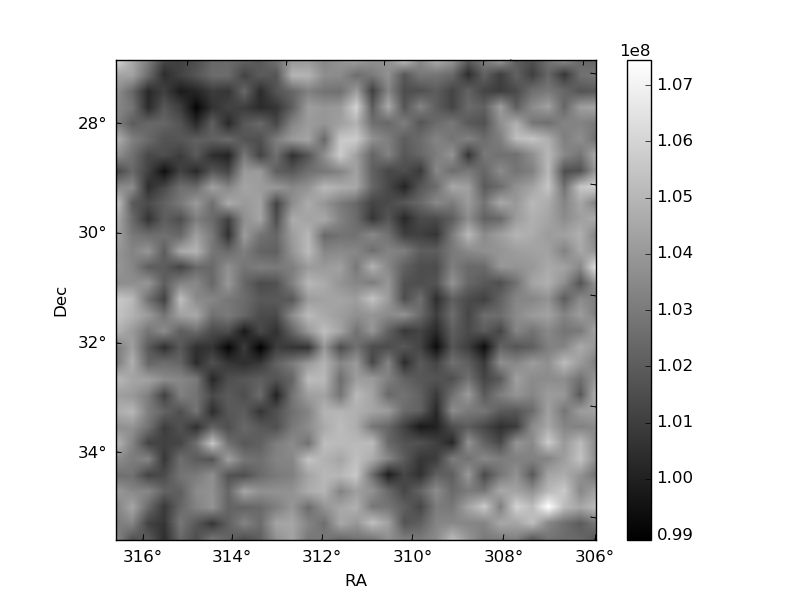
Histogram calculated using DETX and DETY for each event in the final _common_clean file
| Quadrant A | 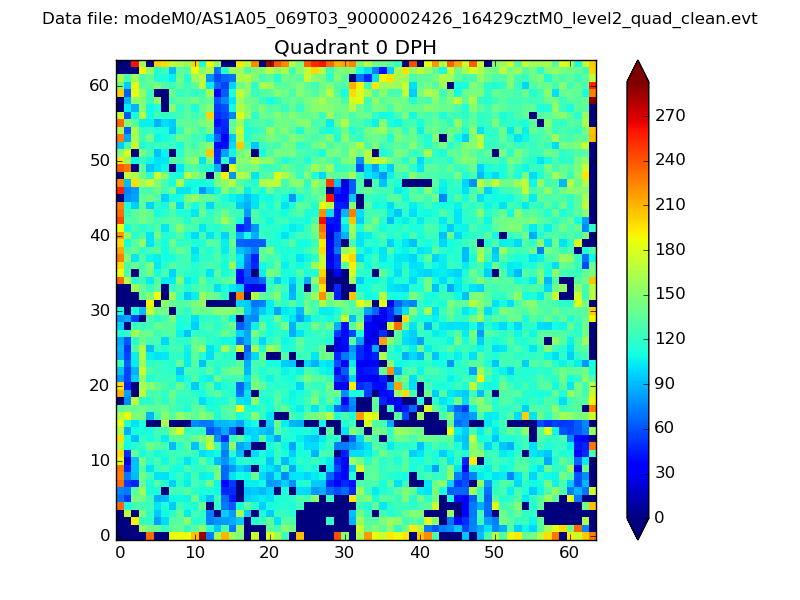 |
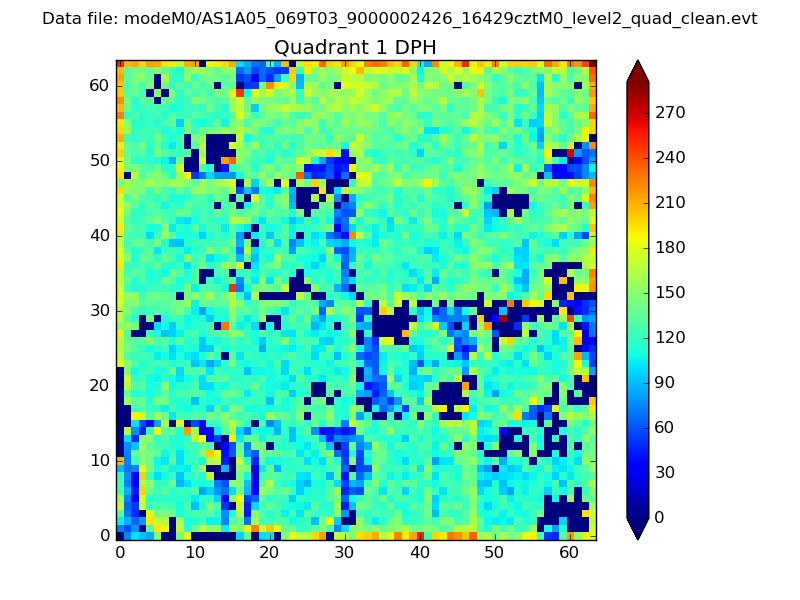 |
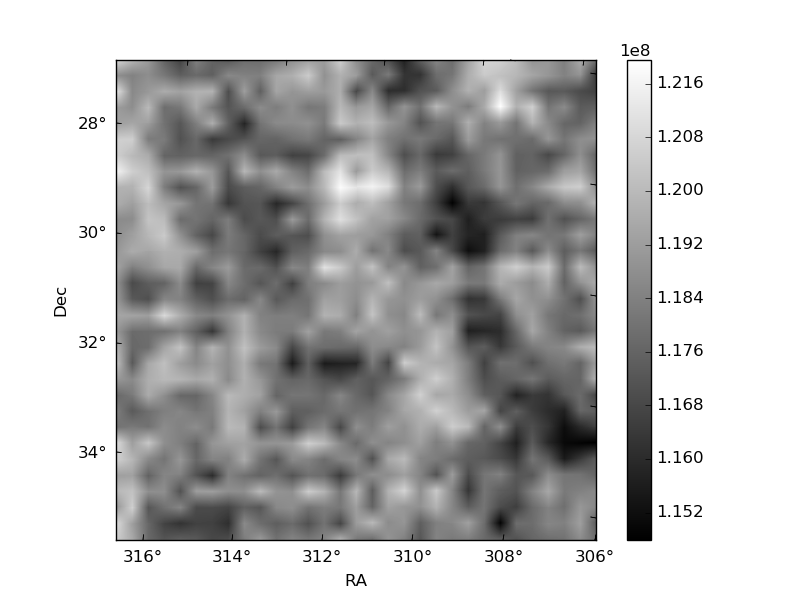
Quadrant B |
|---|---|---|---|
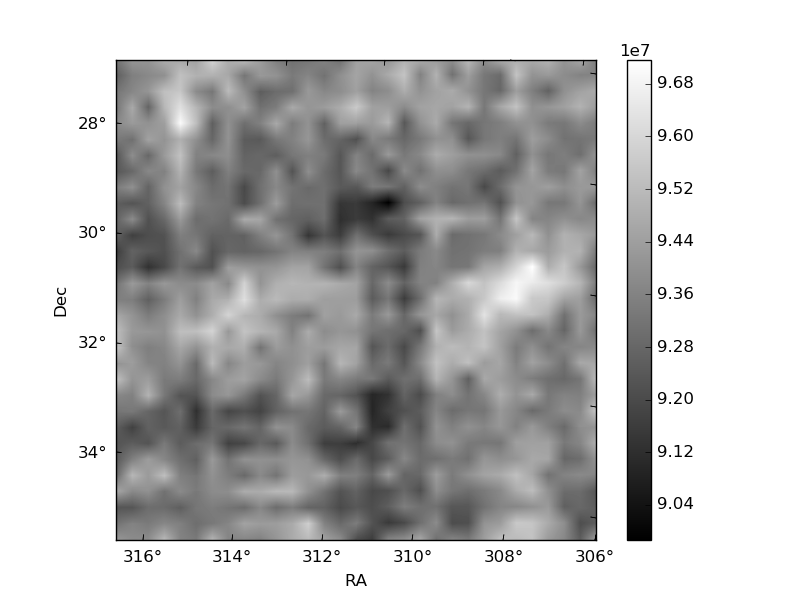
| Quadrant D | 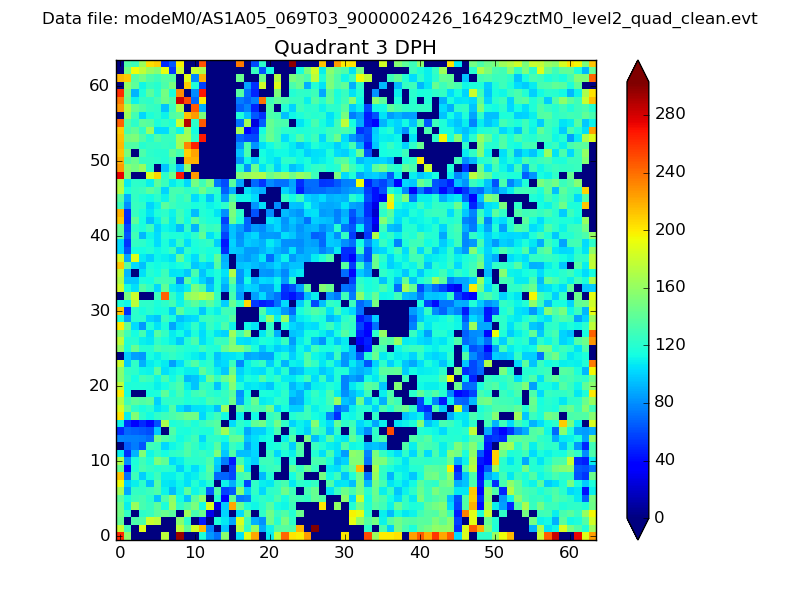 |
 |
Quadrant C |
| Plot type | Count rate plots | Images |
|---|---|---|
| Comparison with Poisson distribution Blue bars denote a histogram of data divided into 1 sec bins. Red curve is a Poisson curve with rate = median count rate of data. |
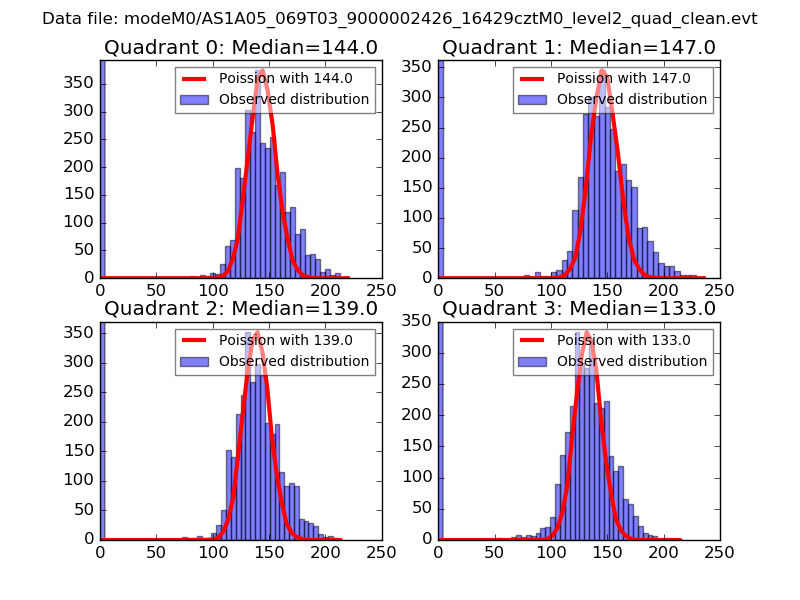 |
 |
| Quadrant-wise count rates Data is divided into 100 sec bins |
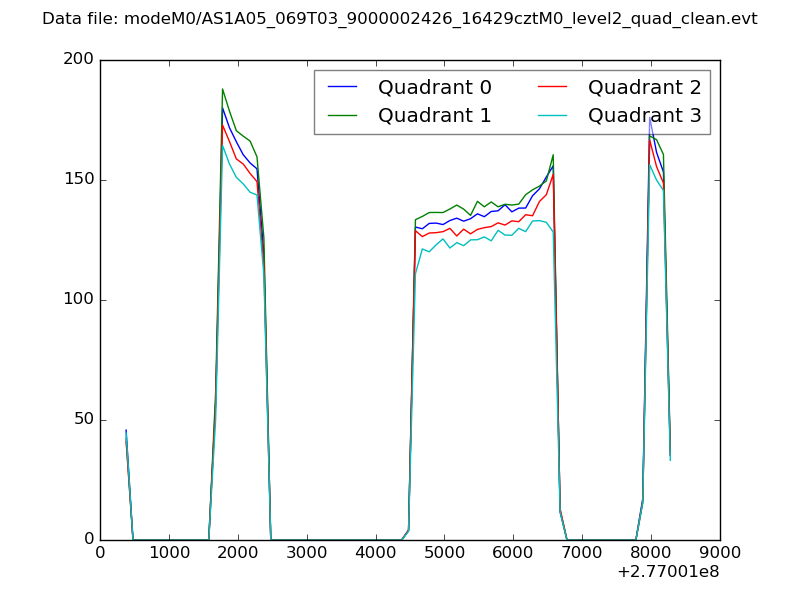 |
|
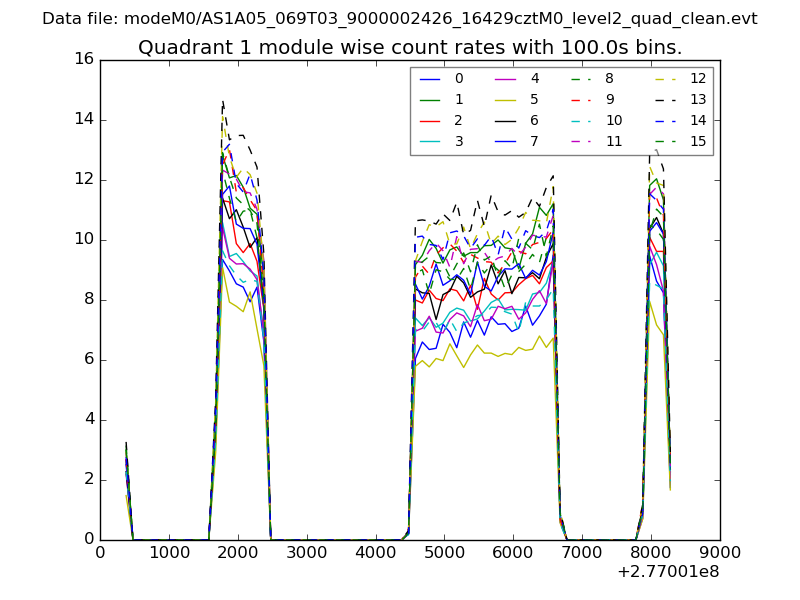
| Module-wise count rates for Quadrant A Data is divided into 100 sec bins |
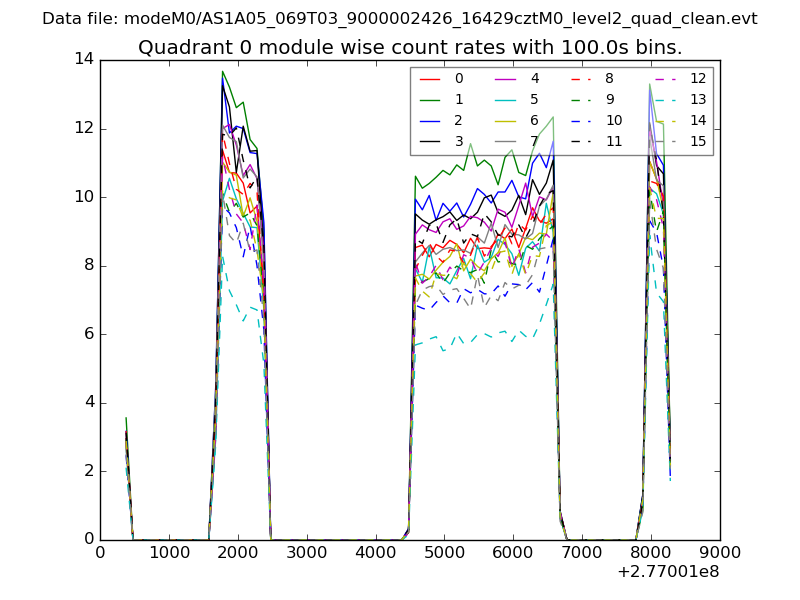 |
 |
| Module-wise count rates for Quadrant B Data is divided into 100 sec bins |
 |
 |
| Module-wise count rates for Quadrant C Data is divided into 100 sec bins |
 |
 |
| Module-wise count rates for Quadrant D Data is divided into 100 sec bins |
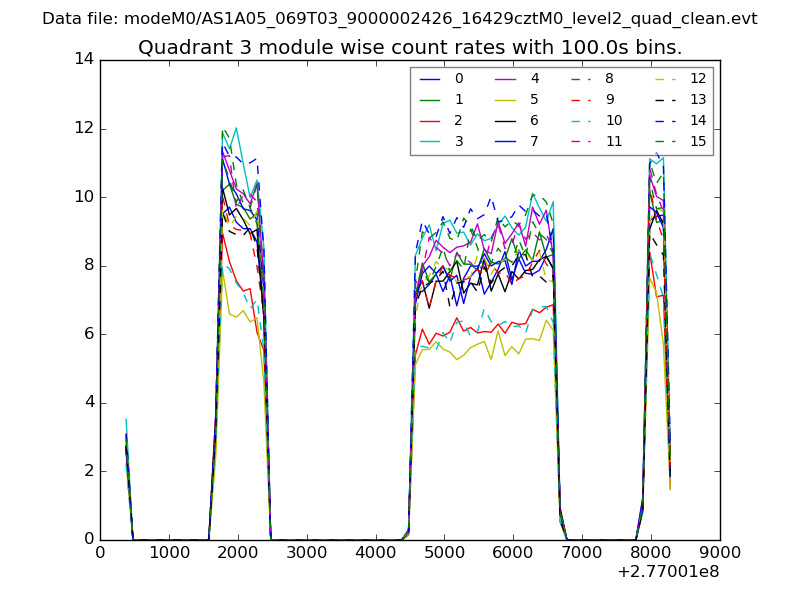 |
 |
| Parameter | Plot |
|---|---|
| CZT HV Monitor | 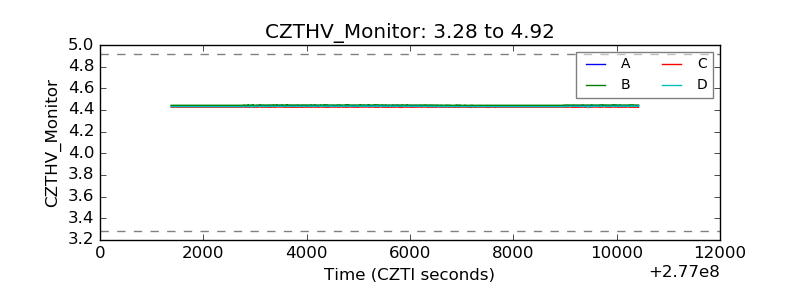 |
| D_VDD | 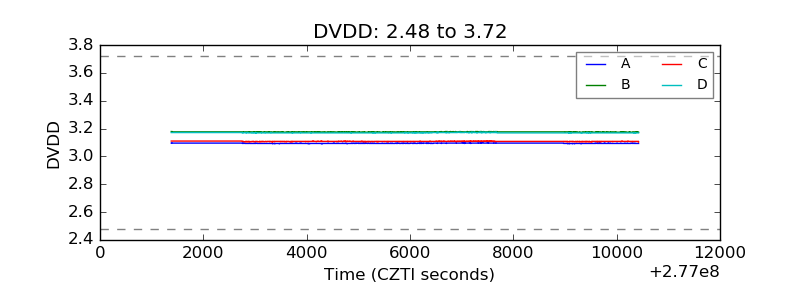 |
| Temperature 1 | 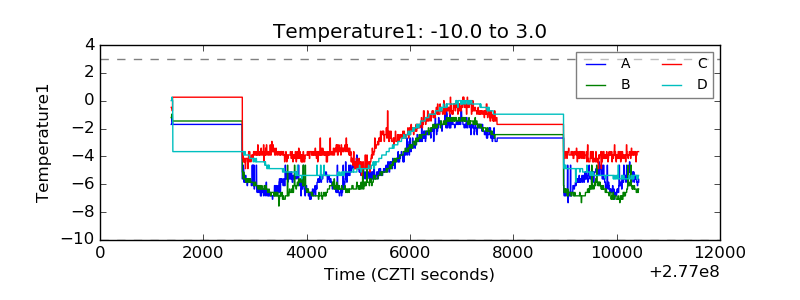 |
| Veto HV Monitor | 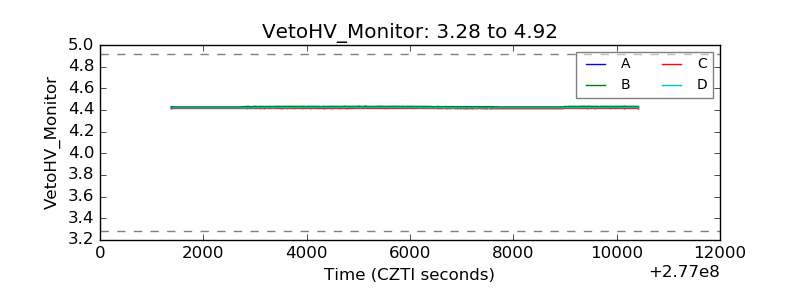 |
| Veto LLD | 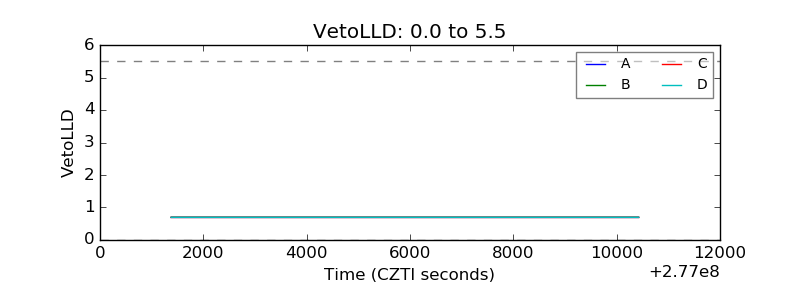 |
| Alpha Counter | 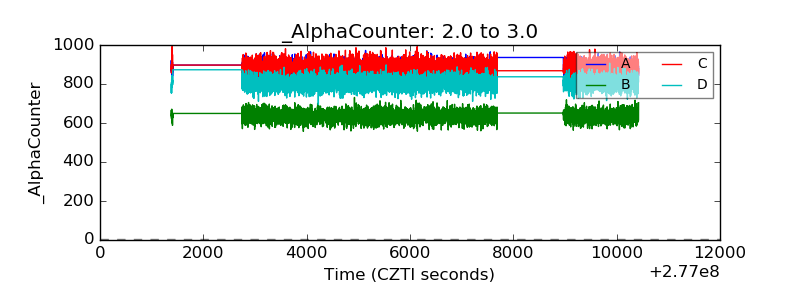 |
| _CPM_Rate | 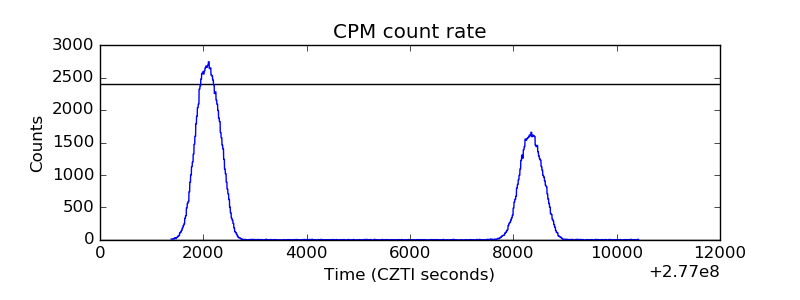 |
| CZT Counter | 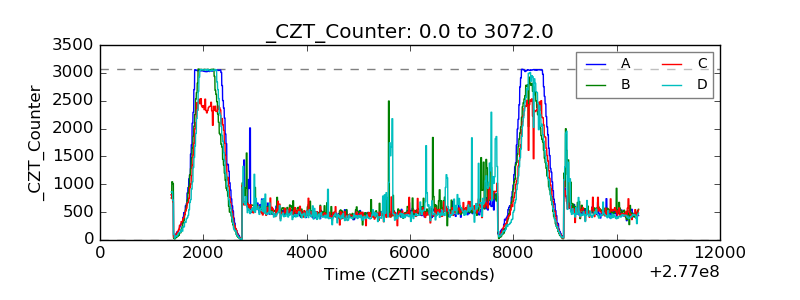 |
| +2.5 Volts monitor | 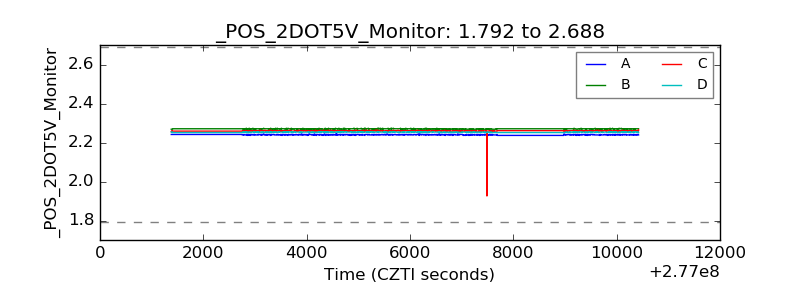 |
| +5 Volts monitor |  |
| _ROLL_ROT | 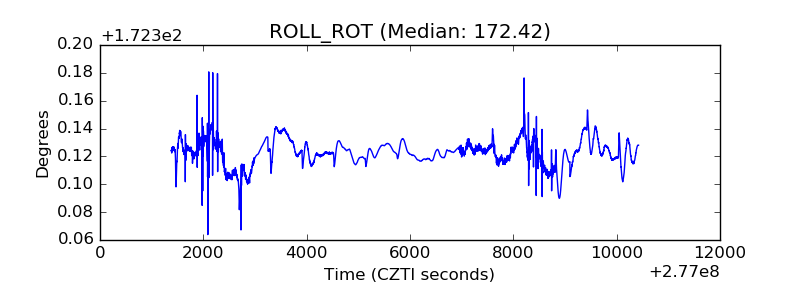 |
| _Roll_DEC | 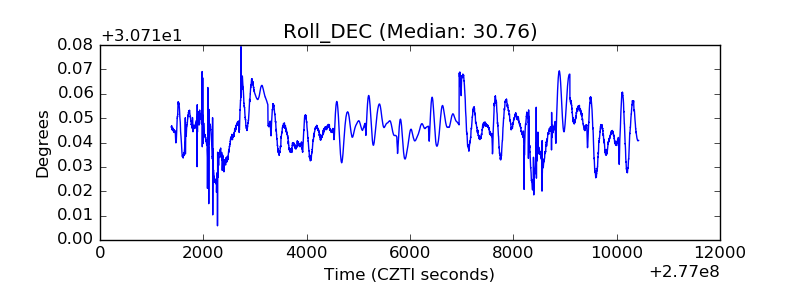 |
| _Roll_RA | 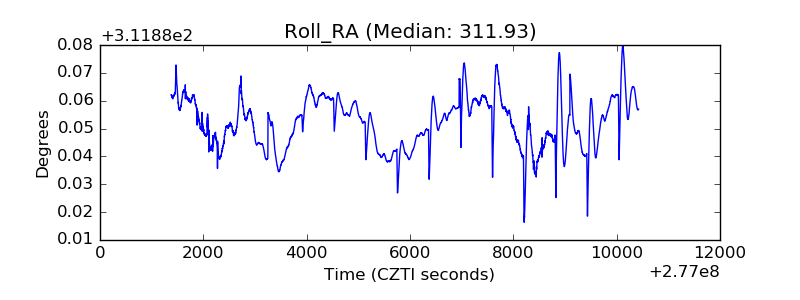 |
| Veto Counter | 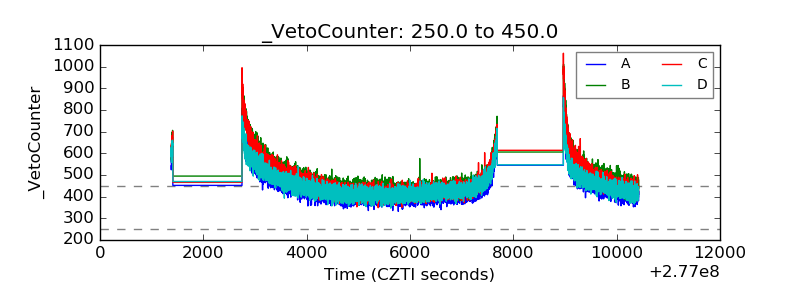 |