| Param | Original file | Final file |
|---|---|---|
| Filename | modeM0/AS1A05_069T03_9000002426_16431cztM0_level2.evt | modeM0/AS1A05_069T03_9000002426_16431cztM0_level2_quad_clean.evt |
| Size (bytes) | 499,659,840 | 74,473,920 |
| Size | 476.5 MB | 71.0 MB |
| Events in quadrant A | 3,345,118 | 453,820 |
| Events in quadrant B | 3,811,199 | 460,484 |
| Events in quadrant C | 3,345,515 | 440,358 |
| Events in quadrant D | 4,166,250 | 423,924 |
| Mode SS | |||
|---|---|---|---|
| Quadrant | BADHDUFLAG | Total packets | Discarded packets |
| A | 0 | 142 | 0 |
| B | 0 | 142 | 0 |
| C | 0 | 142 | 0 |
| D | 0 | 142 | 0 |
| Mode M0 | |||
|---|---|---|---|
| Quadrant | BADHDUFLAG | Total packets | Discarded packets |
| A | 0 | 14228 | 4 |
| B | 0 | 15541 | 3 |
| C | 0 | 14237 | 3 |
| D | 0 | 17088 | 3 |
| Mode M9 | |||
|---|---|---|---|
| Quadrant | BADHDUFLAG | Total packets | Discarded packets |
| A | 0 | 19 | 0 |
| B | 0 | 19 | 0 |
| C | 0 | 19 | 0 |
| D | 0 | 19 | 0 |
| Quadrant | Total seconds | Saturated seconds | Saturation percentage |
|---|---|---|---|
| A | 6831 | 160 | 2.342263% |
| B | 6831 | 211 | 3.088860% |
| C | 6831 | 167 | 2.444737% |
| D | 6831 | 173 | 2.532572% |
Noise dominated data is calculated using 1-second bins in cleaned event files. If a bin has >2000 counts, and if more than 50% of those come from <1% of pixels, then it is considered to be noise-dominated and hence unusable.
| Quadrant | # 1 sec bins | Bins with >0 counts | Bins with >2000 counts | High rate bins dominated by noise | Noise dominated (total time) | Noise dominated (detector-on time) | Marked lightcurve |
|---|---|---|---|---|---|---|---|
| A | 8797 | 6833 | 0 | 0 | 0.00% | 0.00% | 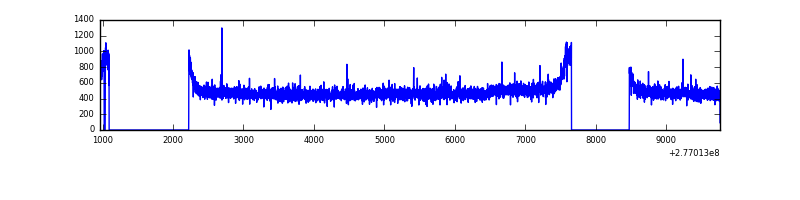 |
| B | 8797 | 6833 | 7 | 7 | 0.08% | 0.10% | 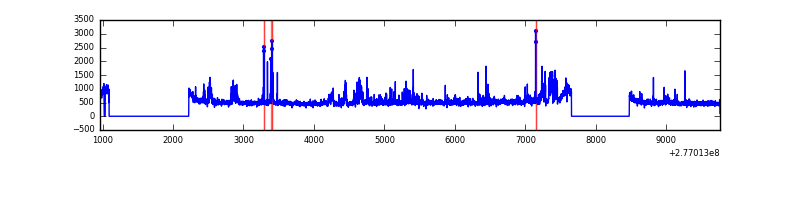 |
| C | 8797 | 6833 | 0 | 0 | 0.00% | 0.00% | 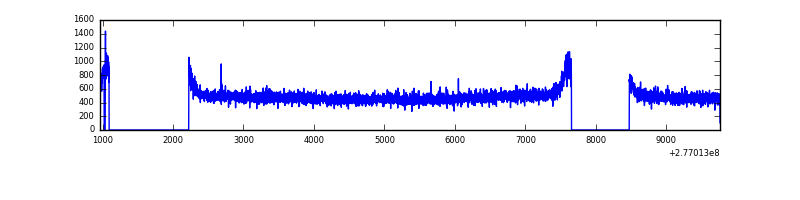 |
| D | 8797 | 6833 | 27 | 27 | 0.31% | 0.40% | 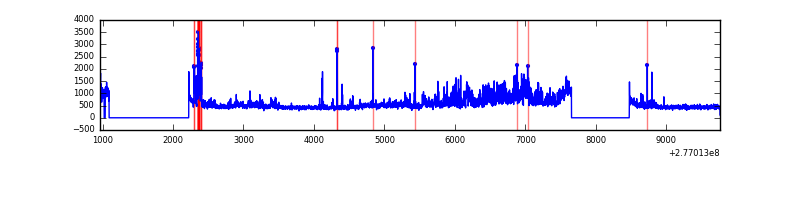 |
Top three noisy pixels from each quadrant. If the there are fewer than three noisy pixels in the level2.evt file, extra rows are filled as -1
| Pixel properties | Quadrant properties | ||||||
|---|---|---|---|---|---|---|---|
| Quadrant | DetID | PixID | Counts | Sigma | Mean | Median | Sigma |
| A | 15 | 223 | 38795 | 218.7 | 852 | 832 | 173.6 |
| A | 15 | 239 | 19694 | 108.66 | 852 | 832 | 173.6 |
| A | 15 | 174 | 10611 | 56.34 | 852 | 832 | 173.6 |
| B | 15 | 35 | 250767 | 1527.32 | 853 | 830 | 163.6 |
| B | 4 | 173 | 63359 | 382.1 | 853 | 830 | 163.6 |
| B | 0 | 198 | 63200 | 381.13 | 853 | 830 | 163.6 |
| C | 14 | 238 | 124511 | 644.51 | 815 | 822 | 191.9 |
| C | 7 | 247 | 29458 | 149.21 | 815 | 822 | 191.9 |
| C | 3 | 233 | 14416 | 70.83 | 815 | 822 | 191.9 |
| D | 5 | 222 | 849547 | 4254.52 | 819 | 796 | 199.5 |
| D | 12 | 218 | 156966 | 782.83 | 819 | 796 | 199.5 |
| D | 2 | 234 | 24687 | 119.76 | 819 | 796 | 199.5 |
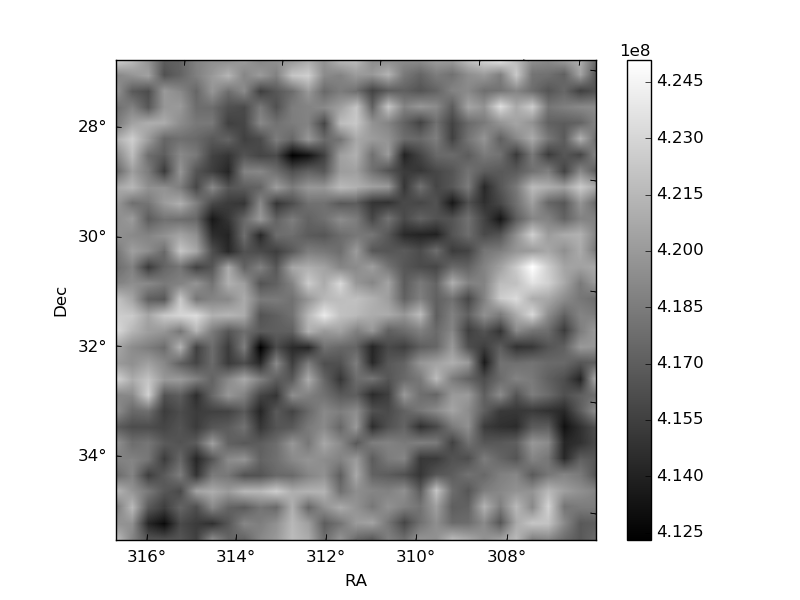
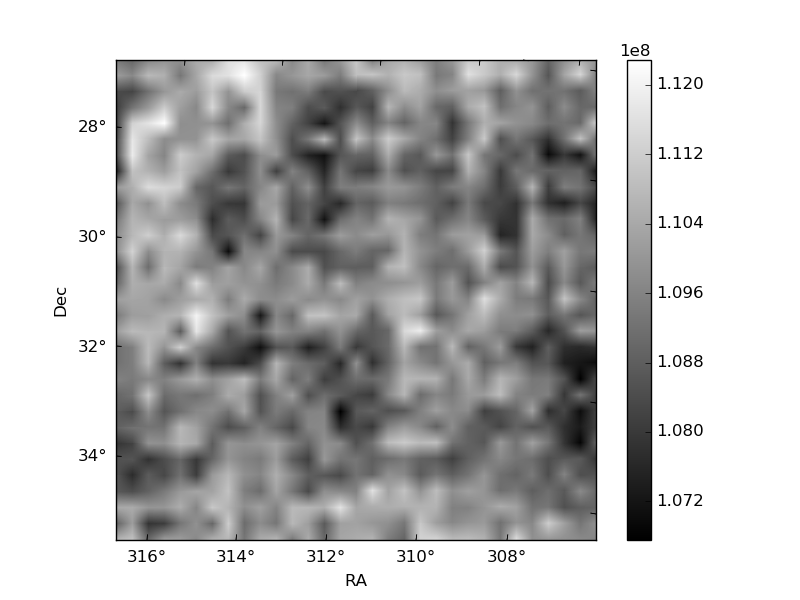
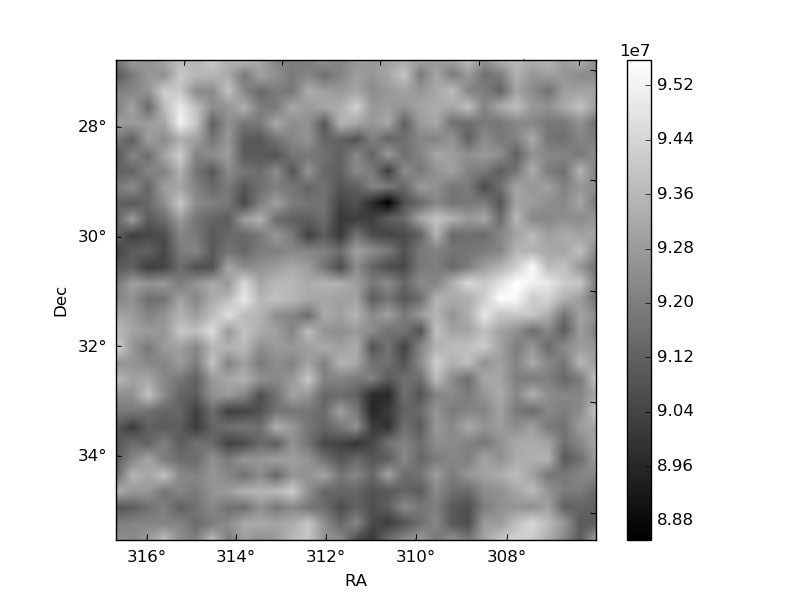
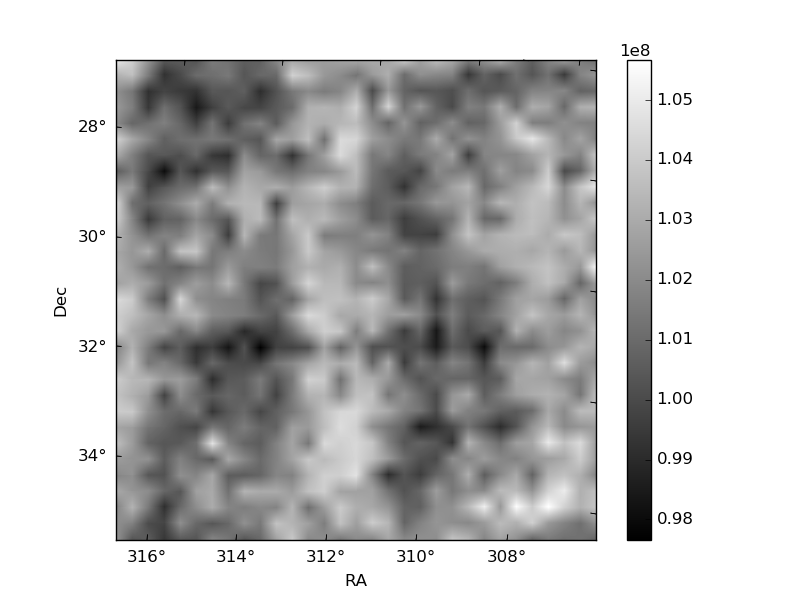
Histogram calculated using DETX and DETY for each event in the final _common_clean file
| Quadrant A | 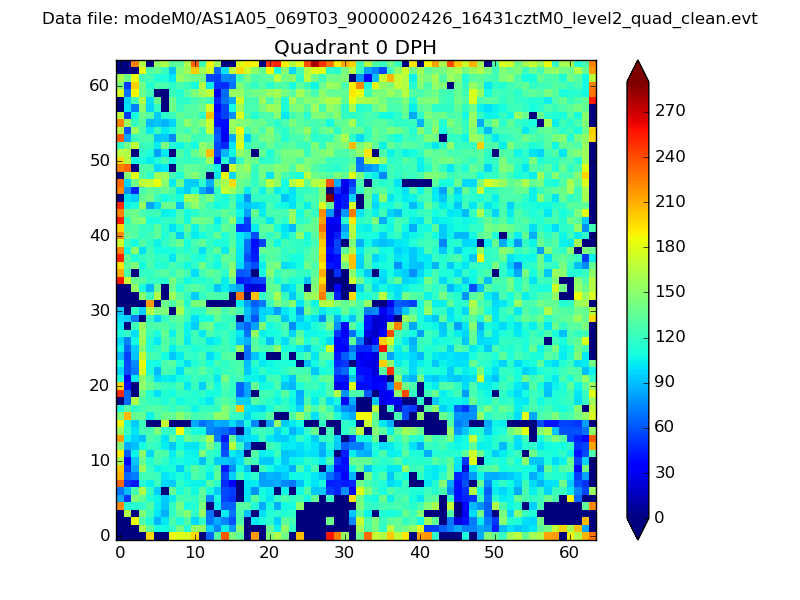 |
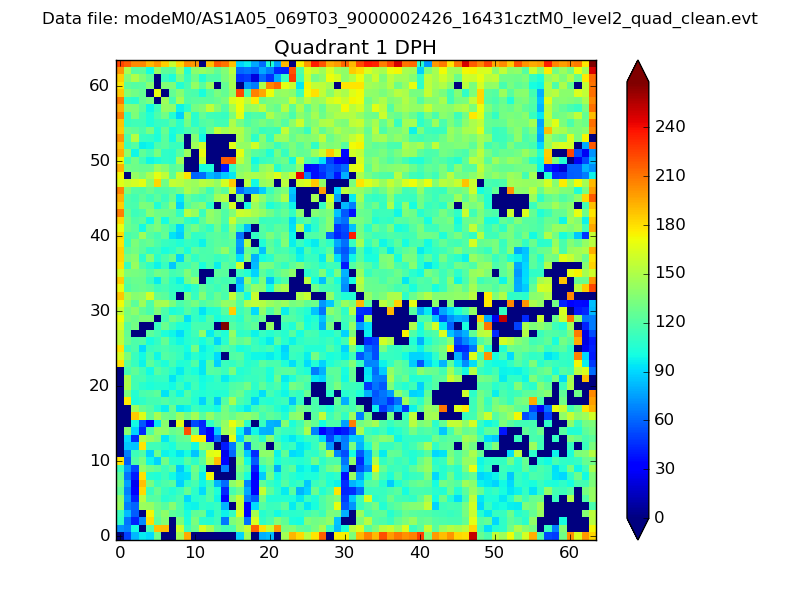 |
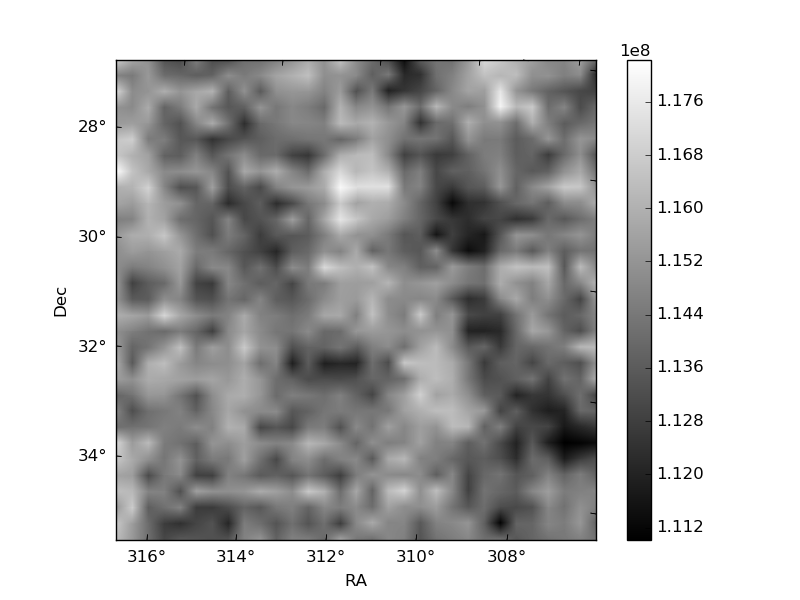
Quadrant B |
|---|---|---|---|
| Quadrant D | 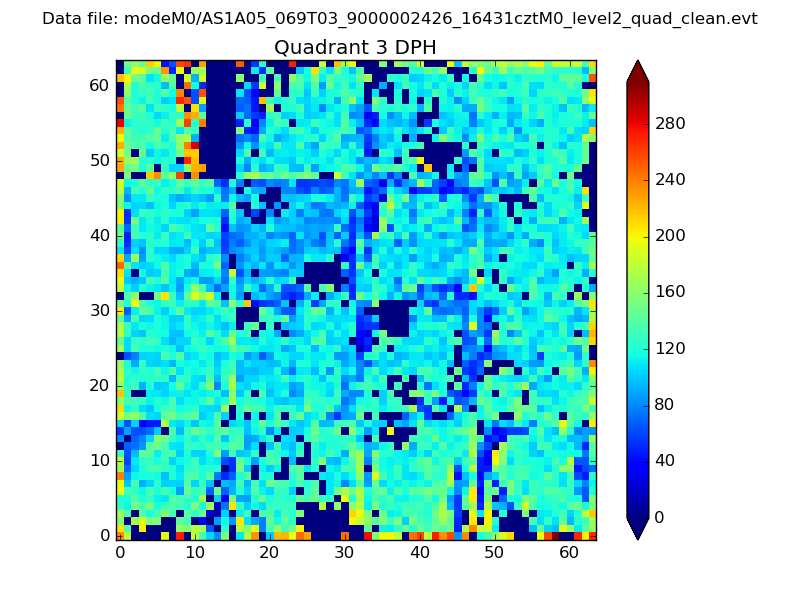 |
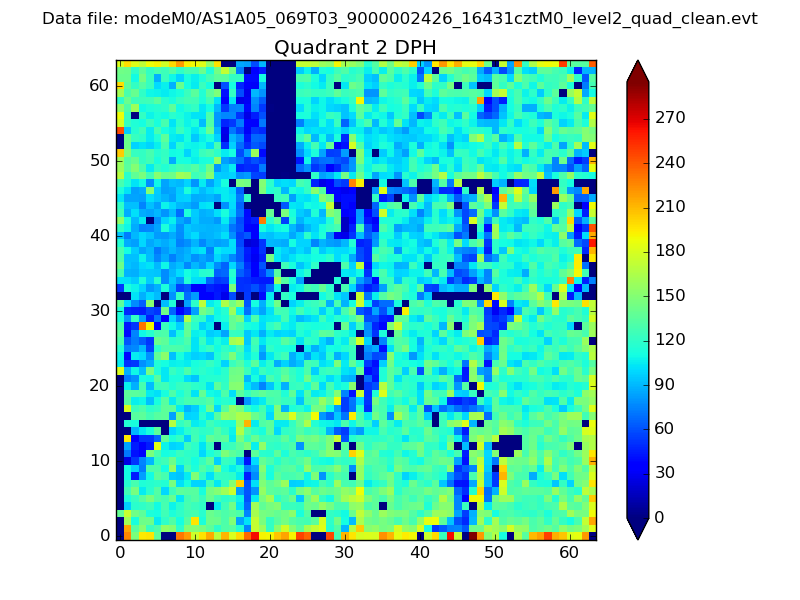 |
Quadrant C |
| Plot type | Count rate plots | Images |
|---|---|---|
| Comparison with Poisson distribution Blue bars denote a histogram of data divided into 1 sec bins. Red curve is a Poisson curve with rate = median count rate of data. |
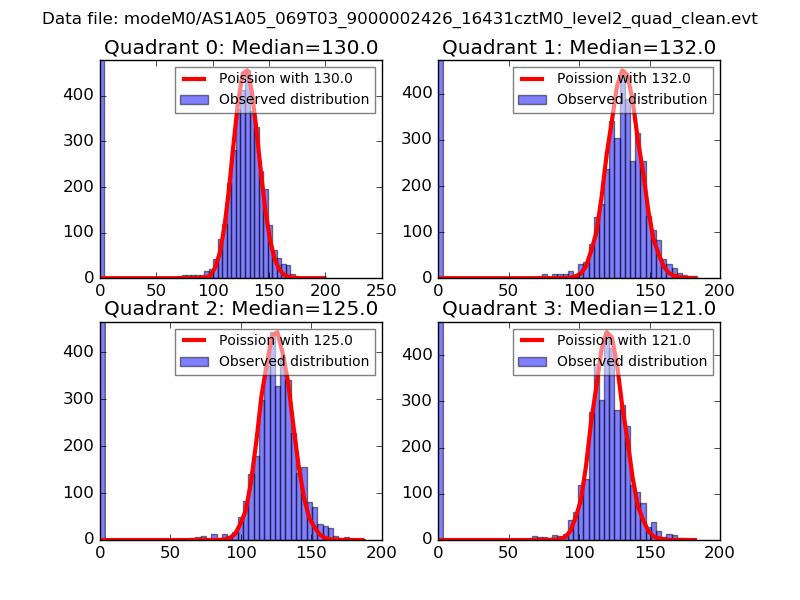 |
 |
| Quadrant-wise count rates Data is divided into 100 sec bins |
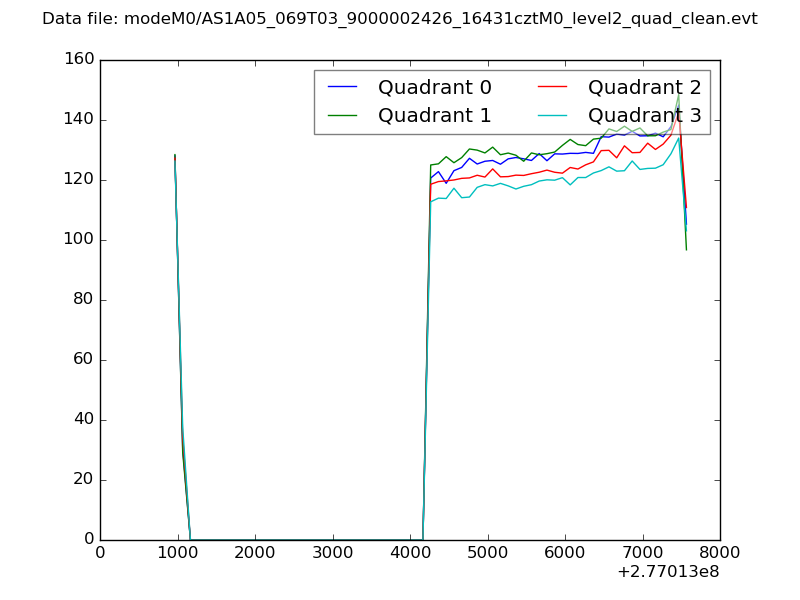 |
|
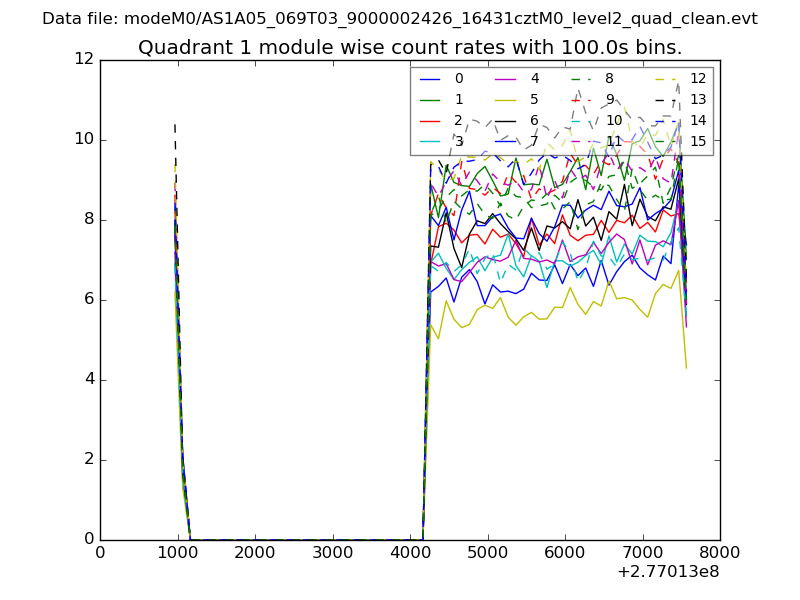
| Module-wise count rates for Quadrant A Data is divided into 100 sec bins |
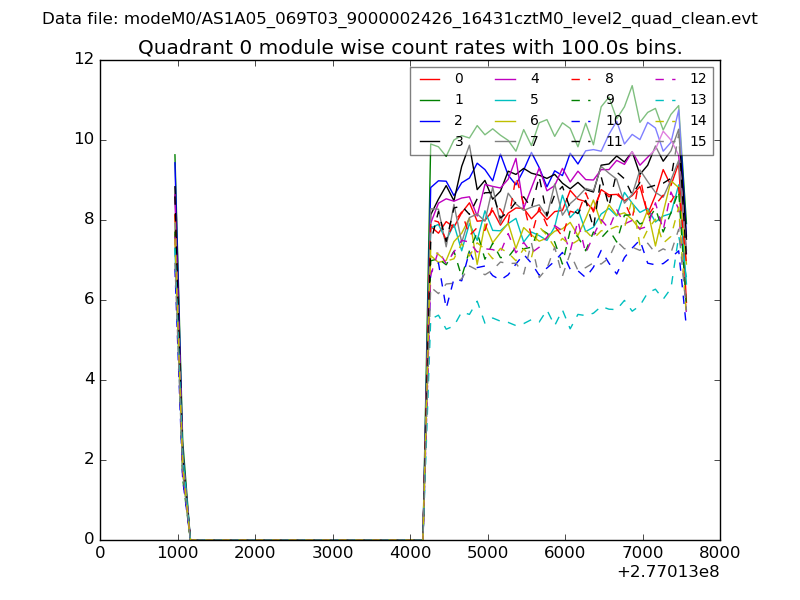 |
 |
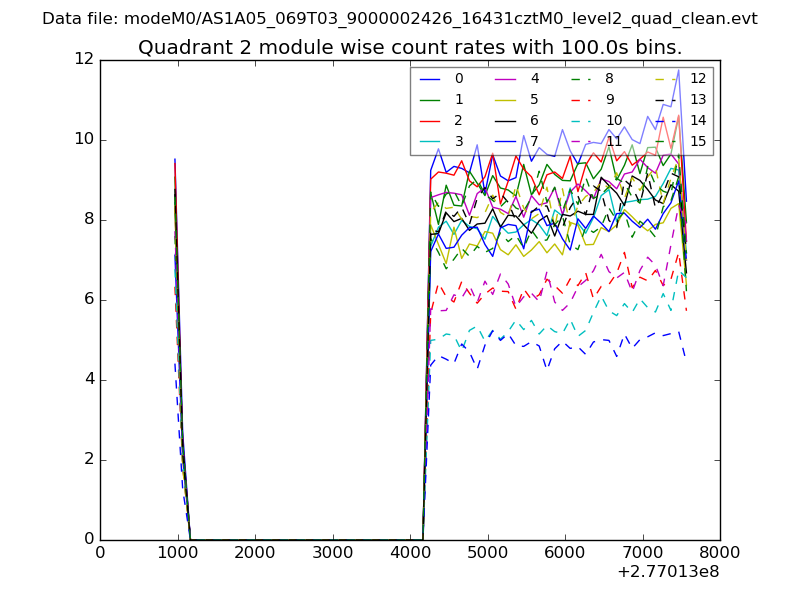
| Module-wise count rates for Quadrant B Data is divided into 100 sec bins |
 |
 |
| Module-wise count rates for Quadrant C Data is divided into 100 sec bins |
 |
 |
| Module-wise count rates for Quadrant D Data is divided into 100 sec bins |
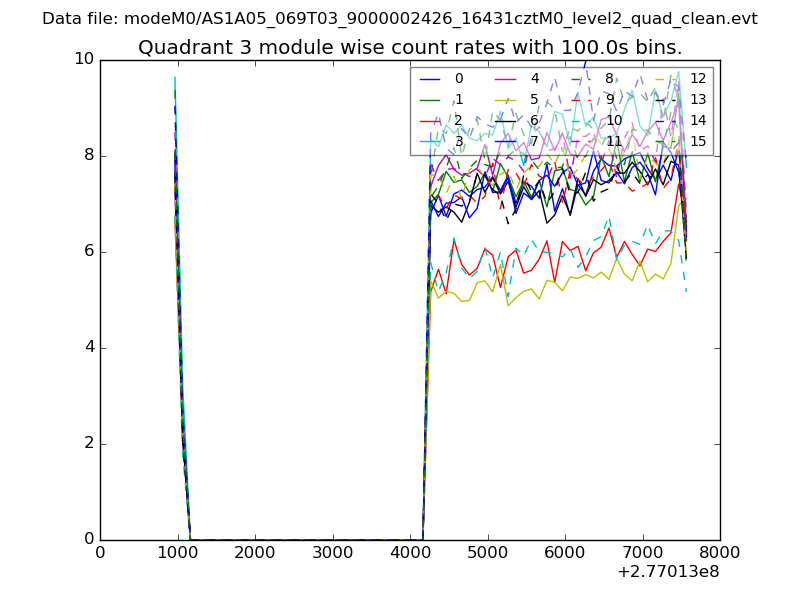 |
 |
| Parameter | Plot |
|---|---|
| CZT HV Monitor | 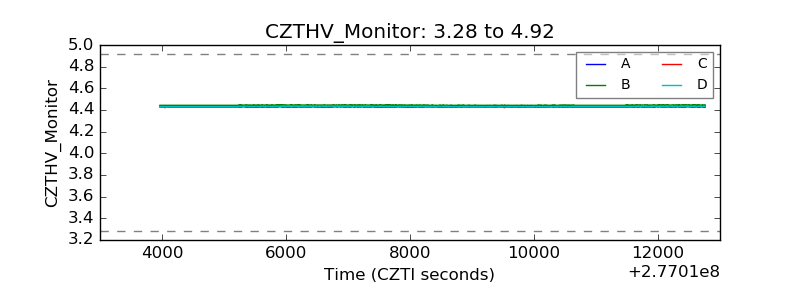 |
| D_VDD | 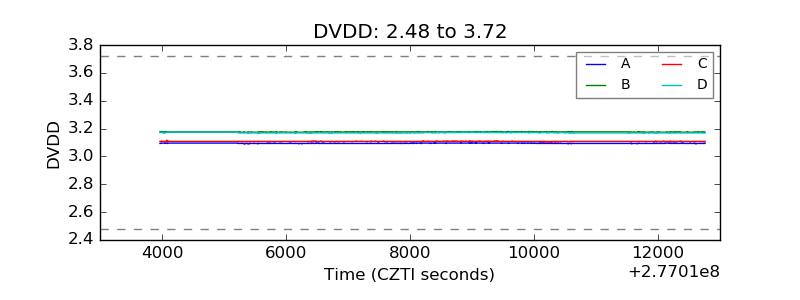 |
| Temperature 1 |  |
| Veto HV Monitor | 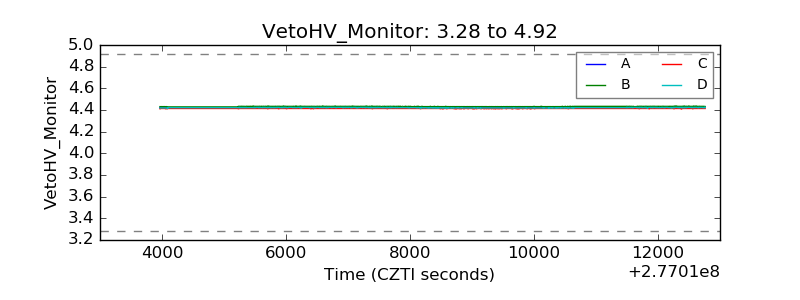 |
| Veto LLD | 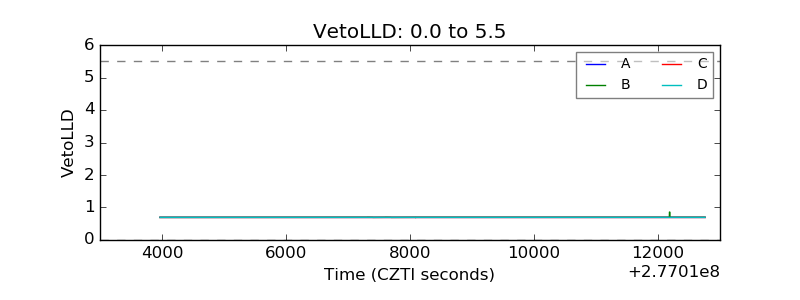 |
| Alpha Counter | 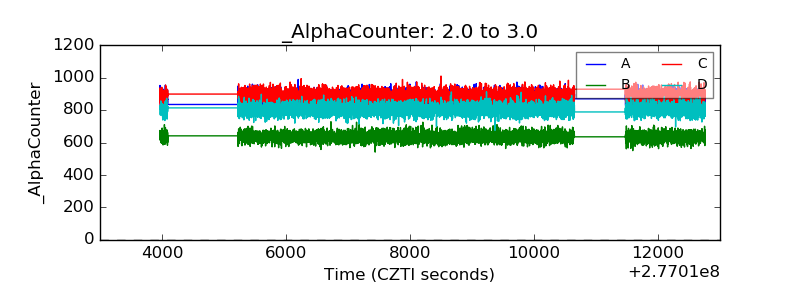 |
| _CPM_Rate | 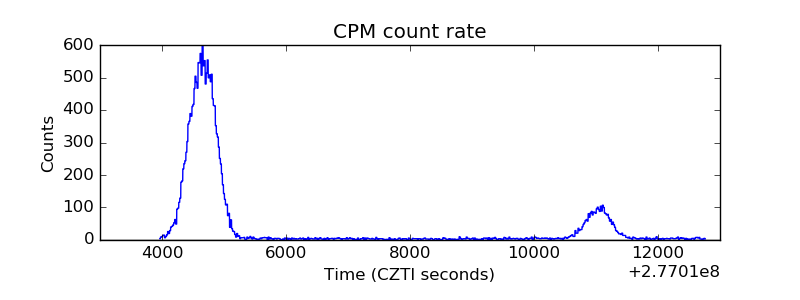 |
| CZT Counter | 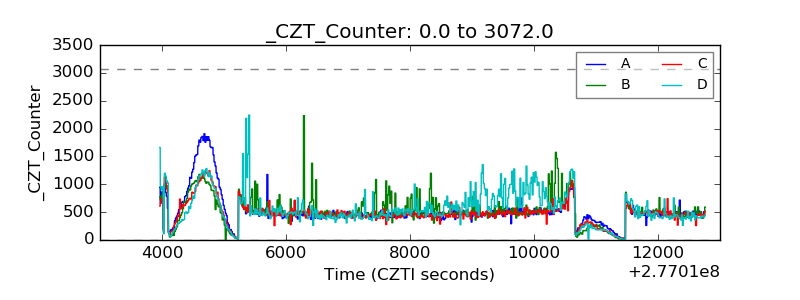 |
| +2.5 Volts monitor |  |
| +5 Volts monitor |  |
| _ROLL_ROT | 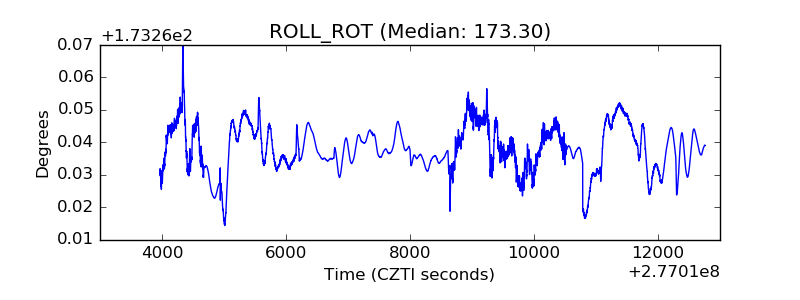 |
| _Roll_DEC | 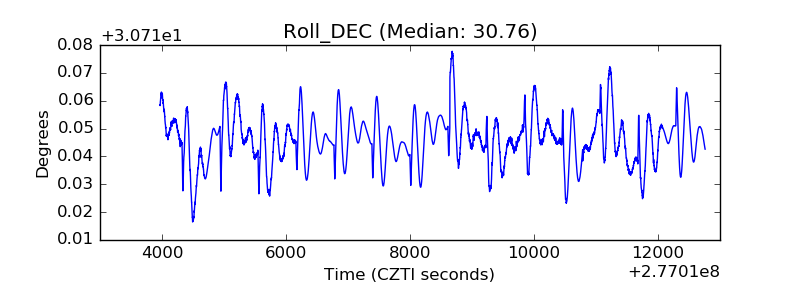 |
| _Roll_RA | 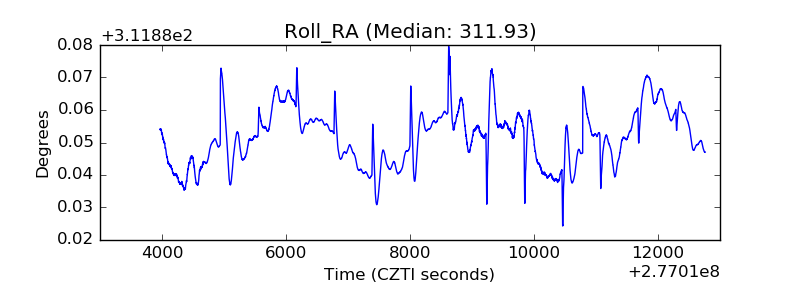 |
| Veto Counter | 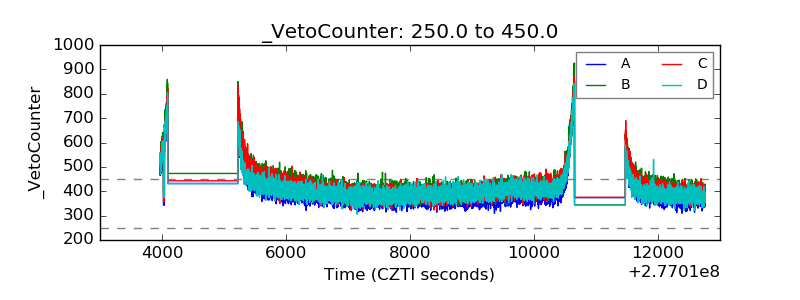 |