| Param | Original file | Final file |
|---|---|---|
| Filename | modeM0/AS1A05_069T03_9000002426_16432cztM0_level2.evt | modeM0/AS1A05_069T03_9000002426_16432cztM0_level2_quad_clean.evt |
| Size (bytes) | 517,982,400 | 81,685,440 |
| Size | 494.0 MB | 77.9 MB |
| Events in quadrant A | 3,793,720 | 494,524 |
| Events in quadrant B | 4,080,653 | 505,121 |
| Events in quadrant C | 3,598,270 | 484,614 |
| Events in quadrant D | 3,708,320 | 471,004 |
| Mode SS | |||
|---|---|---|---|
| Quadrant | BADHDUFLAG | Total packets | Discarded packets |
| A | 0 | 154 | 0 |
| B | 0 | 154 | 0 |
| C | 0 | 154 | 0 |
| D | 0 | 154 | 0 |
| Mode M0 | |||
|---|---|---|---|
| Quadrant | BADHDUFLAG | Total packets | Discarded packets |
| A | 0 | 16087 | 3 |
| B | 0 | 16834 | 2 |
| C | 0 | 15467 | 2 |
| D | 0 | 16221 | 2 |
| Mode M9 | |||
|---|---|---|---|
| Quadrant | BADHDUFLAG | Total packets | Discarded packets |
| A | 0 | 11 | 0 |
| B | 0 | 11 | 0 |
| C | 0 | 11 | 0 |
| D | 0 | 11 | 0 |
| Quadrant | Total seconds | Saturated seconds | Saturation percentage |
|---|---|---|---|
| A | 7444 | 304 | 4.083826% |
| B | 7444 | 308 | 4.137560% |
| C | 7444 | 275 | 3.694250% |
| D | 7444 | 240 | 3.224073% |
Noise dominated data is calculated using 1-second bins in cleaned event files. If a bin has >2000 counts, and if more than 50% of those come from <1% of pixels, then it is considered to be noise-dominated and hence unusable.
| Quadrant | # 1 sec bins | Bins with >0 counts | Bins with >2000 counts | High rate bins dominated by noise | Noise dominated (total time) | Noise dominated (detector-on time) | Marked lightcurve |
|---|---|---|---|---|---|---|---|
| A | 8585 | 7445 | 38 | 38 | 0.44% | 0.51% | 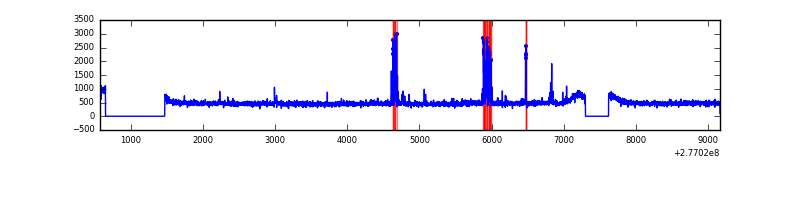 |
| B | 8585 | 7445 | 7 | 7 | 0.08% | 0.09% | 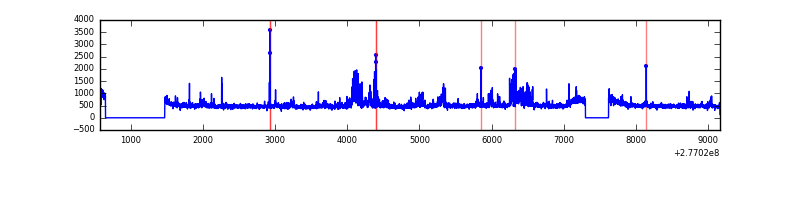 |
| C | 8585 | 7445 | 0 | 0 | 0.00% | 0.00% | 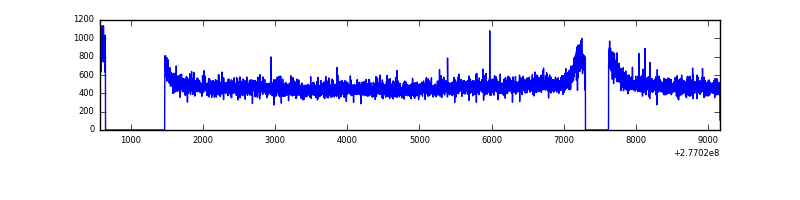 |
| D | 8585 | 7445 | 28 | 28 | 0.33% | 0.38% | 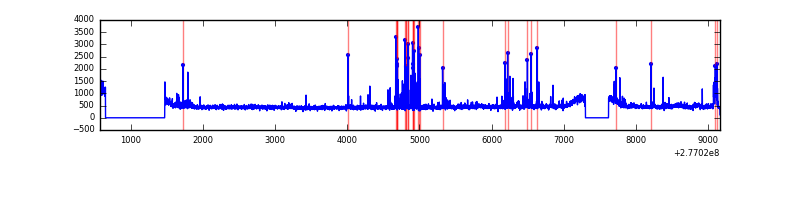 |
Top three noisy pixels from each quadrant. If the there are fewer than three noisy pixels in the level2.evt file, extra rows are filled as -1
| Pixel properties | Quadrant properties | ||||||
|---|---|---|---|---|---|---|---|
| Quadrant | DetID | PixID | Counts | Sigma | Mean | Median | Sigma |
| A | 15 | 174 | 239265 | 1287.21 | 911 | 888 | 185.2 |
| A | 15 | 223 | 37327 | 196.77 | 911 | 888 | 185.2 |
| A | 15 | 239 | 13872 | 70.11 | 911 | 888 | 185.2 |
| B | 15 | 35 | 254120 | 1433.72 | 912 | 888 | 176.6 |
| B | 0 | 198 | 68457 | 382.55 | 912 | 888 | 176.6 |
| B | 4 | 216 | 61874 | 345.28 | 912 | 888 | 176.6 |
| C | 14 | 238 | 133124 | 642.7 | 878 | 884 | 205.8 |
| C | 7 | 247 | 19354 | 89.77 | 878 | 884 | 205.8 |
| C | 3 | 233 | 15587 | 71.46 | 878 | 884 | 205.8 |
| D | 5 | 222 | 265130 | 1209.28 | 885 | 854 | 218.5 |
| D | 12 | 218 | 52379 | 235.77 | 885 | 854 | 218.5 |
| D | 10 | 70 | 29607 | 131.57 | 885 | 854 | 218.5 |
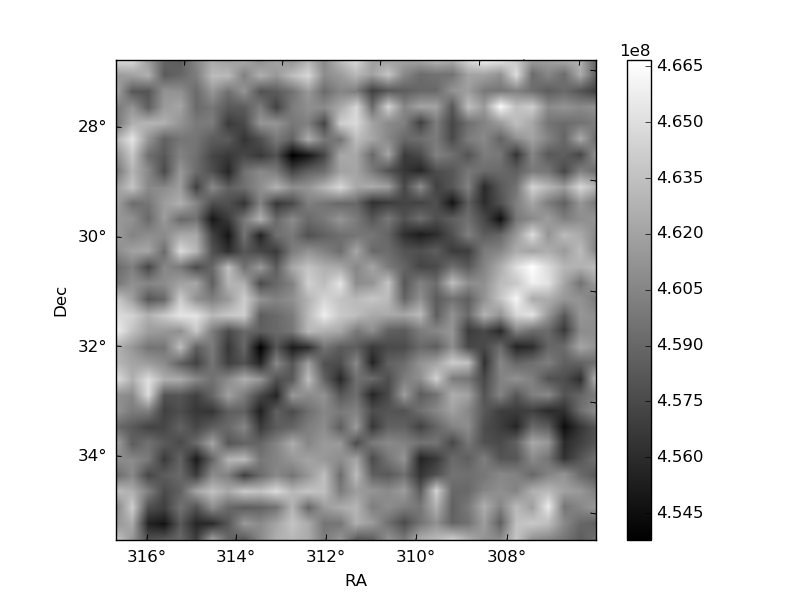
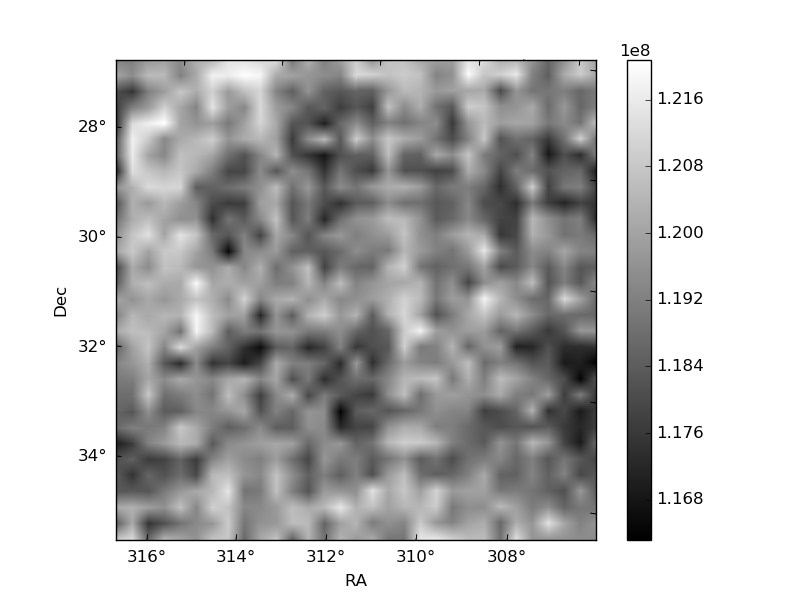
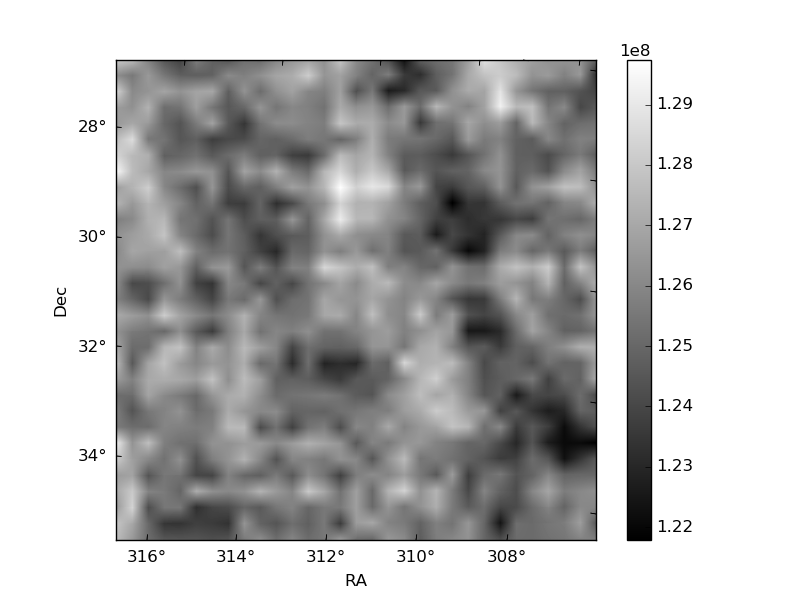
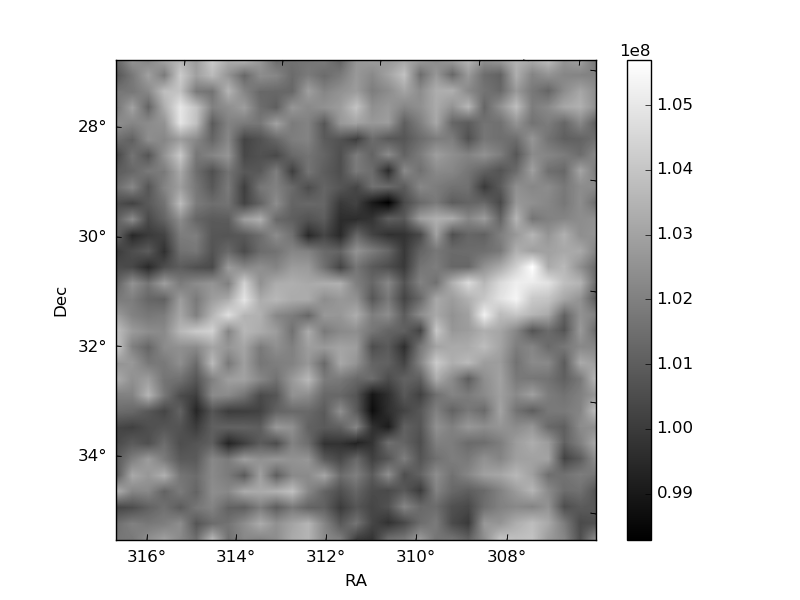
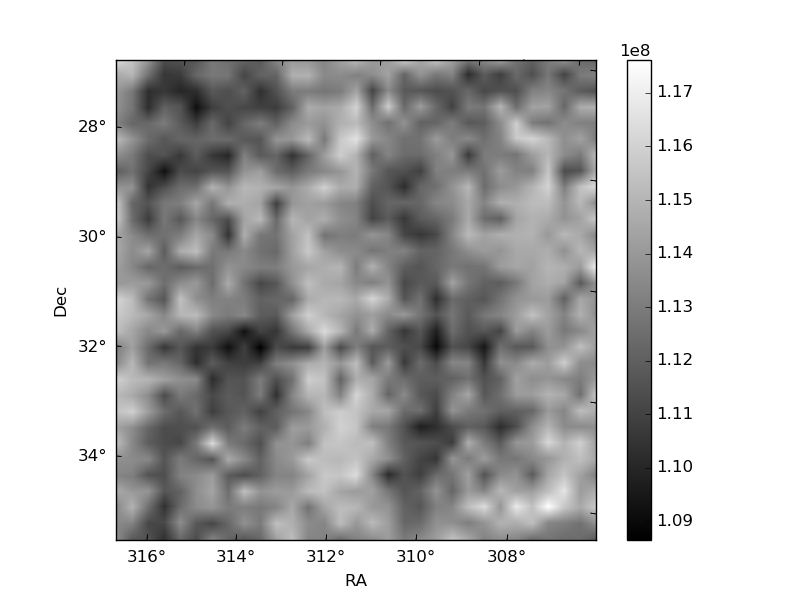
Histogram calculated using DETX and DETY for each event in the final _common_clean file
| Quadrant A | 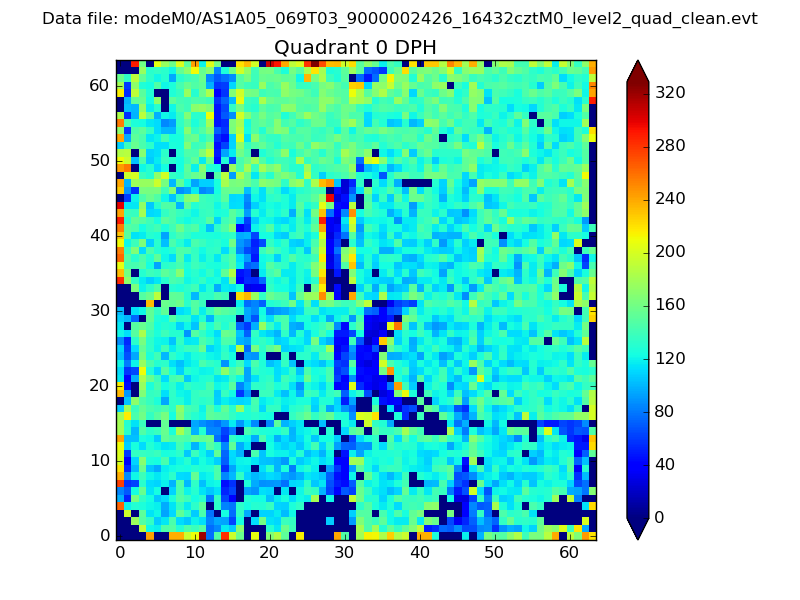 |
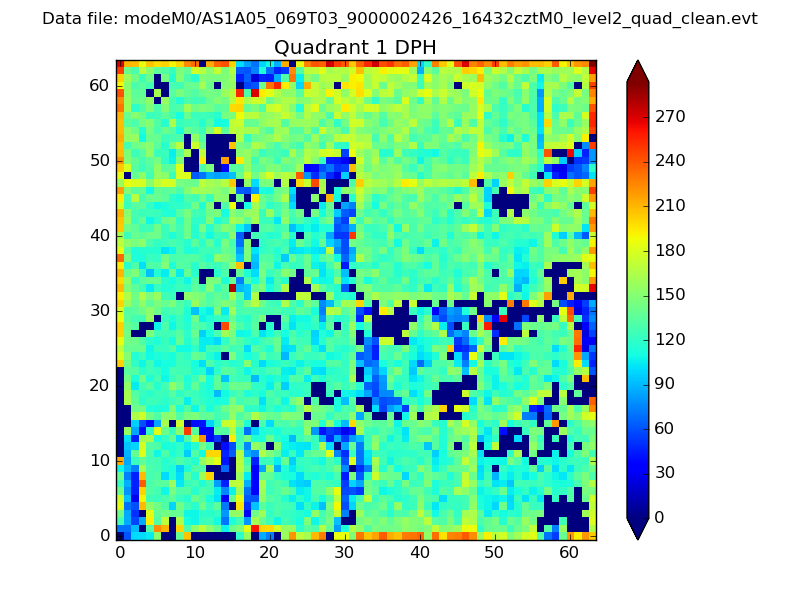 |
Quadrant B |
|---|---|---|---|
| Quadrant D | 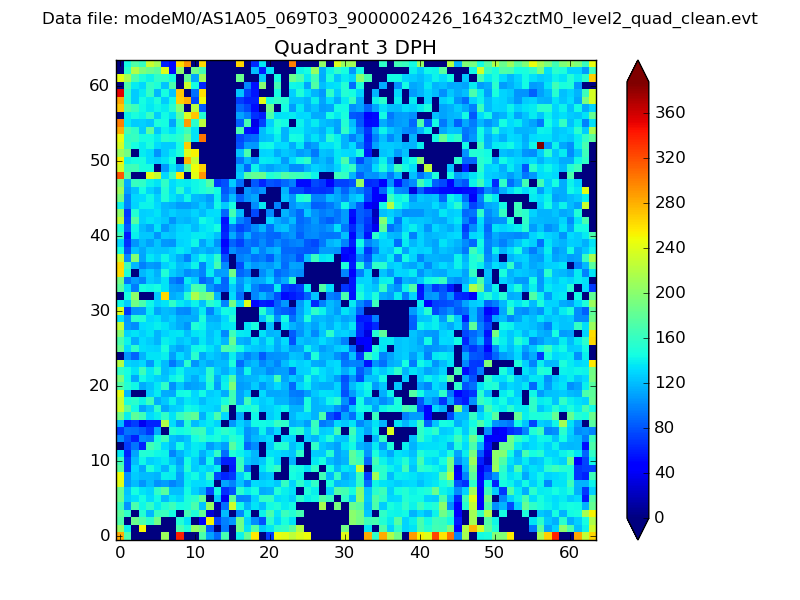 |
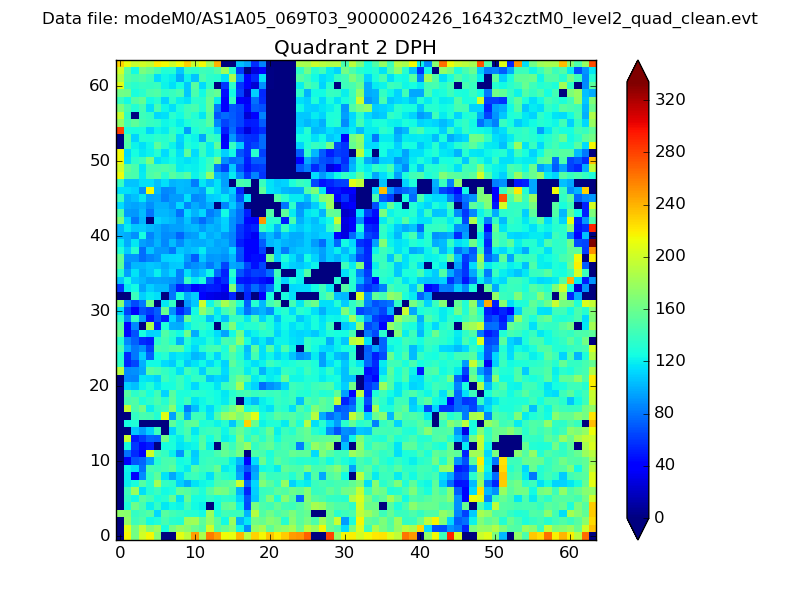 |
Quadrant C |
| Plot type | Count rate plots | Images |
|---|---|---|
| Comparison with Poisson distribution Blue bars denote a histogram of data divided into 1 sec bins. Red curve is a Poisson curve with rate = median count rate of data. |
 |
 |
| Quadrant-wise count rates Data is divided into 100 sec bins |
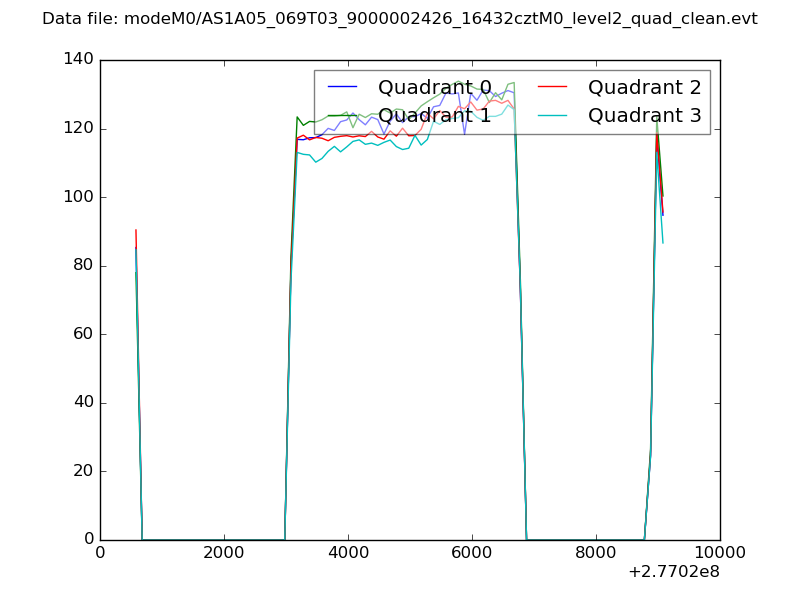 |
|
| Module-wise count rates for Quadrant A Data is divided into 100 sec bins |
 |
 |
| Module-wise count rates for Quadrant B Data is divided into 100 sec bins |
 |
 |
| Module-wise count rates for Quadrant C Data is divided into 100 sec bins |
 |
 |
| Module-wise count rates for Quadrant D Data is divided into 100 sec bins |
 |
 |
| Parameter | Plot |
|---|---|
| CZT HV Monitor |  |
| D_VDD | 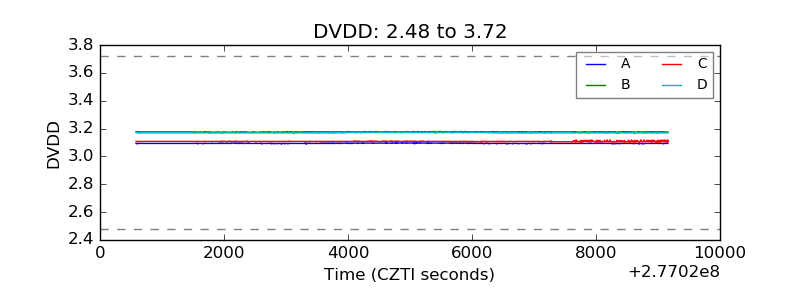 |
| Temperature 1 | 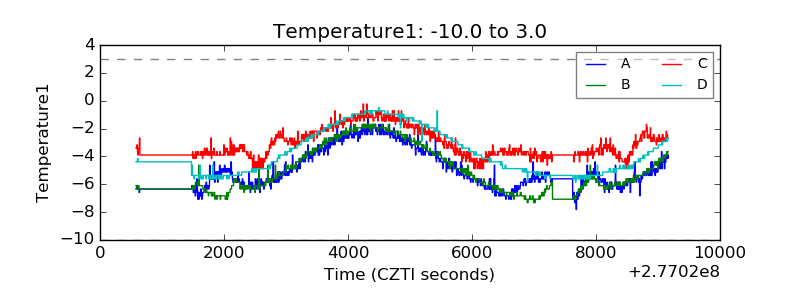 |
| Veto HV Monitor | 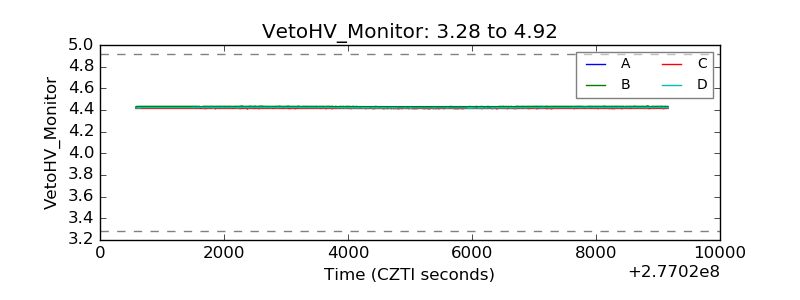 |
| Veto LLD | 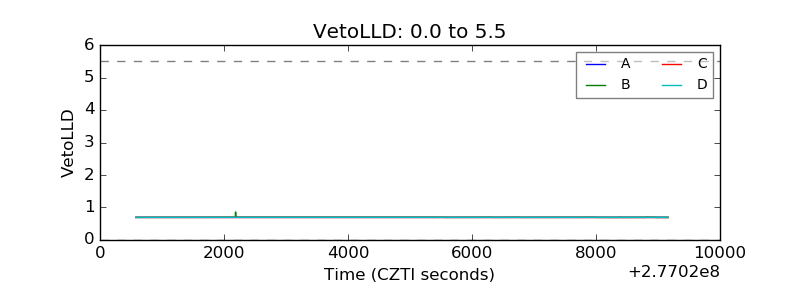 |
| Alpha Counter | 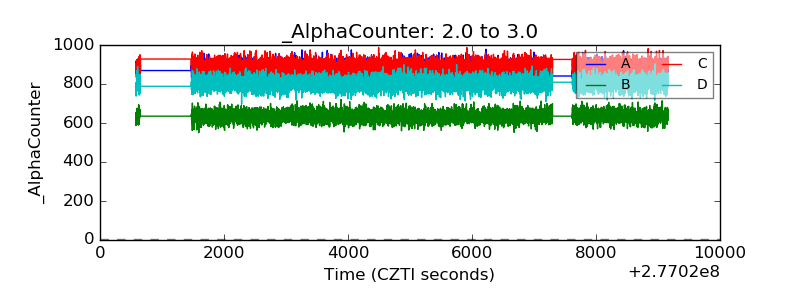 |
| _CPM_Rate | 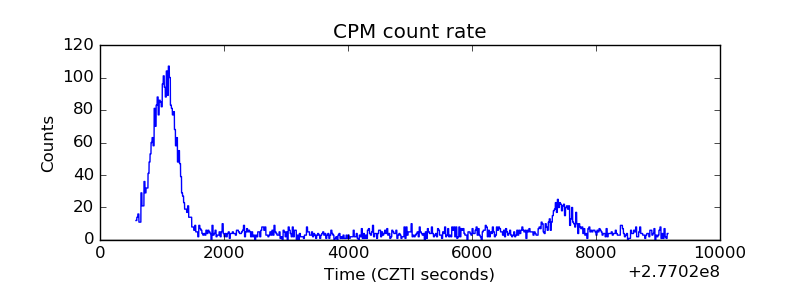 |
| CZT Counter | 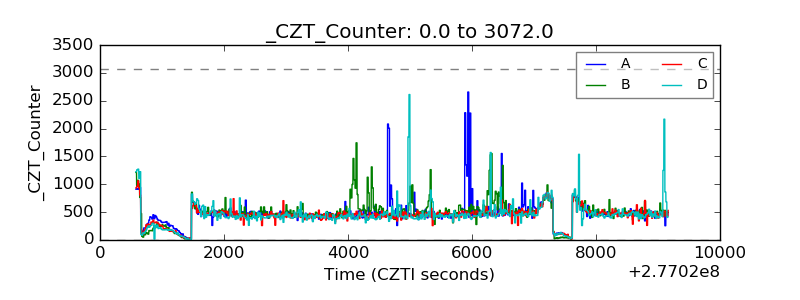 |
| +2.5 Volts monitor |  |
| +5 Volts monitor | 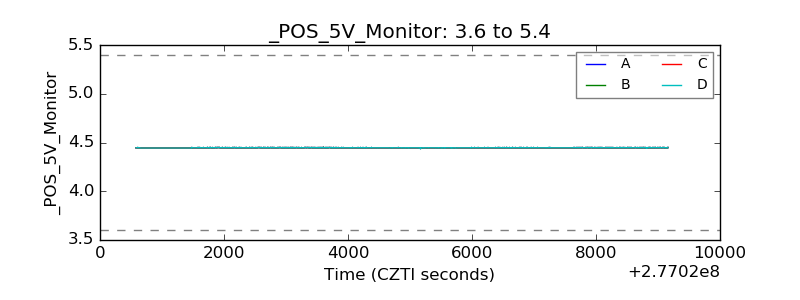 |
| _ROLL_ROT |  |
| _Roll_DEC | 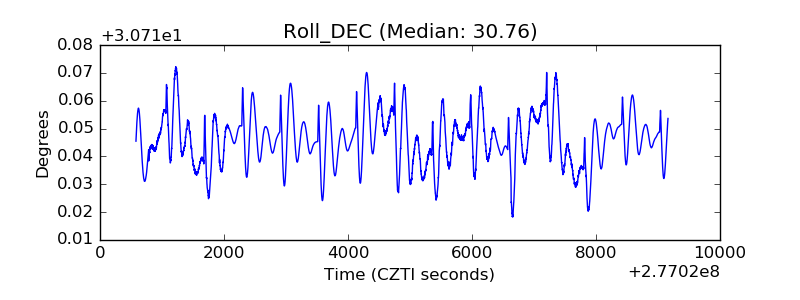 |
| _Roll_RA | 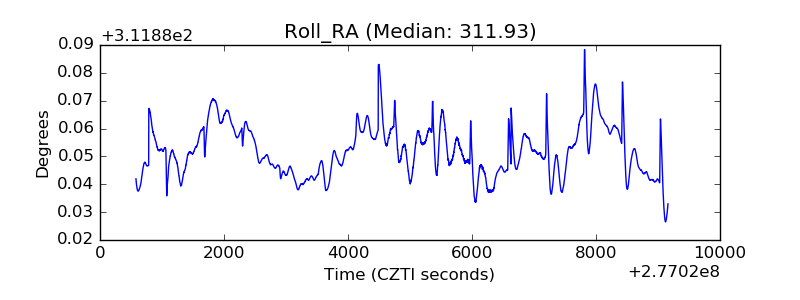 |
| Veto Counter |  |