| Param | Original file | Final file |
|---|---|---|
| Filename | modeM0/AS1A05_069T03_9000002426_16433cztM0_level2.evt | modeM0/AS1A05_069T03_9000002426_16433cztM0_level2_quad_clean.evt |
| Size (bytes) | 538,024,320 | 88,485,120 |
| Size | 513.1 MB | 84.4 MB |
| Events in quadrant A | 3,858,469 | 541,521 |
| Events in quadrant B | 4,208,957 | 549,767 |
| Events in quadrant C | 3,876,917 | 525,863 |
| Events in quadrant D | 3,812,669 | 513,060 |
| Mode SS | |||
|---|---|---|---|
| Quadrant | BADHDUFLAG | Total packets | Discarded packets |
| A | 0 | 162 | 0 |
| B | 0 | 162 | 0 |
| C | 0 | 162 | 0 |
| D | 0 | 162 | 0 |
| Mode M0 | |||
|---|---|---|---|
| Quadrant | BADHDUFLAG | Total packets | Discarded packets |
| A | 0 | 16684 | 3 |
| B | 0 | 17505 | 2 |
| C | 0 | 16501 | 2 |
| D | 0 | 16885 | 2 |
| Mode M9 | |||
|---|---|---|---|
| Quadrant | BADHDUFLAG | Total packets | Discarded packets |
| A | 0 | 4 | 0 |
| B | 0 | 4 | 0 |
| C | 0 | 4 | 0 |
| D | 0 | 4 | 0 |
| Quadrant | Total seconds | Saturated seconds | Saturation percentage |
|---|---|---|---|
| A | 7901 | 387 | 4.898114% |
| B | 7901 | 390 | 4.936084% |
| C | 7901 | 371 | 4.695608% |
| D | 7901 | 312 | 3.948867% |
Noise dominated data is calculated using 1-second bins in cleaned event files. If a bin has >2000 counts, and if more than 50% of those come from <1% of pixels, then it is considered to be noise-dominated and hence unusable.
| Quadrant | # 1 sec bins | Bins with >0 counts | Bins with >2000 counts | High rate bins dominated by noise | Noise dominated (total time) | Noise dominated (detector-on time) | Marked lightcurve |
|---|---|---|---|---|---|---|---|
| A | 8297 | 7902 | 3 | 3 | 0.04% | 0.04% | 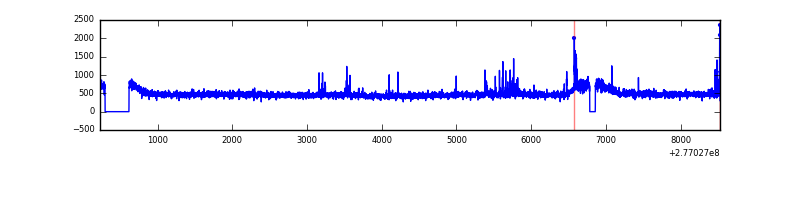 |
| B | 8297 | 7902 | 4 | 4 | 0.05% | 0.05% | 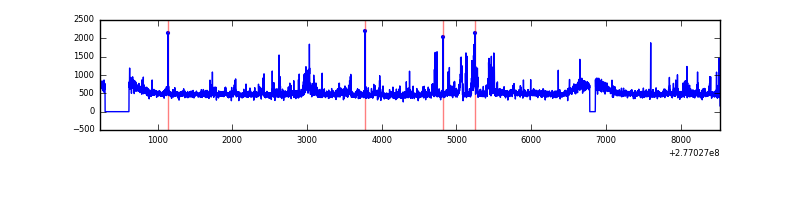 |
| C | 8297 | 7902 | 0 | 0 | 0.00% | 0.00% | 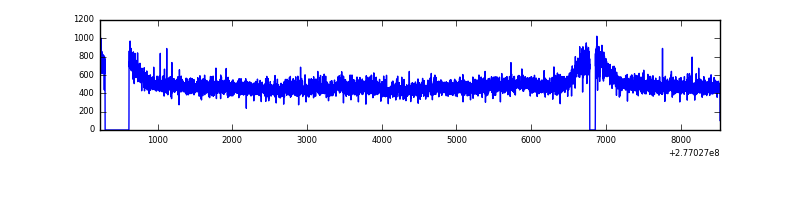 |
| D | 8297 | 7902 | 15 | 15 | 0.18% | 0.19% | 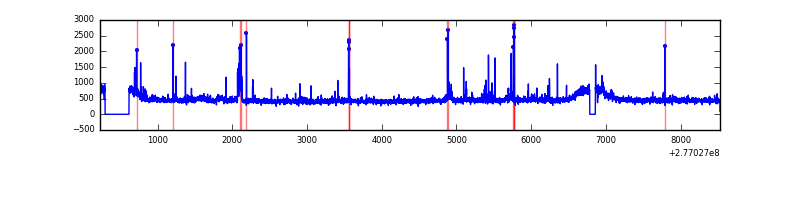 |
Top three noisy pixels from each quadrant. If the there are fewer than three noisy pixels in the level2.evt file, extra rows are filled as -1
| Pixel properties | Quadrant properties | ||||||
|---|---|---|---|---|---|---|---|
| Quadrant | DetID | PixID | Counts | Sigma | Mean | Median | Sigma |
| A | 15 | 174 | 90853 | 458.89 | 968 | 943 | 195.9 |
| A | 15 | 223 | 30525 | 150.98 | 968 | 943 | 195.9 |
| A | 15 | 239 | 12967 | 61.37 | 968 | 943 | 195.9 |
| B | 15 | 35 | 211152 | 1116.72 | 970 | 942 | 188.2 |
| B | 0 | 244 | 56040 | 292.7 | 970 | 942 | 188.2 |
| B | 0 | 198 | 44420 | 230.97 | 970 | 942 | 188.2 |
| C | 14 | 238 | 142143 | 649.11 | 931 | 937 | 217.5 |
| C | 7 | 247 | 64895 | 294.01 | 931 | 937 | 217.5 |
| C | 3 | 233 | 26669 | 118.29 | 931 | 937 | 217.5 |
| D | 5 | 222 | 183636 | 787.32 | 946 | 916 | 232.1 |
| D | 2 | 234 | 30863 | 129.04 | 946 | 916 | 232.1 |
| D | 10 | 70 | 21027 | 86.66 | 946 | 916 | 232.1 |
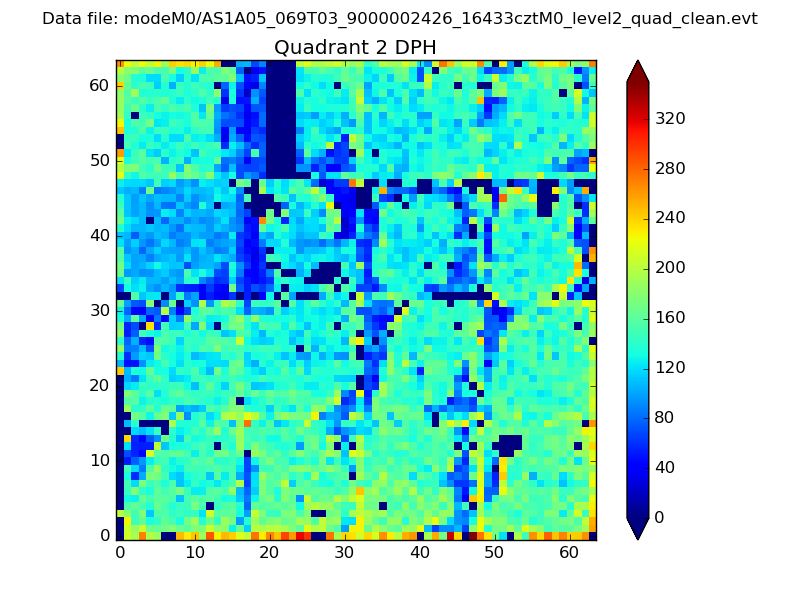
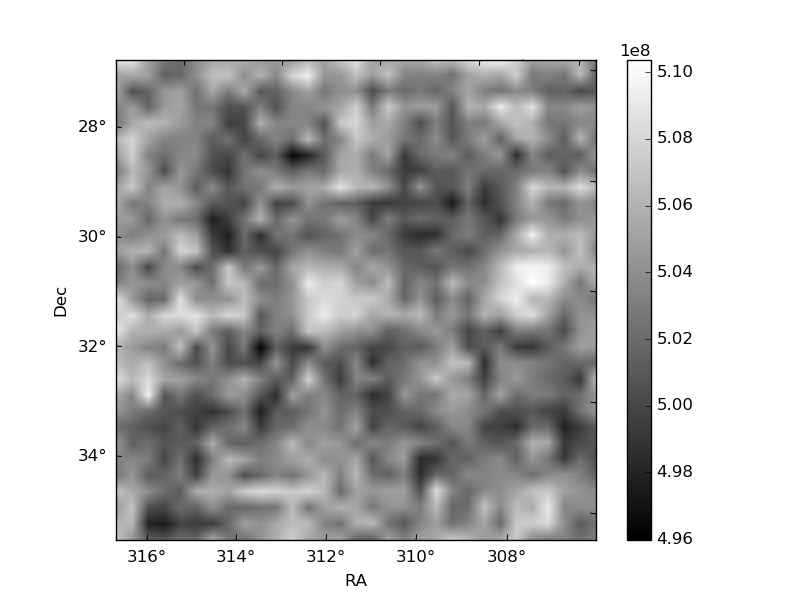
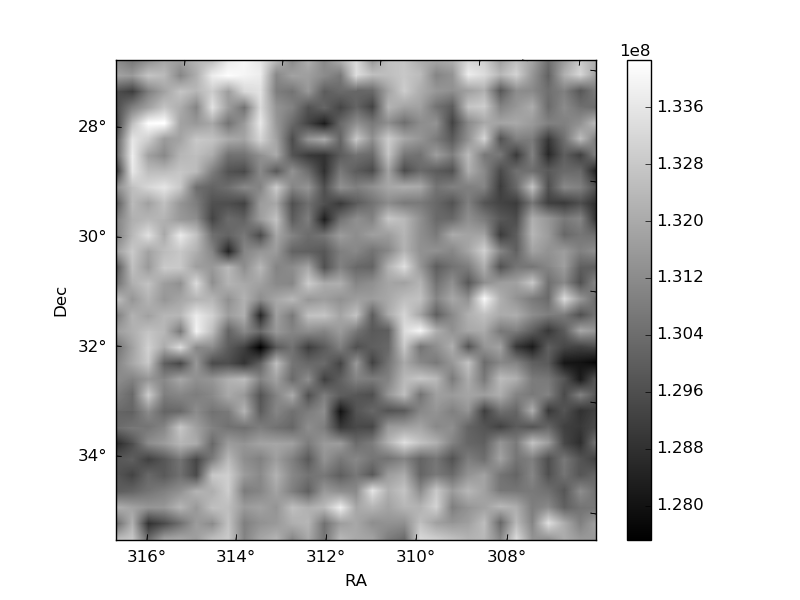
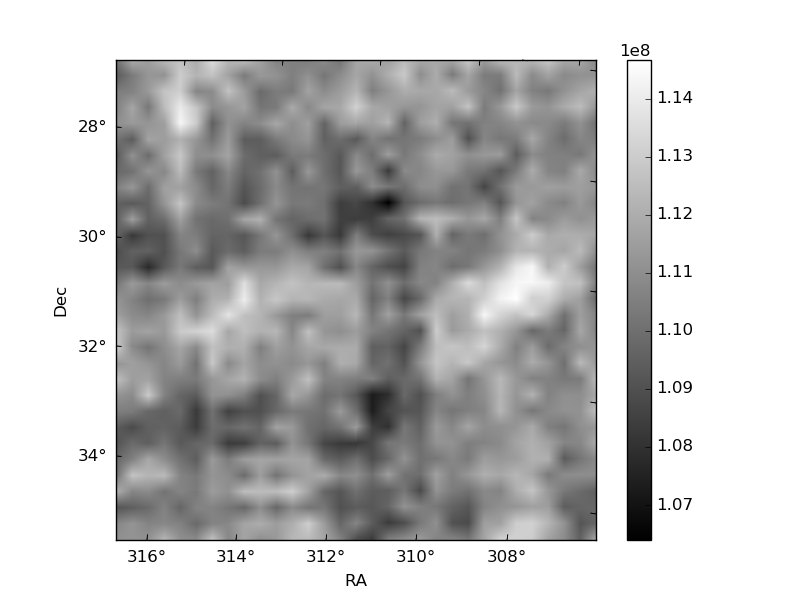
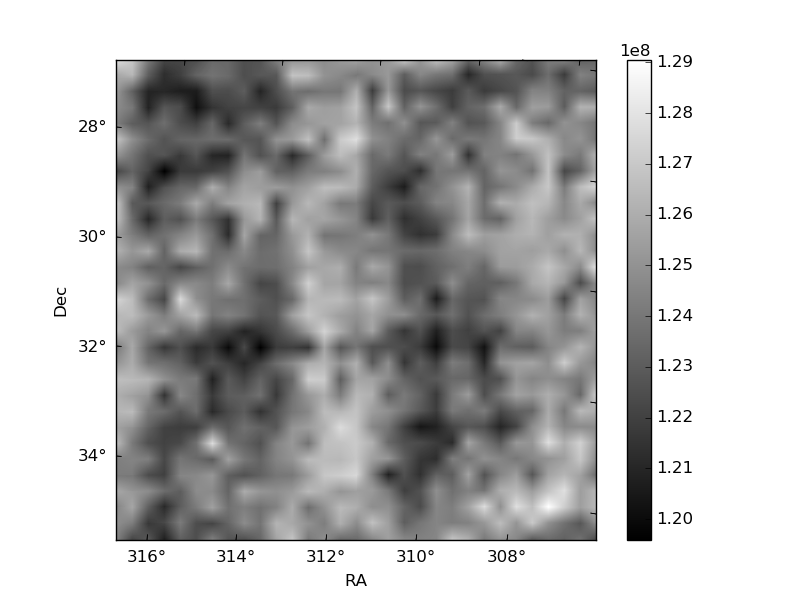
Histogram calculated using DETX and DETY for each event in the final _common_clean file
| Quadrant A | 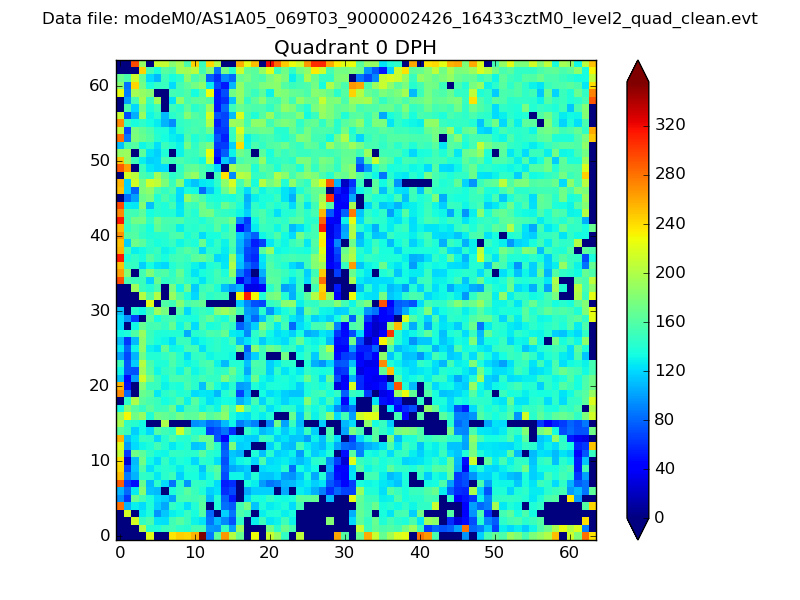 |
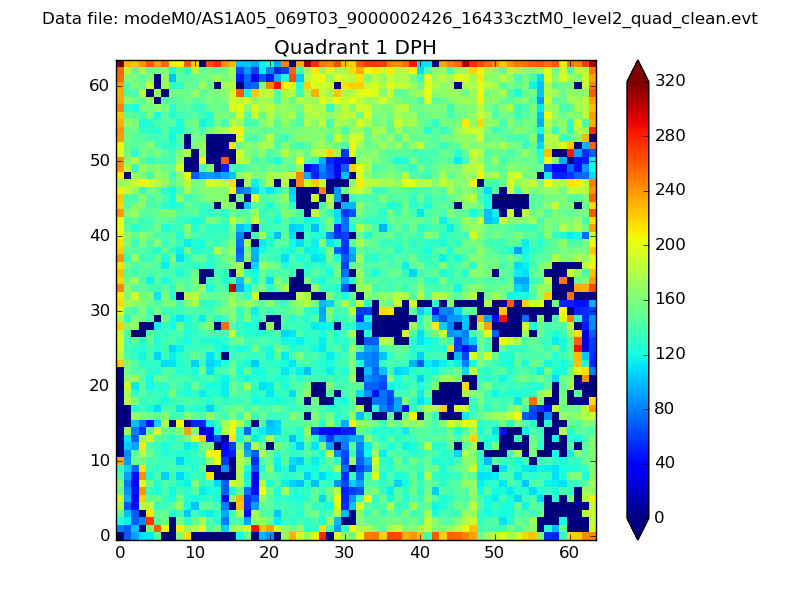 |
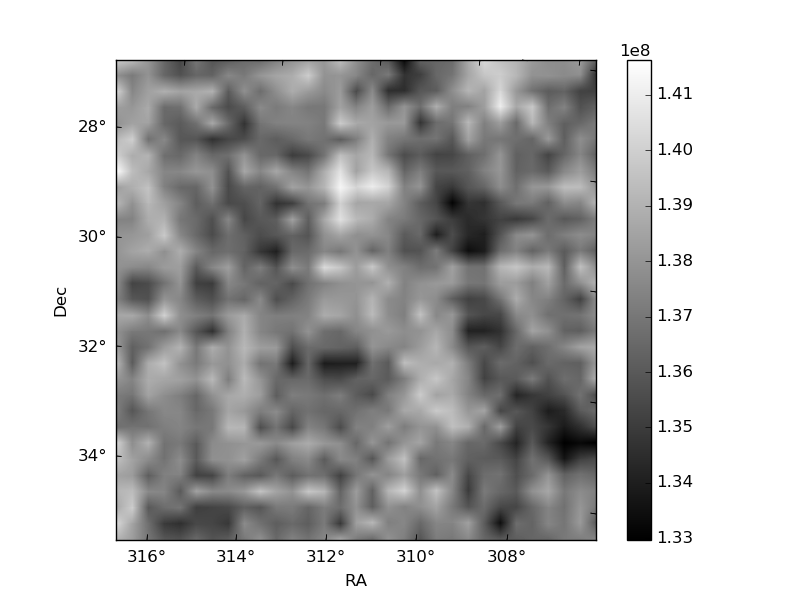
Quadrant B |
|---|---|---|---|
| Quadrant D | 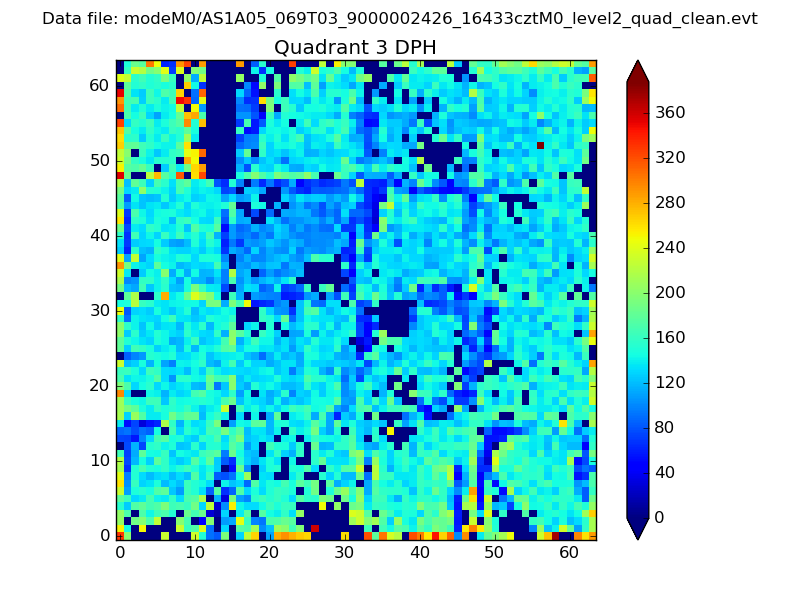 |
 |
Quadrant C |
| Plot type | Count rate plots | Images |
|---|---|---|
| Comparison with Poisson distribution Blue bars denote a histogram of data divided into 1 sec bins. Red curve is a Poisson curve with rate = median count rate of data. |
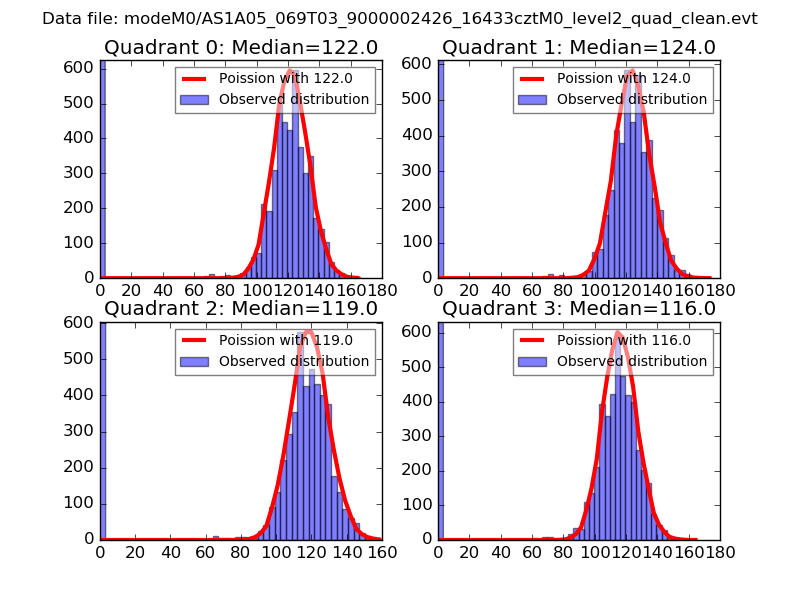 |
 |
| Quadrant-wise count rates Data is divided into 100 sec bins |
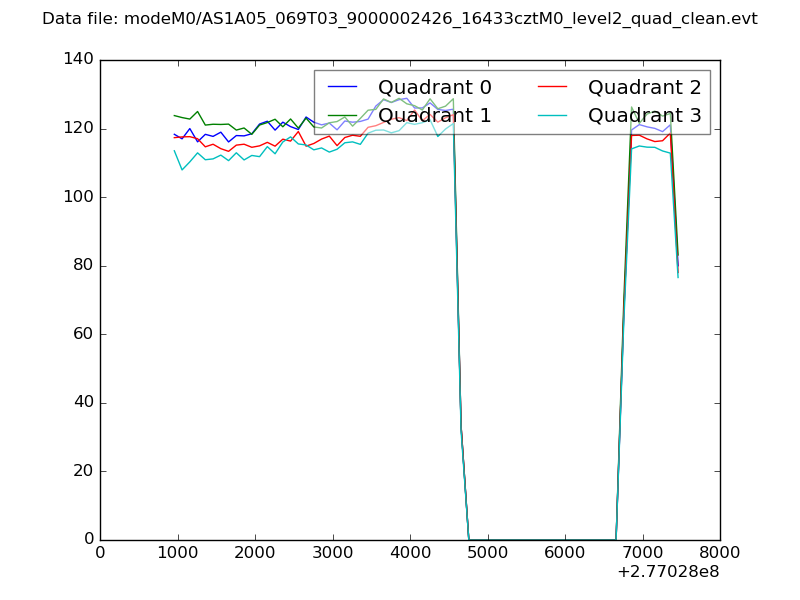 |
|
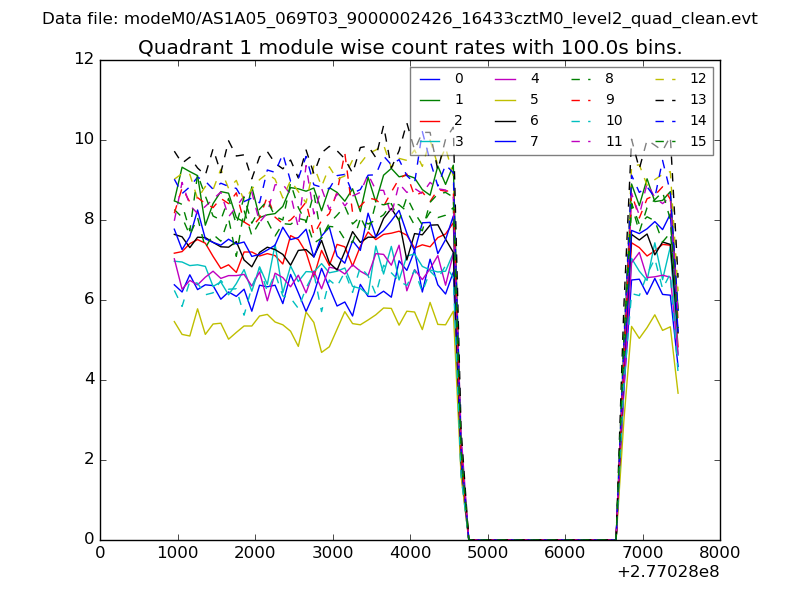
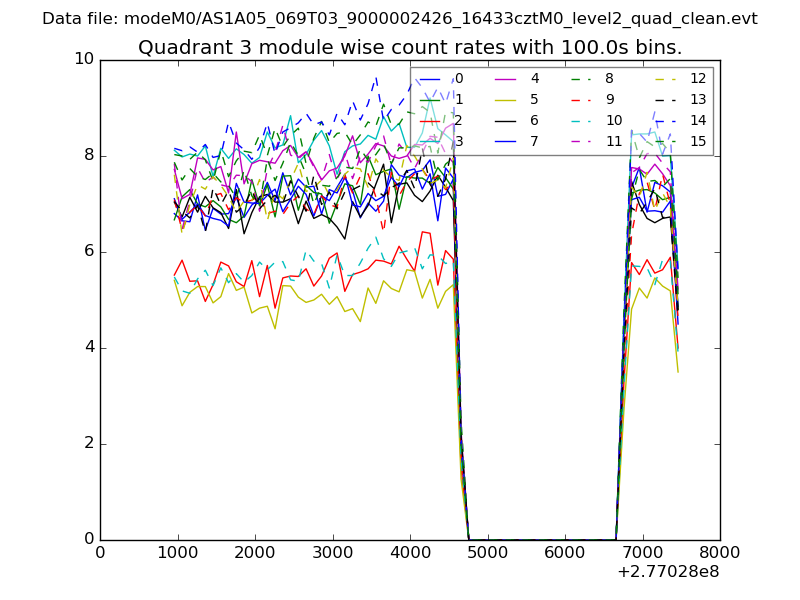
| Module-wise count rates for Quadrant A Data is divided into 100 sec bins |
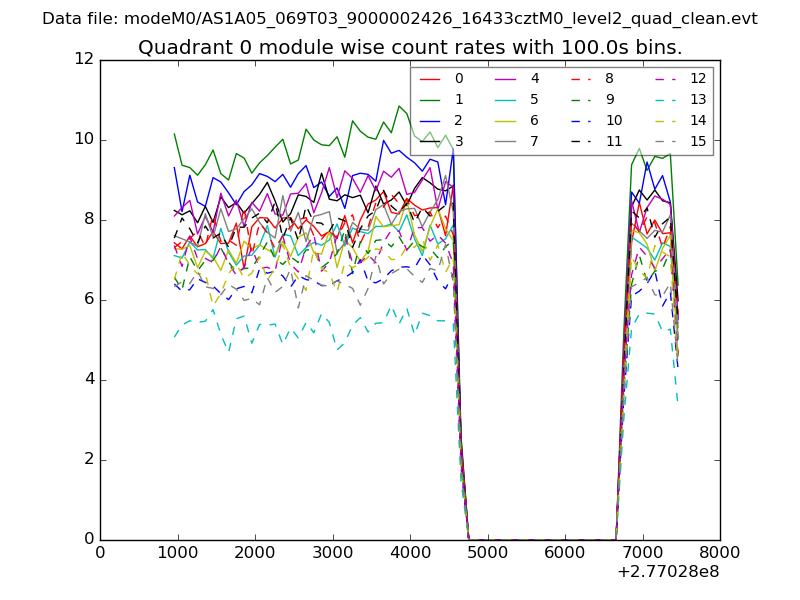 |
 |
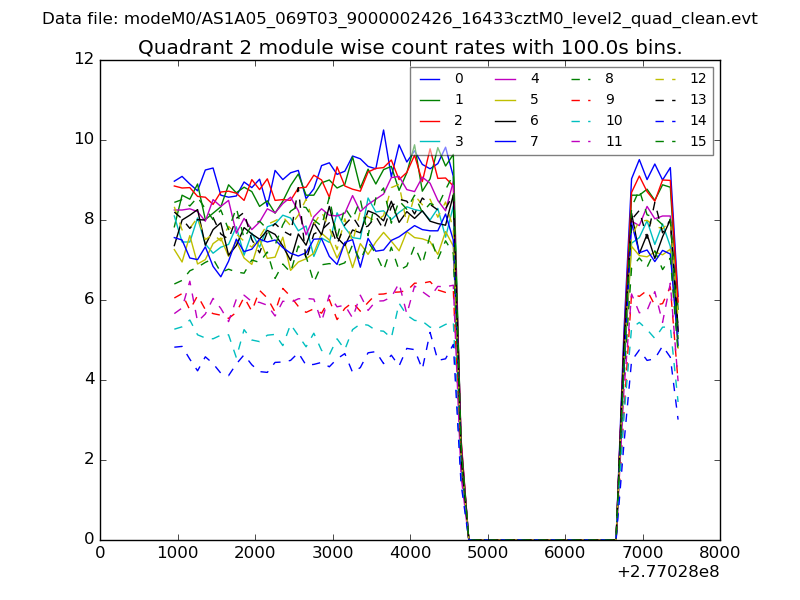
| Module-wise count rates for Quadrant B Data is divided into 100 sec bins |
 |
 |
| Module-wise count rates for Quadrant C Data is divided into 100 sec bins |
 |
 |
| Module-wise count rates for Quadrant D Data is divided into 100 sec bins |
 |
 |
| Parameter | Plot |
|---|---|
| CZT HV Monitor | 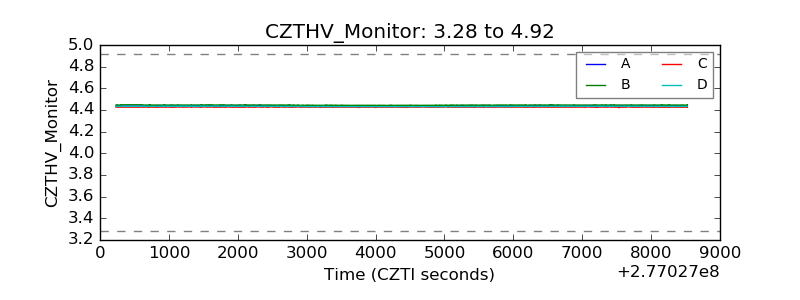 |
| D_VDD | 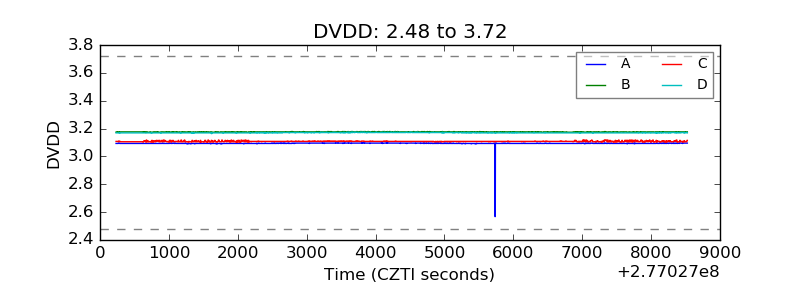 |
| Temperature 1 |  |
| Veto HV Monitor | 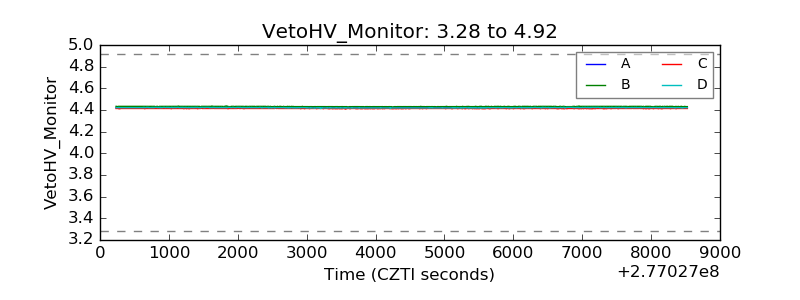 |
| Veto LLD | 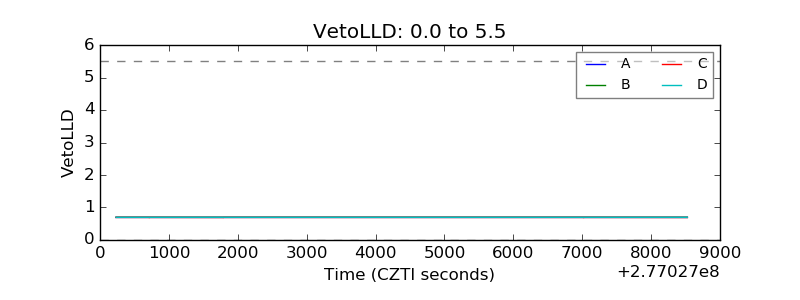 |
| Alpha Counter | 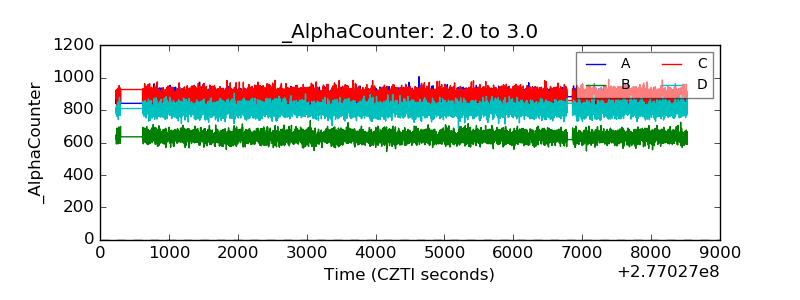 |
| _CPM_Rate | 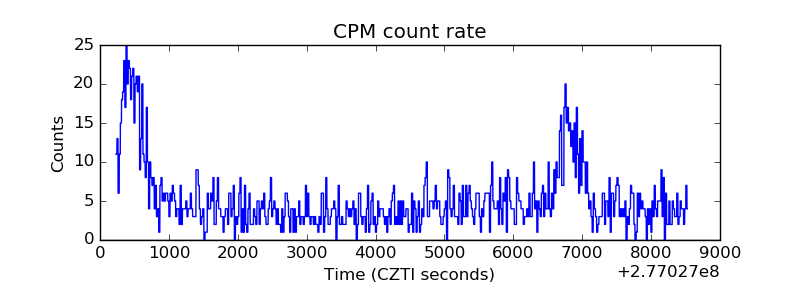 |
| CZT Counter | 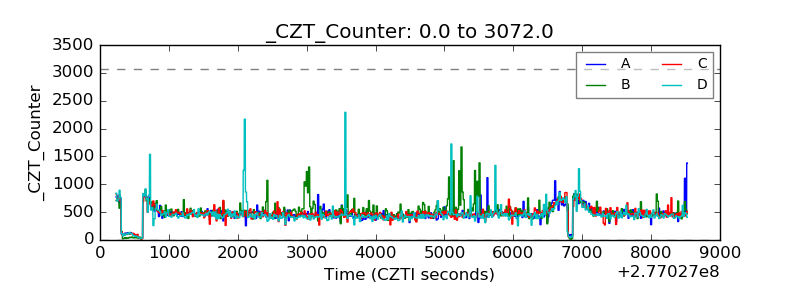 |
| +2.5 Volts monitor | 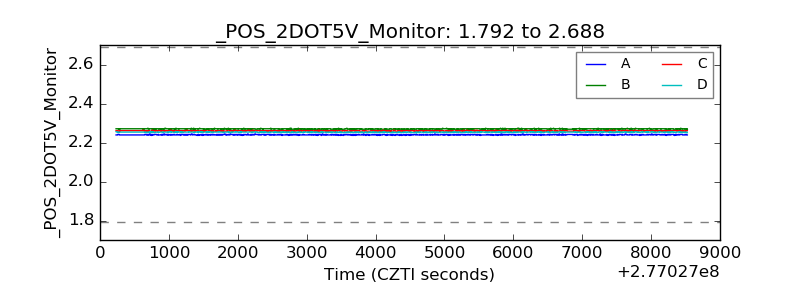 |
| +5 Volts monitor |  |
| _ROLL_ROT | 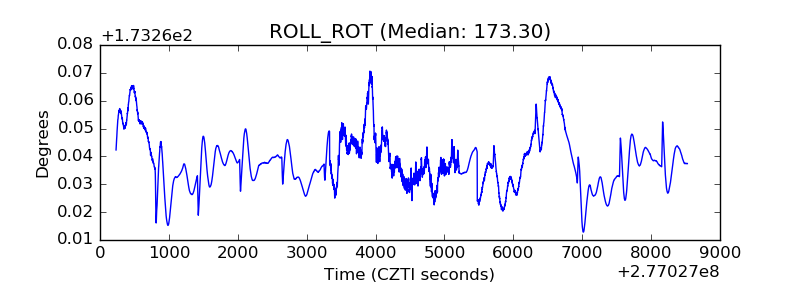 |
| _Roll_DEC | 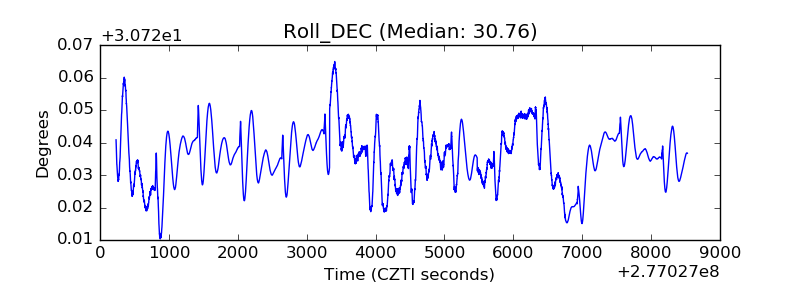 |
| _Roll_RA | 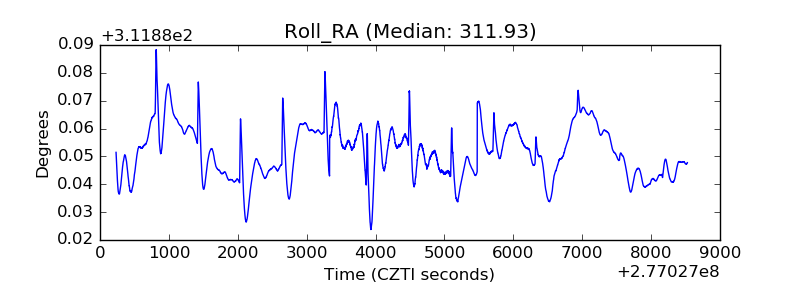 |
| Veto Counter | 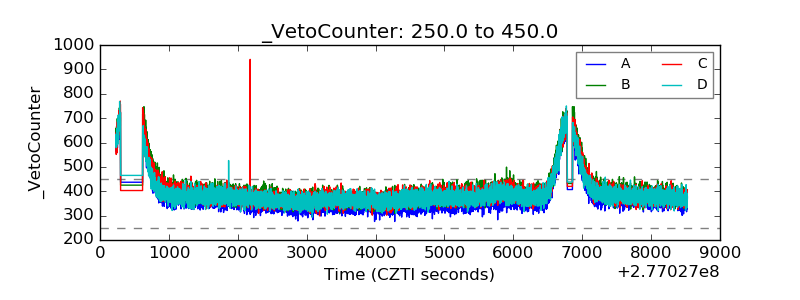 |