| Param | Original file | Final file |
|---|---|---|
| Filename | modeM0/AS1A05_069T03_9000002426_16434cztM0_level2.evt | modeM0/AS1A05_069T03_9000002426_16434cztM0_level2_quad_clean.evt |
| Size (bytes) | 255,911,040 | 45,555,840 |
| Size | 244.1 MB | 43.4 MB |
| Events in quadrant A | 1,966,952 | 282,628 |
| Events in quadrant B | 1,967,511 | 290,943 |
| Events in quadrant C | 1,810,985 | 276,713 |
| Events in quadrant D | 1,754,300 | 270,155 |
| Mode SS | |||
|---|---|---|---|
| Quadrant | BADHDUFLAG | Total packets | Discarded packets |
| A | 0 | 76 | 0 |
| B | 0 | 76 | 0 |
| C | 0 | 76 | 0 |
| D | 0 | 76 | 0 |
| Mode M0 | |||
|---|---|---|---|
| Quadrant | BADHDUFLAG | Total packets | Discarded packets |
| A | 0 | 8331 | 1 |
| B | 0 | 8216 | 1 |
| C | 0 | 7789 | 1 |
| D | 0 | 7837 | 1 |
| Mode M9 | |||
|---|---|---|---|
| Quadrant | BADHDUFLAG | Total packets | Discarded packets |
| A | 0 | 1 | 0 |
| B | 0 | 1 | 0 |
| C | 0 | 1 | 0 |
| D | 0 | 1 | 0 |
| Quadrant | Total seconds | Saturated seconds | Saturation percentage |
|---|---|---|---|
| A | 3653 | 322 | 8.814673% |
| B | 3653 | 269 | 7.363811% |
| C | 3653 | 240 | 6.569943% |
| D | 3653 | 189 | 5.173830% |
Noise dominated data is calculated using 1-second bins in cleaned event files. If a bin has >2000 counts, and if more than 50% of those come from <1% of pixels, then it is considered to be noise-dominated and hence unusable.
| Quadrant | # 1 sec bins | Bins with >0 counts | Bins with >2000 counts | High rate bins dominated by noise | Noise dominated (total time) | Noise dominated (detector-on time) | Marked lightcurve |
|---|---|---|---|---|---|---|---|
| A | 3729 | 3654 | 52 | 52 | 1.39% | 1.42% | 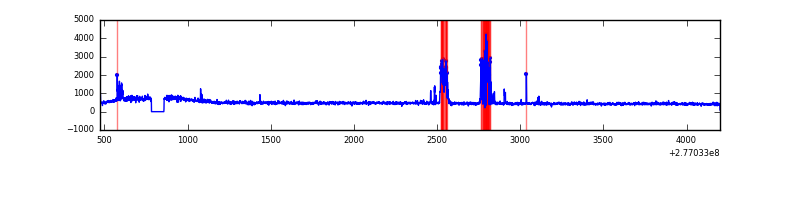 |
| B | 3729 | 3654 | 13 | 13 | 0.35% | 0.36% | 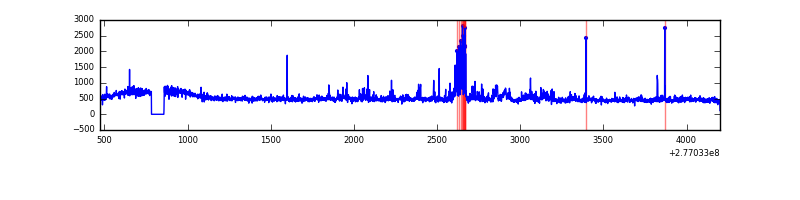 |
| C | 3729 | 3654 | 1 | 1 | 0.03% | 0.03% | 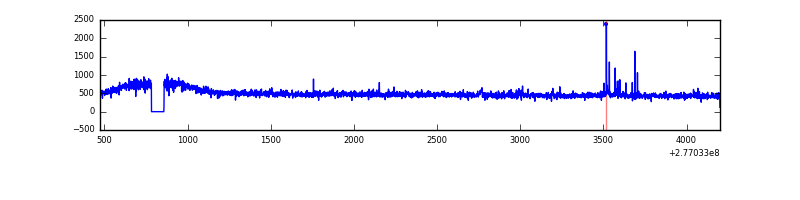 |
| D | 3729 | 3654 | 4 | 4 | 0.11% | 0.11% | 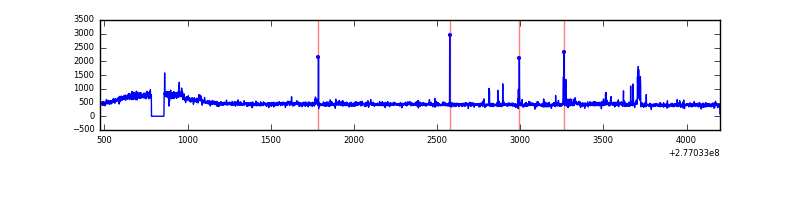 |
Top three noisy pixels from each quadrant. If the there are fewer than three noisy pixels in the level2.evt file, extra rows are filled as -1
| Pixel properties | Quadrant properties | ||||||
|---|---|---|---|---|---|---|---|
| Quadrant | DetID | PixID | Counts | Sigma | Mean | Median | Sigma |
| A | 15 | 174 | 230260 | 2459.26 | 450 | 439 | 93.5 |
| A | 0 | 226 | 3995 | 38.05 | 450 | 439 | 93.5 |
| A | 12 | 194 | 3410 | 31.79 | 450 | 439 | 93.5 |
| B | 15 | 35 | 93881 | 1044.68 | 449 | 437 | 89.4 |
| B | 0 | 198 | 31866 | 351.37 | 449 | 437 | 89.4 |
| B | 0 | 244 | 23419 | 256.93 | 449 | 437 | 89.4 |
| C | 14 | 238 | 65820 | 646.77 | 429 | 431 | 101.1 |
| C | 7 | 247 | 23676 | 229.92 | 429 | 431 | 101.1 |
| C | 0 | 207 | 17682 | 170.63 | 429 | 431 | 101.1 |
| D | 5 | 222 | 38867 | 350.69 | 442 | 427 | 109.6 |
| D | 12 | 218 | 17370 | 154.57 | 442 | 427 | 109.6 |
| D | 2 | 234 | 15578 | 138.22 | 442 | 427 | 109.6 |
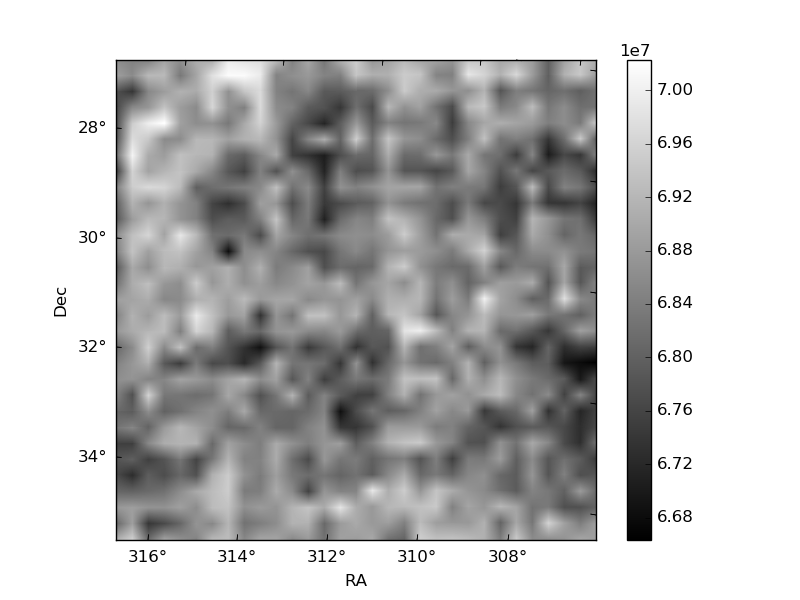
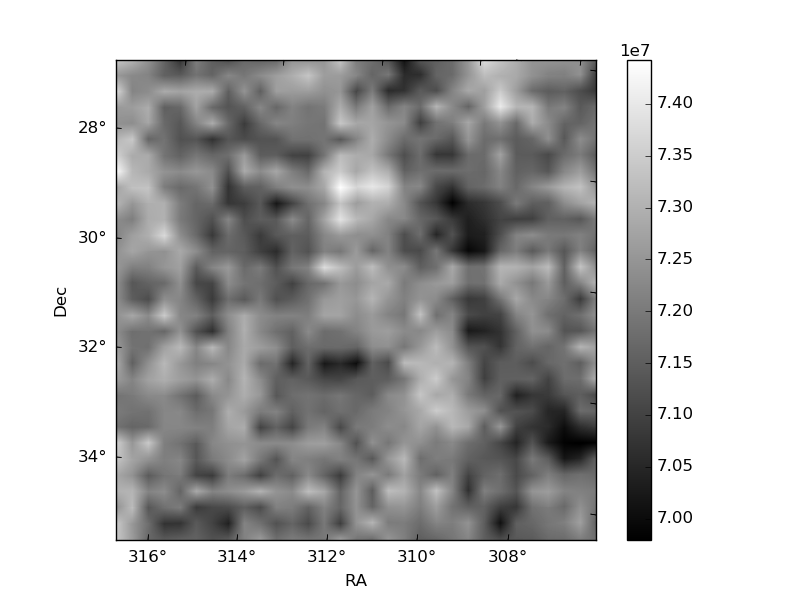
Histogram calculated using DETX and DETY for each event in the final _common_clean file
| Quadrant A |  |
 |
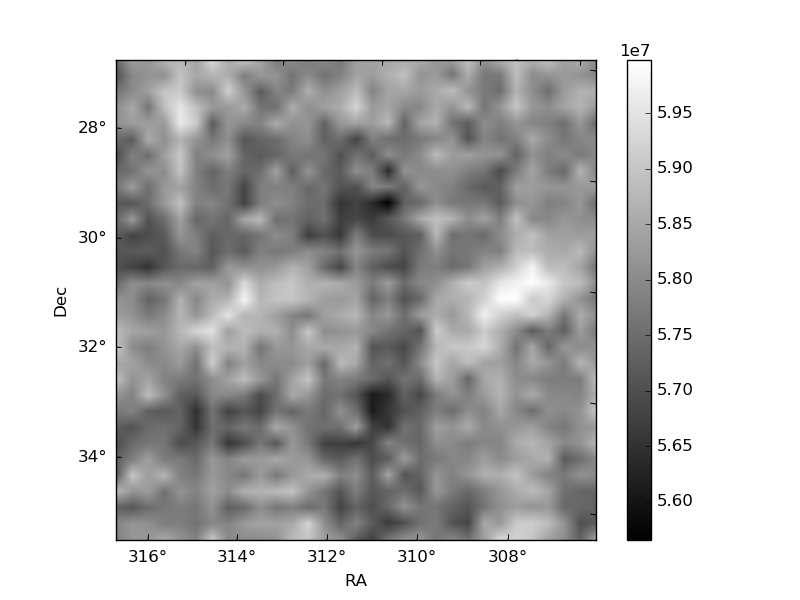
Quadrant B |
|---|---|---|---|
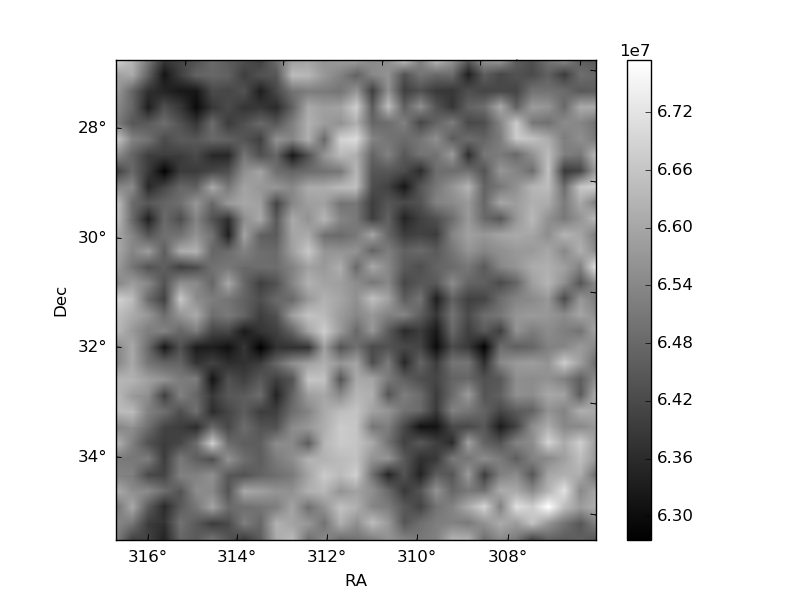
| Quadrant D |  |
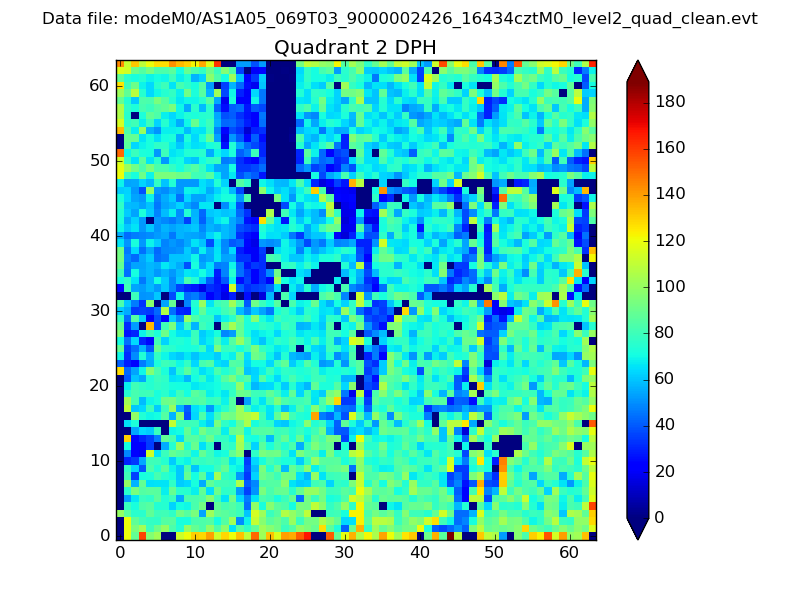 |
Quadrant C |
| Plot type | Count rate plots | Images |
|---|---|---|
| Comparison with Poisson distribution Blue bars denote a histogram of data divided into 1 sec bins. Red curve is a Poisson curve with rate = median count rate of data. |
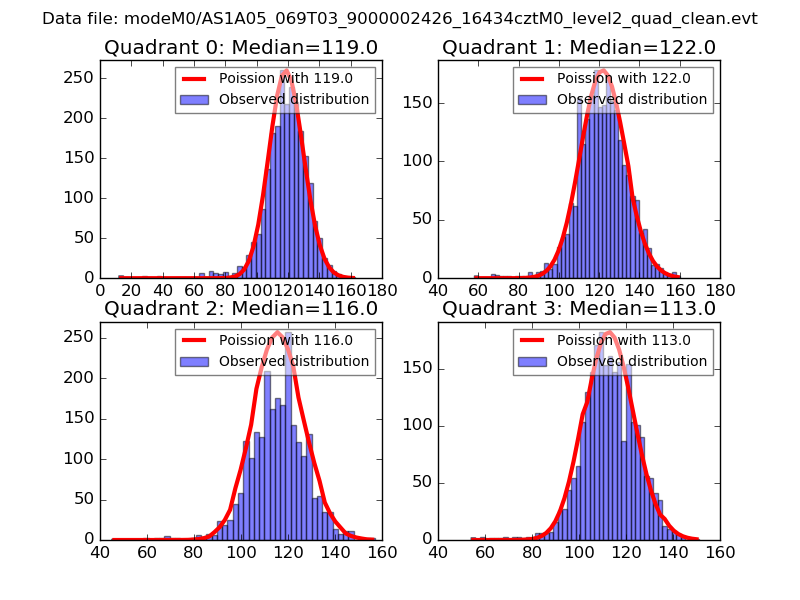 |
 |
| Quadrant-wise count rates Data is divided into 100 sec bins |
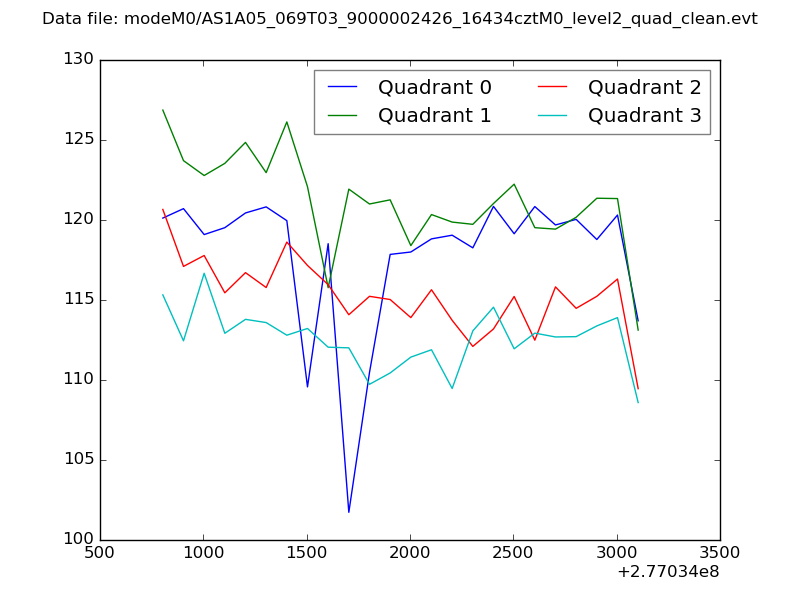 |
|
| Module-wise count rates for Quadrant A Data is divided into 100 sec bins |
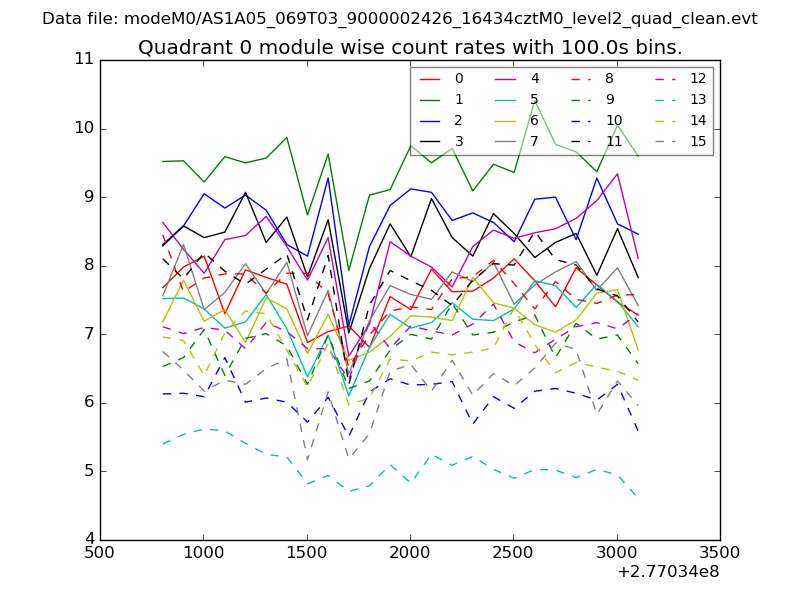 |
 |
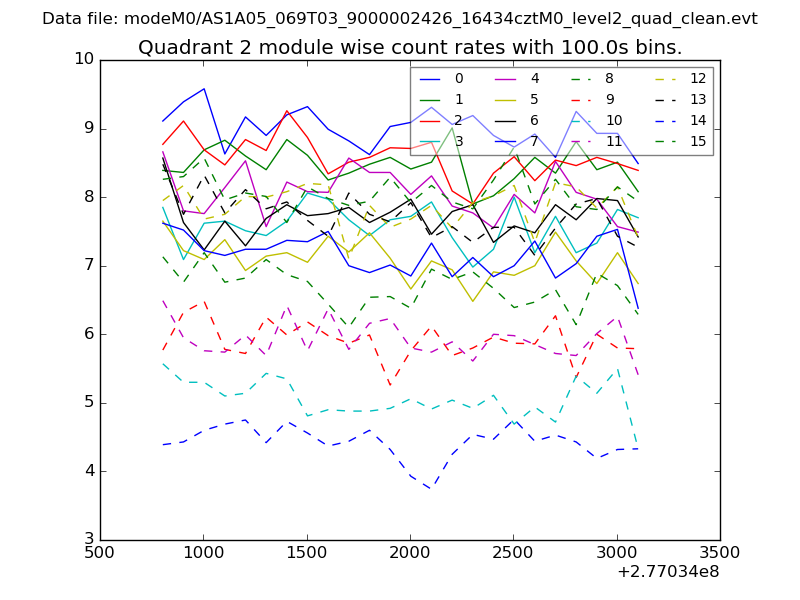
| Module-wise count rates for Quadrant B Data is divided into 100 sec bins |
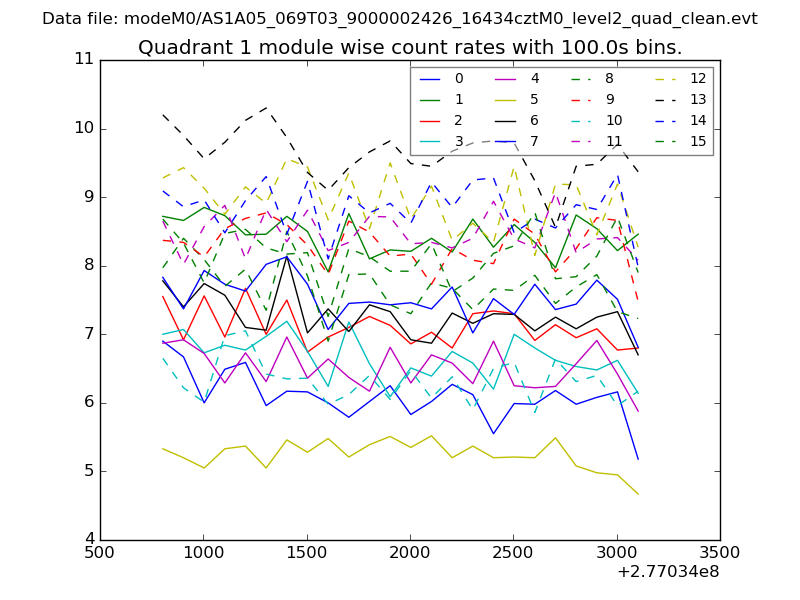 |
 |
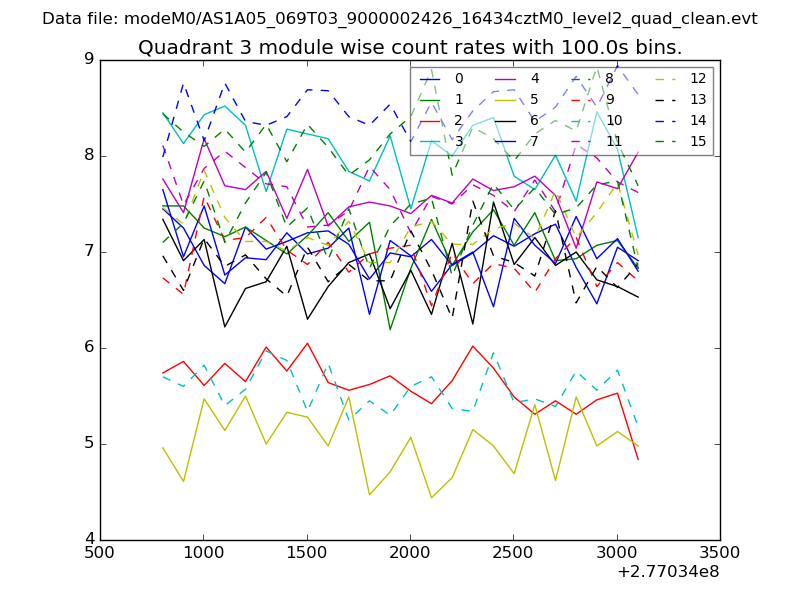
| Module-wise count rates for Quadrant C Data is divided into 100 sec bins |
 |
 |
| Module-wise count rates for Quadrant D Data is divided into 100 sec bins |
 |
 |
| Parameter | Plot |
|---|---|
| CZT HV Monitor | 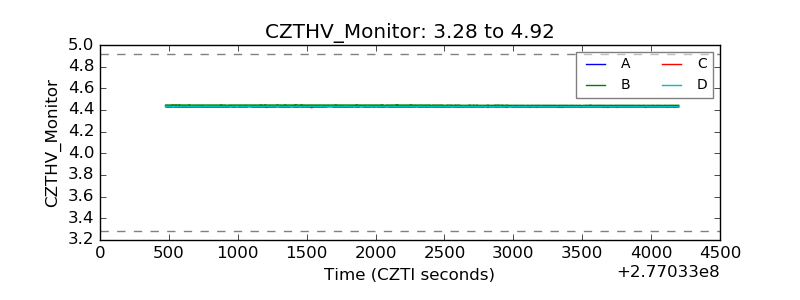 |
| D_VDD | 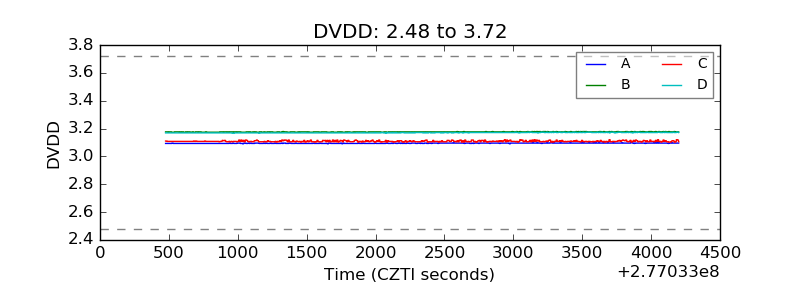 |
| Temperature 1 | 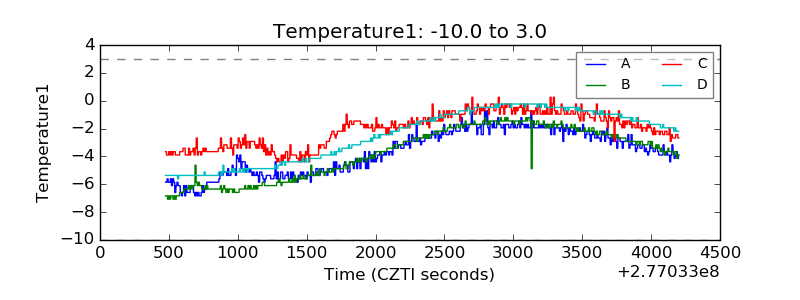 |
| Veto HV Monitor | 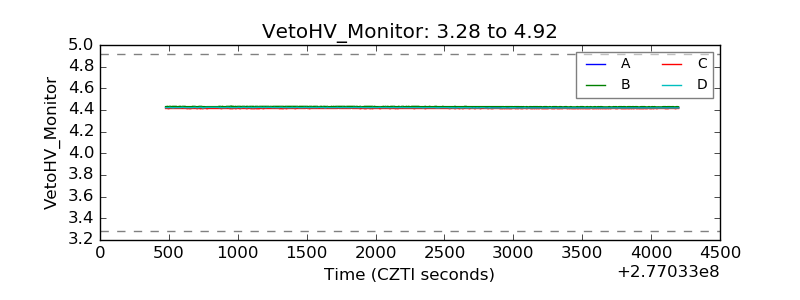 |
| Veto LLD | 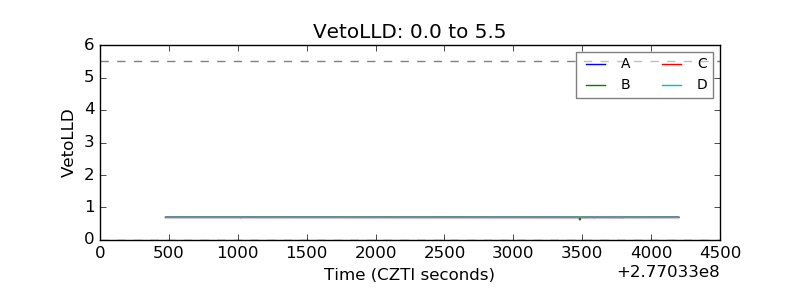 |
| Alpha Counter | 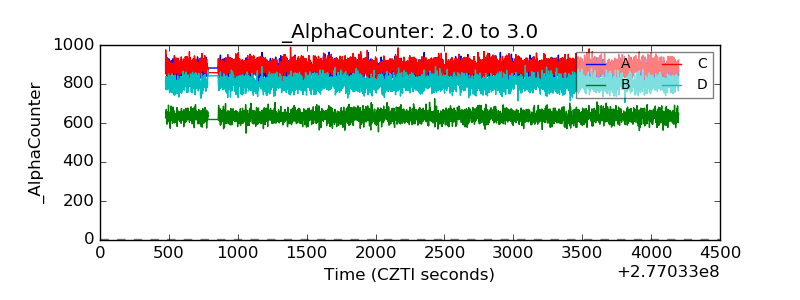 |
| _CPM_Rate | 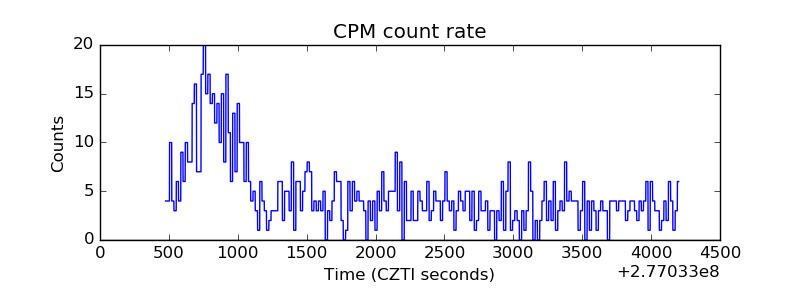 |
| CZT Counter | 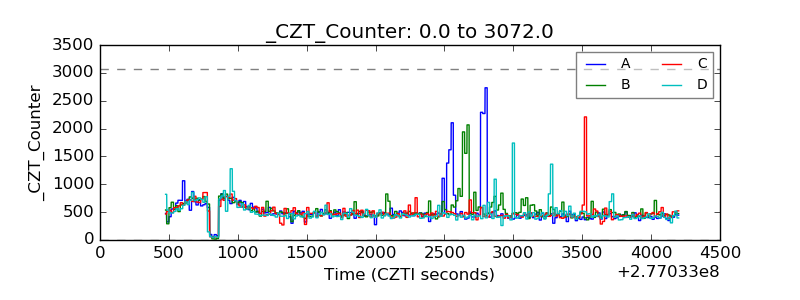 |
| +2.5 Volts monitor |  |
| +5 Volts monitor |  |
| _ROLL_ROT | 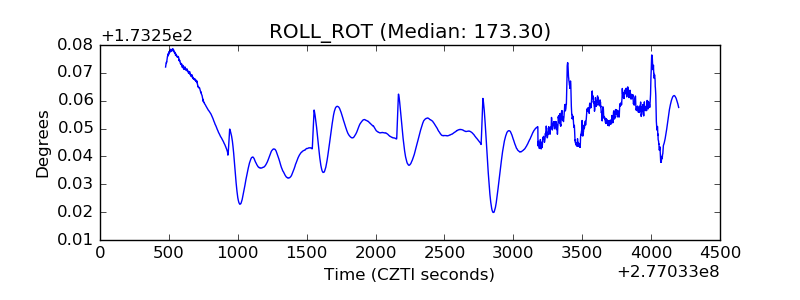 |
| _Roll_DEC | 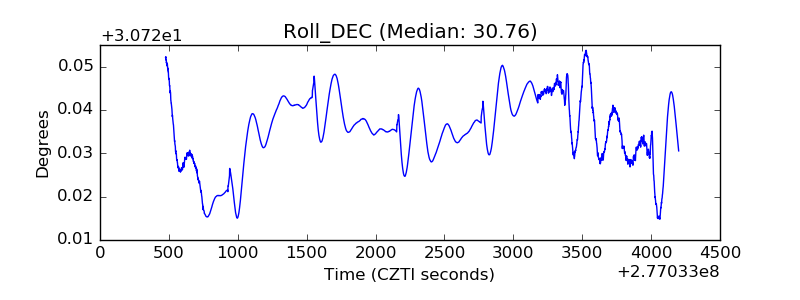 |
| _Roll_RA | 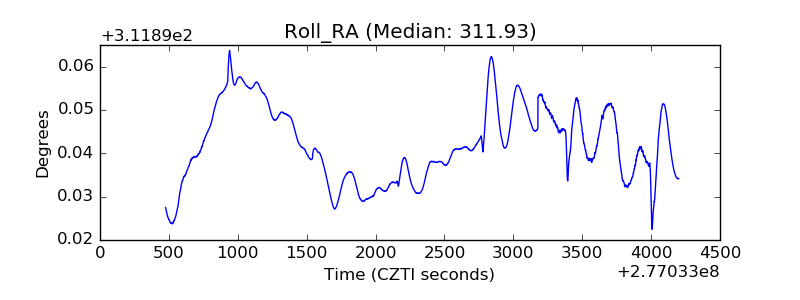 |
| Veto Counter | 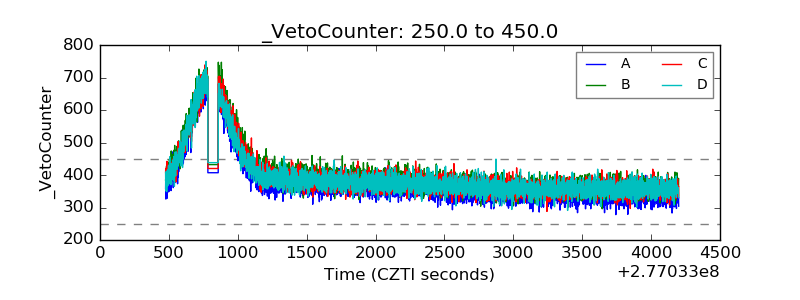 |