| Param | Original file | Final file |
|---|---|---|
| Filename | modeM0/AS1A05_069T04_9000002428cztM0_level2.fits | modeM0/AS1A05_069T04_9000002428cztM0_level2_quad_clean.evt |
| Size (bytes) | 610,603,200 | 525,715,200 |
| Size | 582.3 MB | 501.4 MB |
| Events in quadrant A | 3,476,950 | 2,822,644 |
| Events in quadrant B | 3,671,992 | 3,117,702 |
| Events in quadrant C | 3,626,028 | 2,826,680 |
| Events in quadrant D | 3,229,868 | 2,670,823 |
| Mode M0 | |||
|---|---|---|---|
| Quadrant | BADHDUFLAG | Total packets | Discarded packets |
| A | 0 | 186996 | 0 |
| B | 0 | 147950 | 0 |
| C | 0 | 177600 | 0 |
| D | 0 | 145992 | 0 |
| Mode SS | |||
|---|---|---|---|
| Quadrant | BADHDUFLAG | Total packets | Discarded packets |
| A | 0 | 1334 | 0 |
| B | 0 | 1334 | 0 |
| C | 0 | 1334 | 0 |
| D | 0 | 1334 | 0 |
| Mode M9 | |||
|---|---|---|---|
| Quadrant | BADHDUFLAG | Total packets | Discarded packets |
| A | 0 | 109 | 0 |
| B | 0 | 109 | 0 |
| C | 0 | 109 | 0 |
| D | 0 | 109 | 0 |
| Quadrant | Total seconds | Saturated seconds | Saturation percentage |
|---|---|---|---|
| A | 65327 | 8487 | 12.991566% |
| B | 65327 | 1130 | 1.729760% |
| C | 65327 | 3889 | 5.953128% |
| D | 65327 | 898 | 1.374623% |
Noise dominated data is calculated using 1-second bins in cleaned event files. If a bin has >2000 counts, and if more than 50% of those come from <1% of pixels, then it is considered to be noise-dominated and hence unusable.
| Quadrant | # 1 sec bins | Bins with >0 counts | Bins with >2000 counts | High rate bins dominated by noise | Noise dominated (total time) | Noise dominated (detector-on time) | Marked lightcurve |
|---|---|---|---|---|---|---|---|
| A | 76612 | 64338 | 0 | 0 | 0.00% | 0.00% |  |
| B | 76612 | 65315 | 0 | 0 | 0.00% | 0.00% |  |
| C | 76612 | 65228 | 0 | 0 | 0.00% | 0.00% |  |
| D | 76612 | 65315 | 0 | 0 | 0.00% | 0.00% | 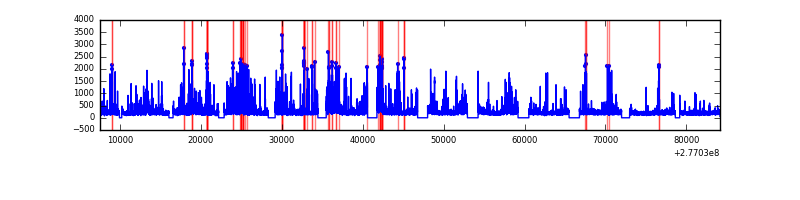 |
Top three noisy pixels from each quadrant. If the there are fewer than three noisy pixels in the level2.evt file, extra rows are filled as -1
| Pixel properties | Quadrant properties | ||||||
|---|---|---|---|---|---|---|---|
| Quadrant | DetID | PixID | Counts | Sigma | Mean | Median | Sigma |
| A | 0 | 29 | 3354 | 11.3 | 903 | 848 | 221.7 |
| A | 7 | 110 | 2766 | 8.65 | 903 | 848 | 221.7 |
| A | 0 | 30 | 2627 | 8.02 | 903 | 848 | 221.7 |
| B | 2 | 9 | 2946 | 10.56 | 973 | 928 | 191.1 |
| B | 2 | 8 | 2515 | 8.3 | 973 | 928 | 191.1 |
| B | 14 | 254 | 2467 | 8.05 | 973 | 928 | 191.1 |
| C | 1 | 80 | 2683 | 7.24 | 956 | 886 | 248.4 |
| C | 1 | 81 | 2642 | 7.07 | 956 | 886 | 248.4 |
| C | 12 | 241 | 2596 | 6.89 | 956 | 886 | 248.4 |
| D | 3 | 14 | 2400 | 6.33 | 921 | 836 | 247.1 |
| D | 6 | 231 | 2353 | 6.14 | 921 | 836 | 247.1 |
| D | 6 | 38 | 2235 | 5.66 | 921 | 836 | 247.1 |
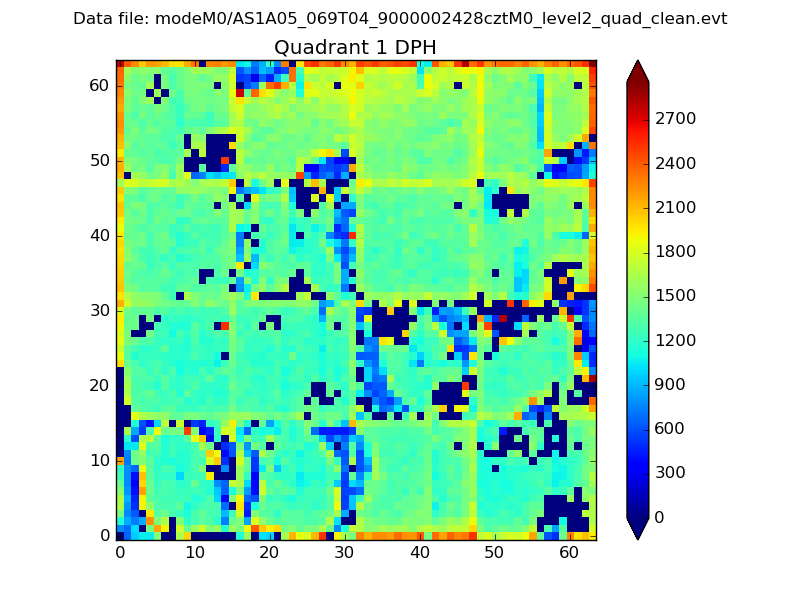
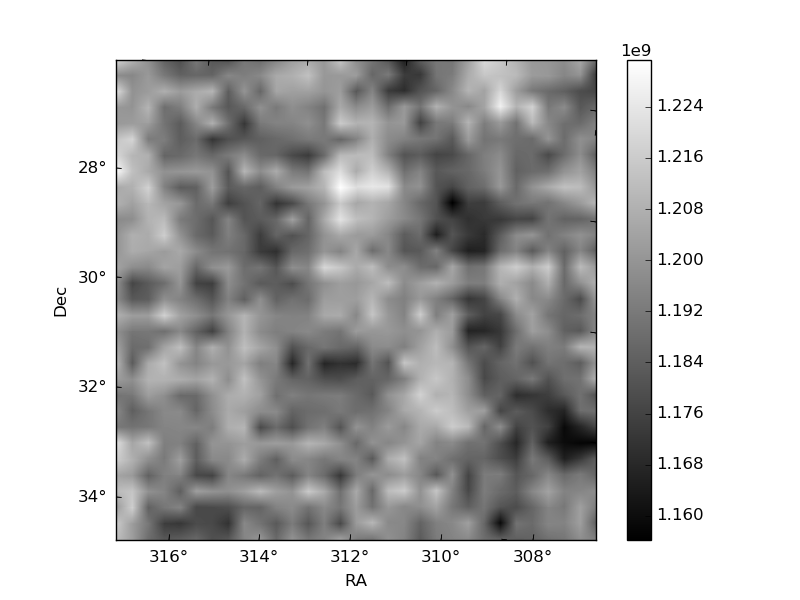
Histogram calculated using DETX and DETY for each event in the final _common_clean file
| Quadrant A |  |
 |
Quadrant B |
|---|---|---|---|
| Quadrant D | 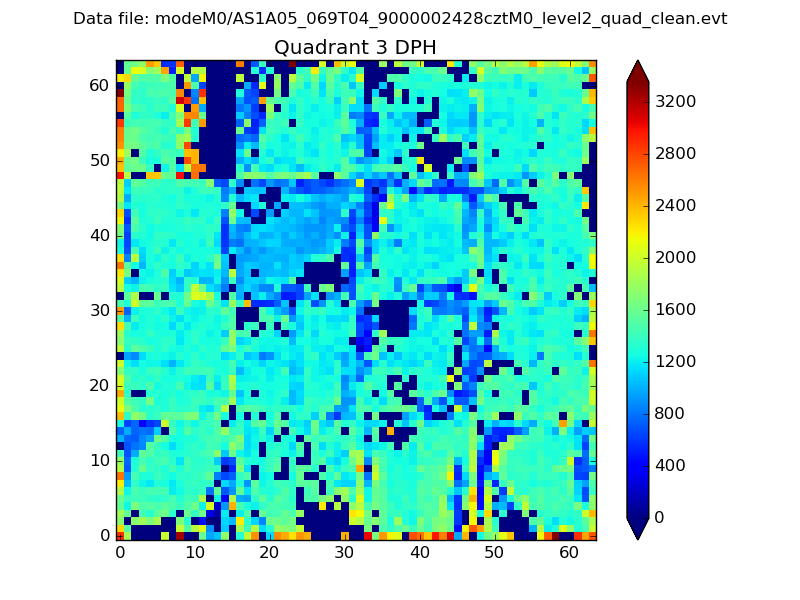 |
 |
Quadrant C |
| Plot type | Count rate plots | Images |
|---|---|---|
| Comparison with Poisson distribution Blue bars denote a histogram of data divided into 1 sec bins. Red curve is a Poisson curve with rate = median count rate of data. |
 |
 |
| Quadrant-wise count rates Data is divided into 100 sec bins |
 |
|
| Module-wise count rates for Quadrant A Data is divided into 100 sec bins |
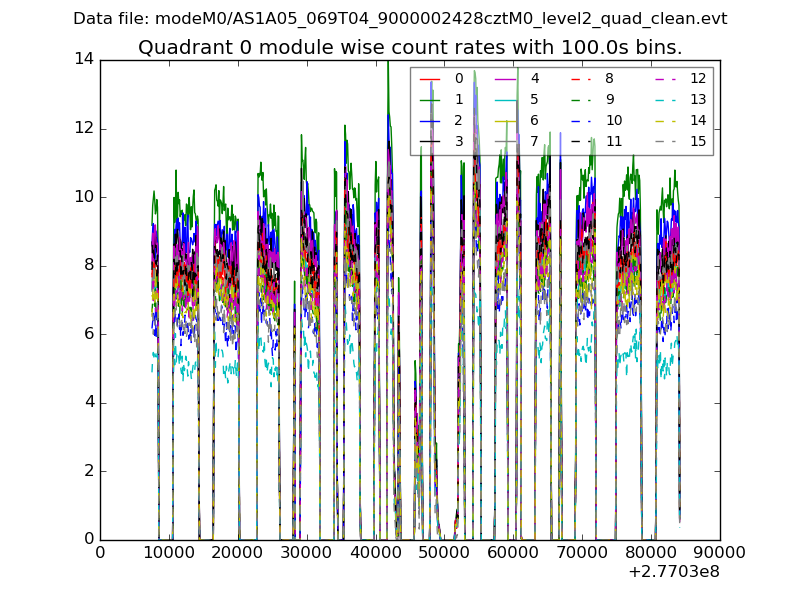 |
 |
| Module-wise count rates for Quadrant B Data is divided into 100 sec bins |
 |
 |
| Module-wise count rates for Quadrant C Data is divided into 100 sec bins |
 |
 |
| Module-wise count rates for Quadrant D Data is divided into 100 sec bins |
 |
 |
| Parameter | Plot |
|---|---|
| CZT HV Monitor | 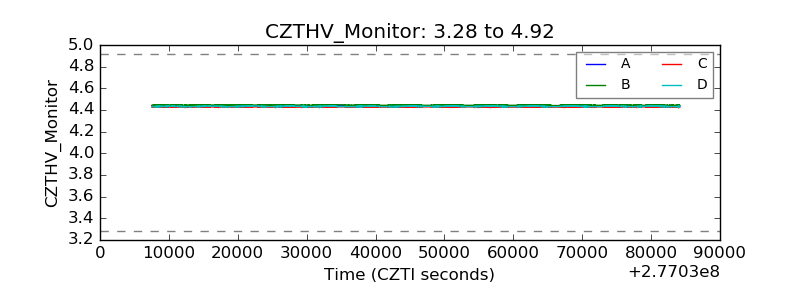 |
| D_VDD | 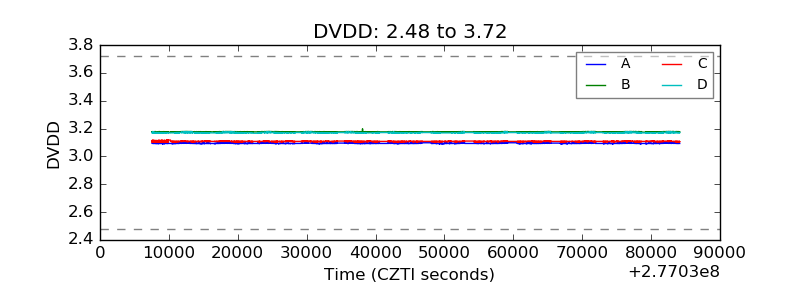 |
| Temperature 1 | 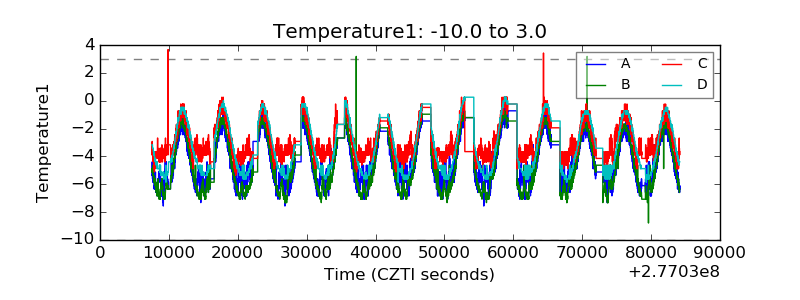 |
| Veto HV Monitor |  |
| Veto LLD |  |
| Alpha Counter |  |
| _CPM_Rate | 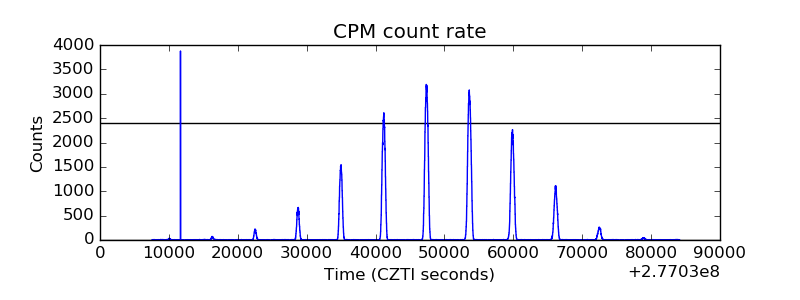 |
| CZT Counter | 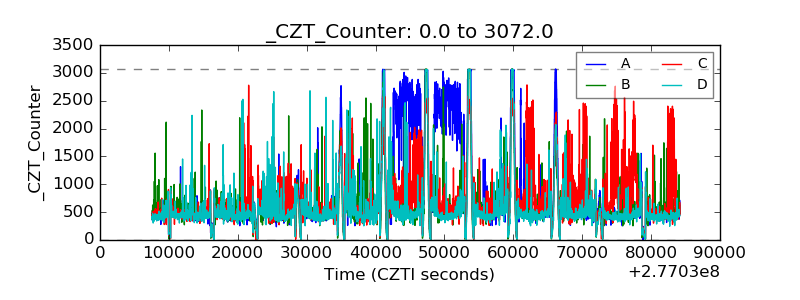 |
| +2.5 Volts monitor |  |
| +5 Volts monitor |  |
| _ROLL_ROT | 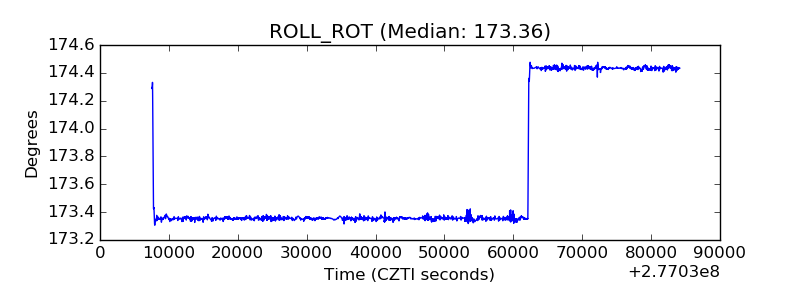 |
| _Roll_DEC | 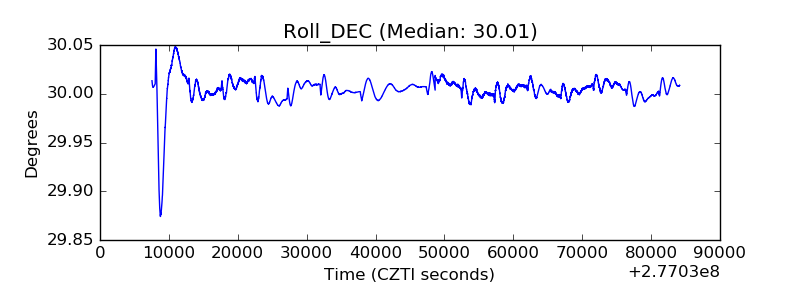 |
| _Roll_RA |  |
| Veto Counter |  |