| Param | Original file | Final file |
|---|---|---|
| Filename | modeM0/AS1A05_069T04_9000002428_16434cztM0_level2.evt | modeM0/AS1A05_069T04_9000002428_16434cztM0_level2_quad_clean.evt |
| Size (bytes) | 278,092,800 | 45,362,880 |
| Size | 265.2 MB | 43.3 MB |
| Events in quadrant A | 1,985,058 | 274,280 |
| Events in quadrant B | 2,214,634 | 279,690 |
| Events in quadrant C | 2,019,694 | 268,280 |
| Events in quadrant D | 1,922,921 | 262,478 |
| Mode M0 | |||
|---|---|---|---|
| Quadrant | BADHDUFLAG | Total packets | Discarded packets |
| A | 0 | 8511 | 2 |
| B | 0 | 9029 | 1 |
| C | 0 | 8526 | 1 |
| D | 0 | 8563 | 1 |
| Mode SS | |||
|---|---|---|---|
| Quadrant | BADHDUFLAG | Total packets | Discarded packets |
| A | 0 | 84 | 0 |
| B | 0 | 84 | 0 |
| C | 0 | 84 | 0 |
| D | 0 | 84 | 0 |
| Mode M9 | |||
|---|---|---|---|
| Quadrant | BADHDUFLAG | Total packets | Discarded packets |
| A | 0 | 3 | 0 |
| B | 0 | 3 | 0 |
| C | 0 | 3 | 0 |
| D | 0 | 3 | 0 |
| Quadrant | Total seconds | Saturated seconds | Saturation percentage |
|---|---|---|---|
| A | 4090 | 134 | 3.276284% |
| B | 4090 | 140 | 3.422983% |
| C | 4090 | 125 | 3.056235% |
| D | 4090 | 109 | 2.665037% |
Noise dominated data is calculated using 1-second bins in cleaned event files. If a bin has >2000 counts, and if more than 50% of those come from <1% of pixels, then it is considered to be noise-dominated and hence unusable.
| Quadrant | # 1 sec bins | Bins with >0 counts | Bins with >2000 counts | High rate bins dominated by noise | Noise dominated (total time) | Noise dominated (detector-on time) | Marked lightcurve |
|---|---|---|---|---|---|---|---|
| A | 4381 | 4091 | 3 | 3 | 0.07% | 0.07% | 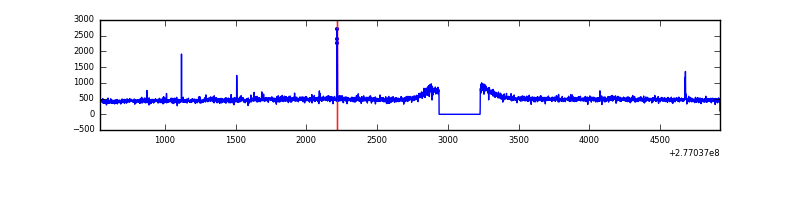 |
| B | 4381 | 4091 | 12 | 12 | 0.27% | 0.29% | 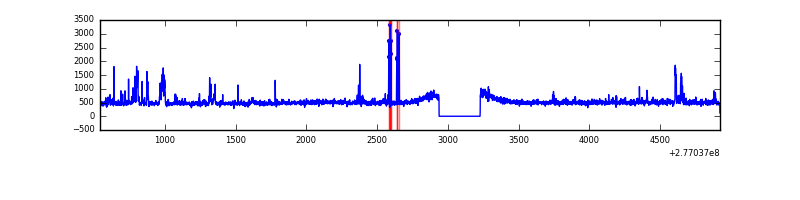 |
| C | 4381 | 4091 | 0 | 0 | 0.00% | 0.00% | 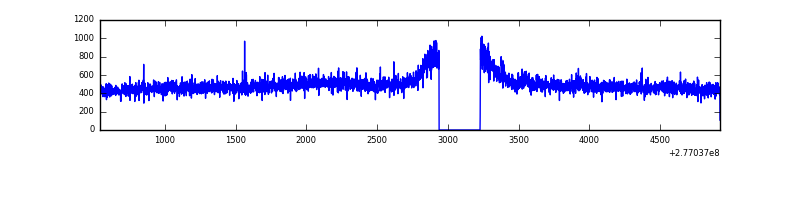 |
| D | 4381 | 4091 | 7 | 7 | 0.16% | 0.17% | 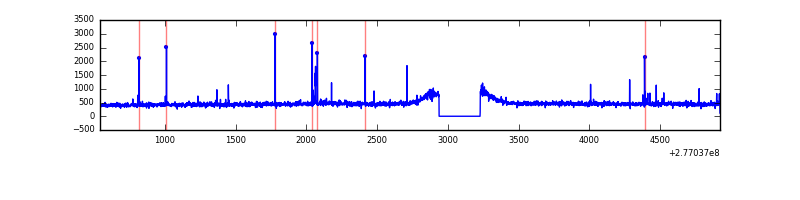 |
Top three noisy pixels from each quadrant. If the there are fewer than three noisy pixels in the level2.evt file, extra rows are filled as -1
| Pixel properties | Quadrant properties | ||||||
|---|---|---|---|---|---|---|---|
| Quadrant | DetID | PixID | Counts | Sigma | Mean | Median | Sigma |
| A | 15 | 174 | 30195 | 282.71 | 507 | 495 | 105.1 |
| A | 0 | 226 | 4469 | 37.83 | 507 | 495 | 105.1 |
| A | 9 | 143 | 3929 | 32.69 | 507 | 495 | 105.1 |
| B | 15 | 35 | 88560 | 877.64 | 510 | 496 | 100.3 |
| B | 0 | 189 | 72199 | 714.59 | 510 | 496 | 100.3 |
| B | 0 | 198 | 20871 | 203.06 | 510 | 496 | 100.3 |
| C | 14 | 238 | 73824 | 631.96 | 489 | 491 | 116.0 |
| C | 3 | 233 | 18510 | 155.28 | 489 | 491 | 116.0 |
| C | 7 | 247 | 14103 | 117.3 | 489 | 491 | 116.0 |
| D | 12 | 218 | 17027 | 133.11 | 496 | 480 | 124.3 |
| D | 2 | 234 | 15186 | 118.3 | 496 | 480 | 124.3 |
| D | 2 | 120 | 11994 | 92.63 | 496 | 480 | 124.3 |
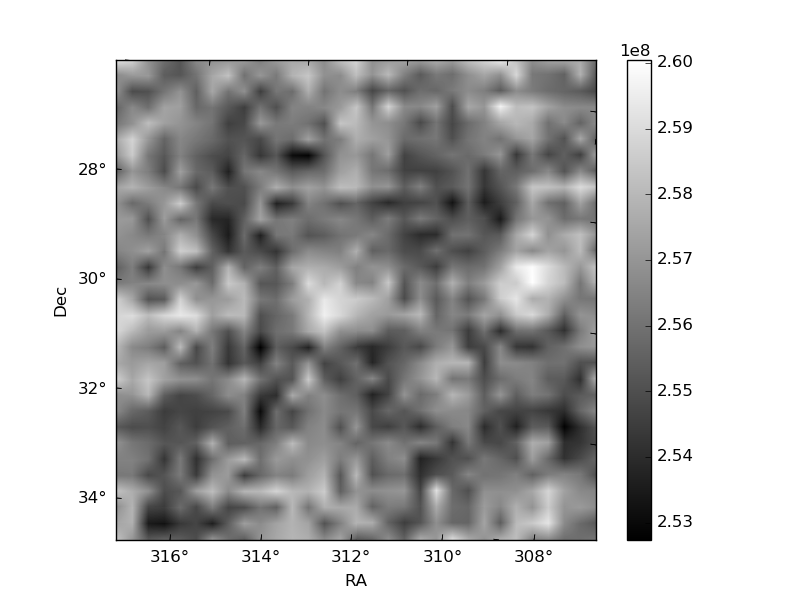
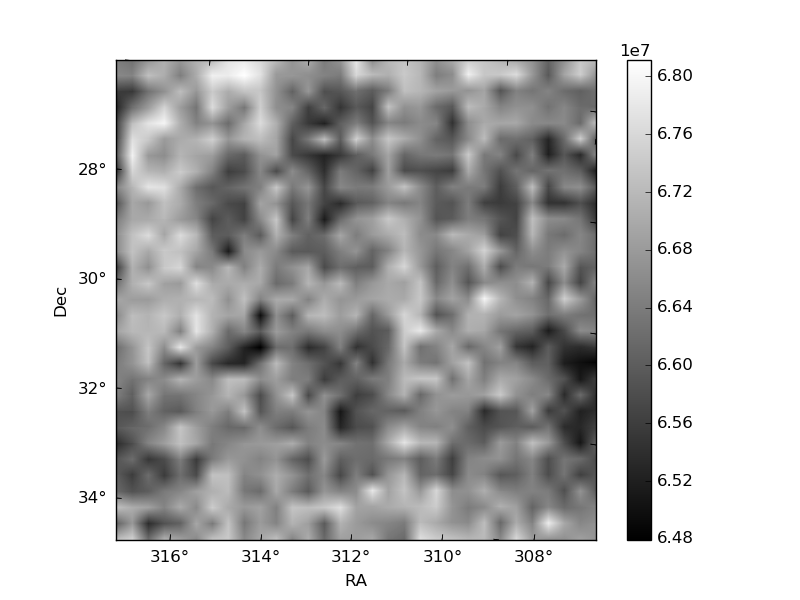
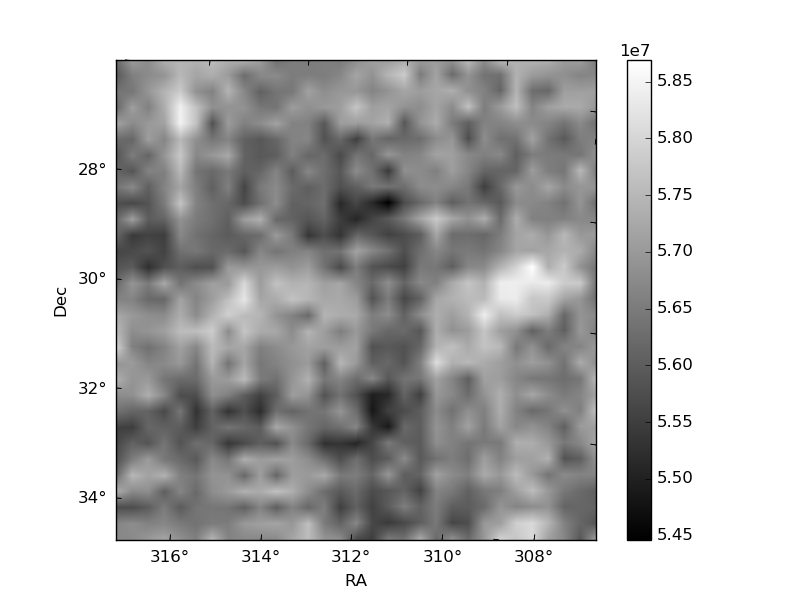
Histogram calculated using DETX and DETY for each event in the final _common_clean file
| Quadrant A | 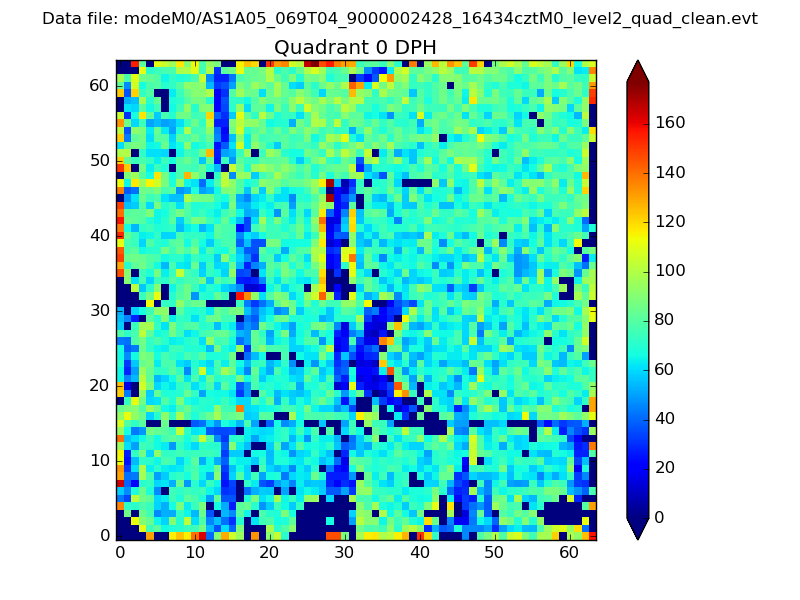 |
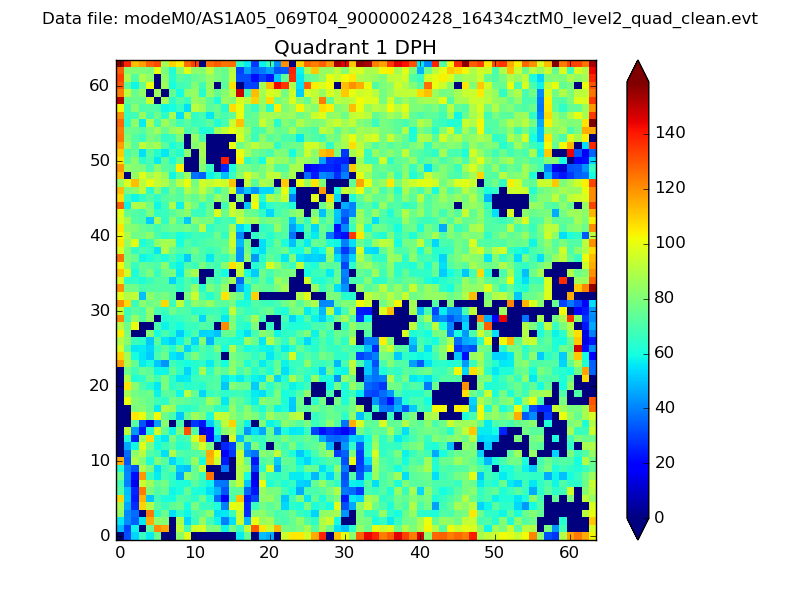 |
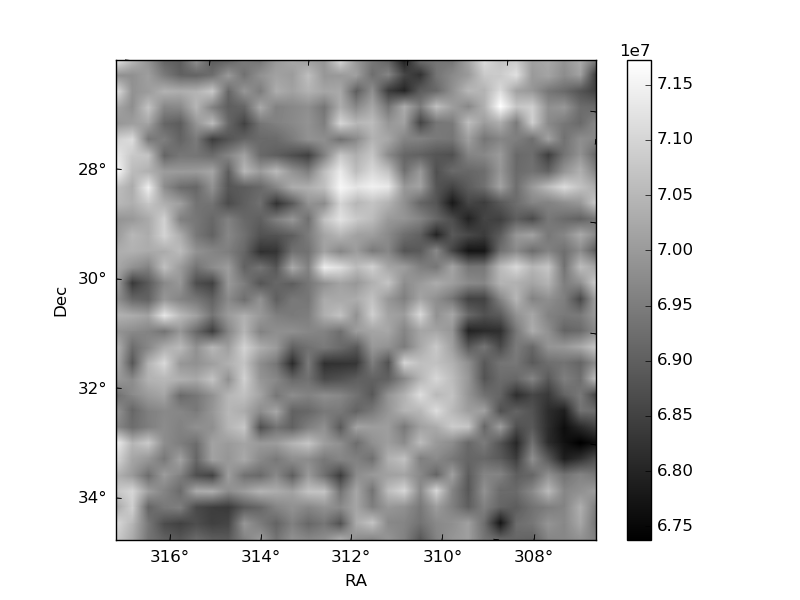
Quadrant B |
|---|---|---|---|
| Quadrant D | 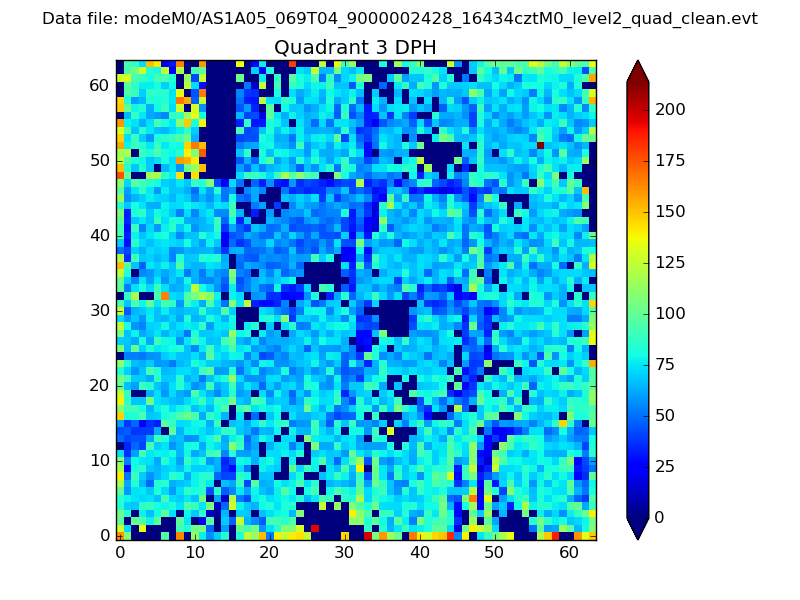 |
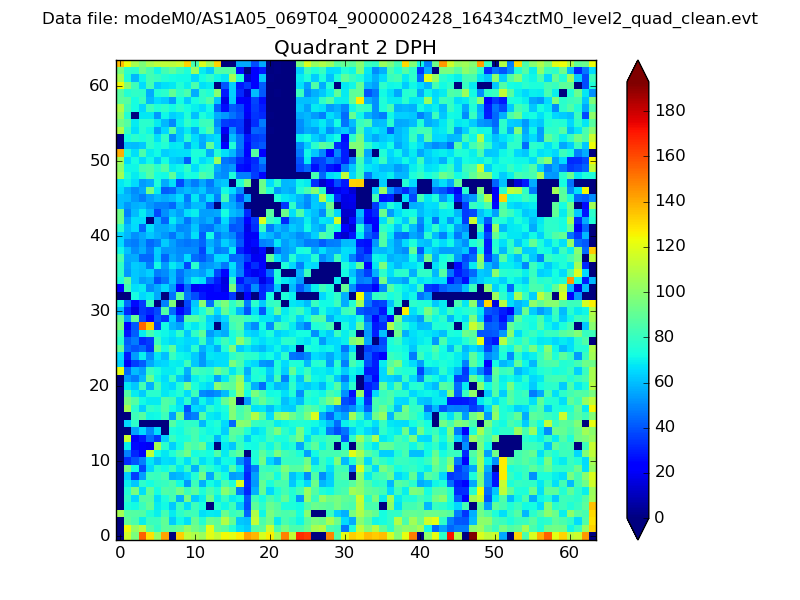 |
Quadrant C |
| Plot type | Count rate plots | Images |
|---|---|---|
| Comparison with Poisson distribution Blue bars denote a histogram of data divided into 1 sec bins. Red curve is a Poisson curve with rate = median count rate of data. |
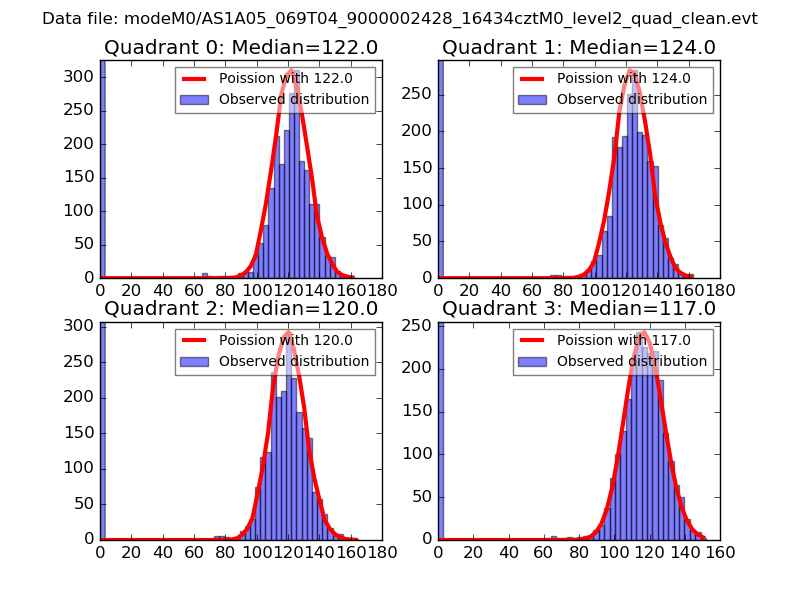 |
 |
| Quadrant-wise count rates Data is divided into 100 sec bins |
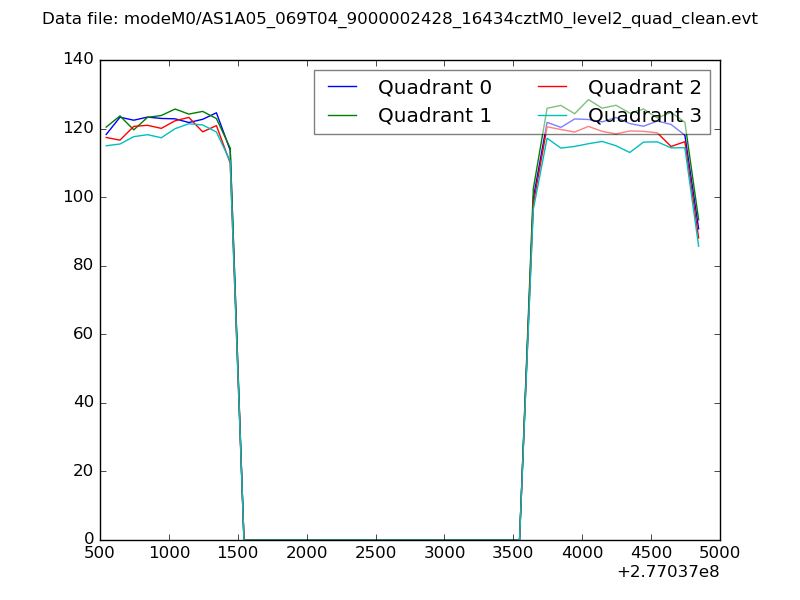 |
|
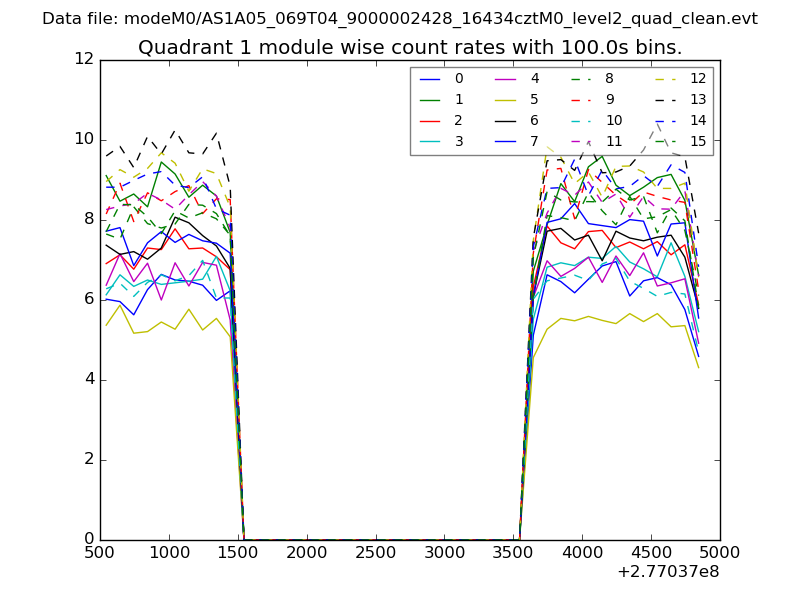
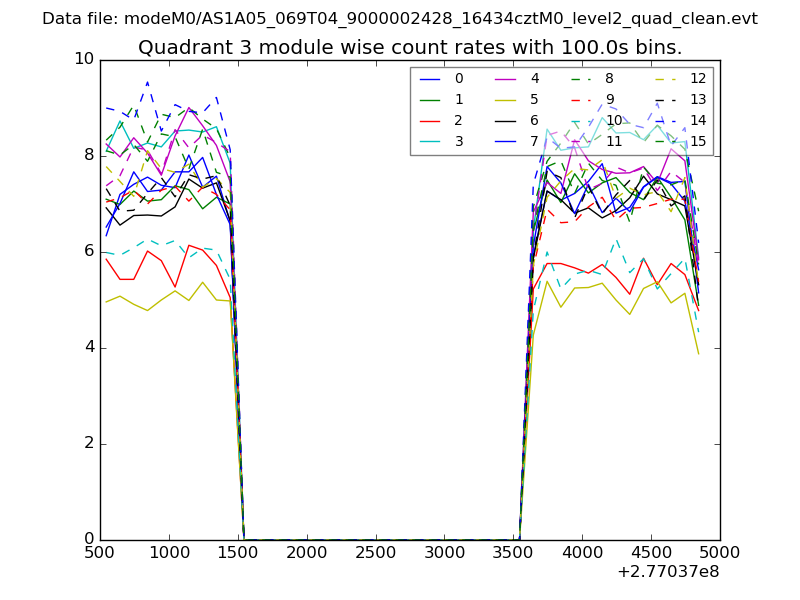
| Module-wise count rates for Quadrant A Data is divided into 100 sec bins |
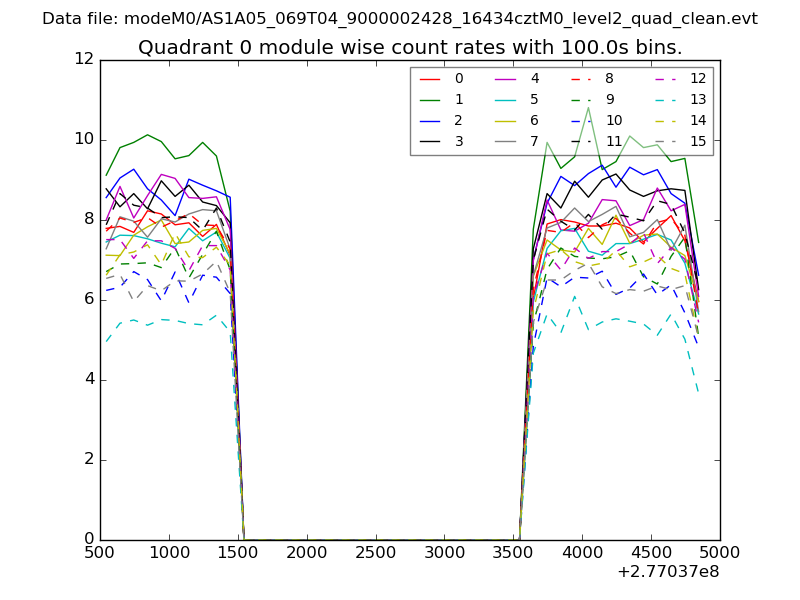 |
 |
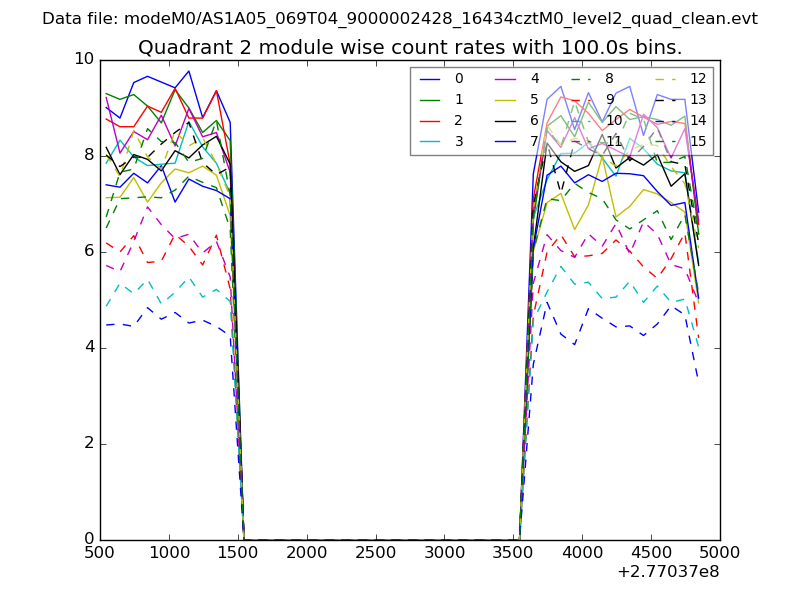
| Module-wise count rates for Quadrant B Data is divided into 100 sec bins |
 |
 |
| Module-wise count rates for Quadrant C Data is divided into 100 sec bins |
 |
 |
| Module-wise count rates for Quadrant D Data is divided into 100 sec bins |
 |
 |
| Parameter | Plot |
|---|---|
| CZT HV Monitor | 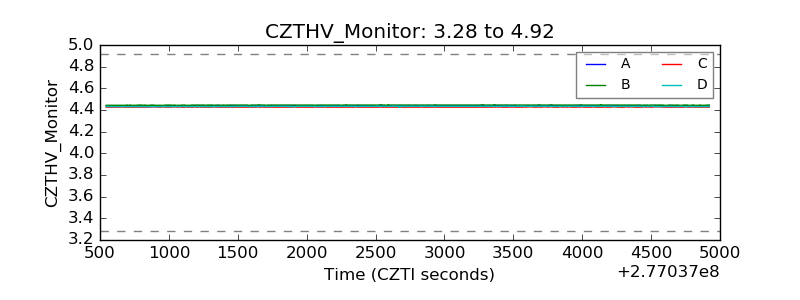 |
| D_VDD | 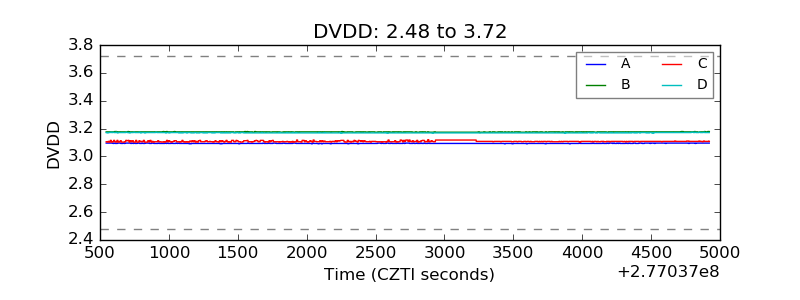 |
| Temperature 1 | 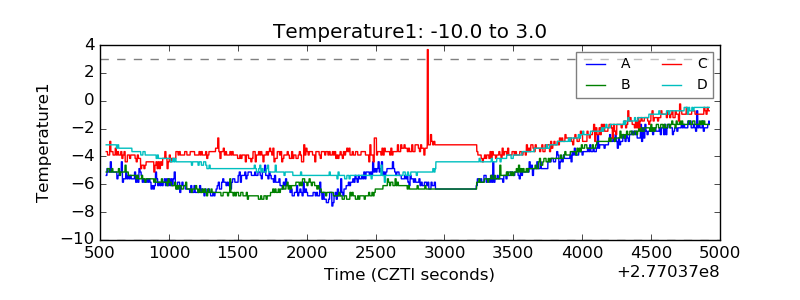 |
| Veto HV Monitor | 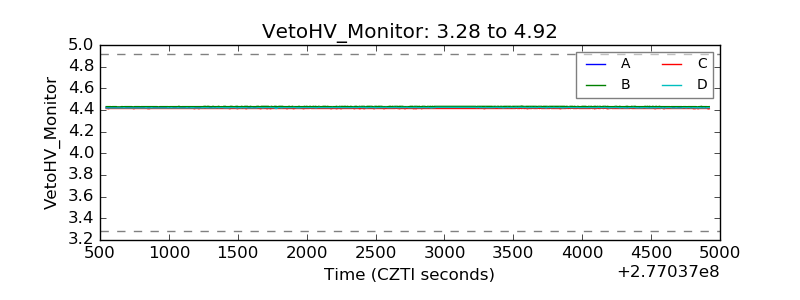 |
| Veto LLD |  |
| Alpha Counter | 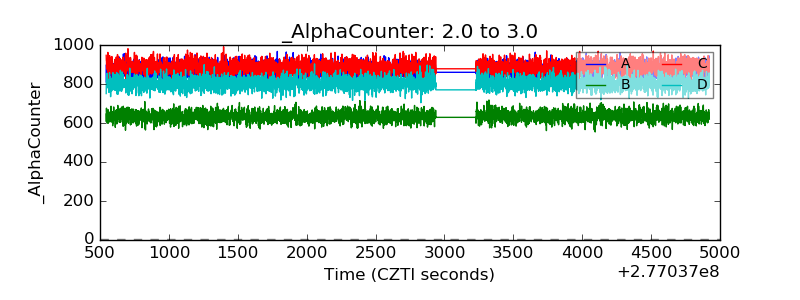 |
| _CPM_Rate | 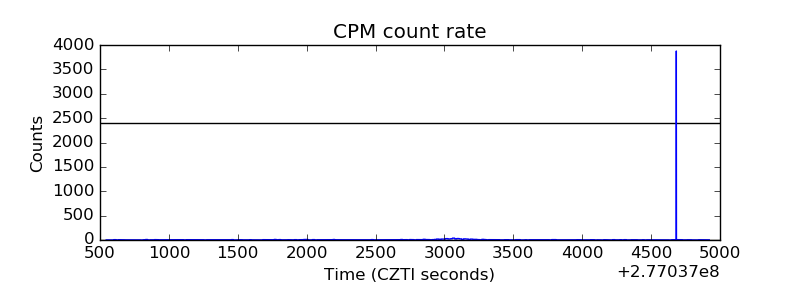 |
| CZT Counter | 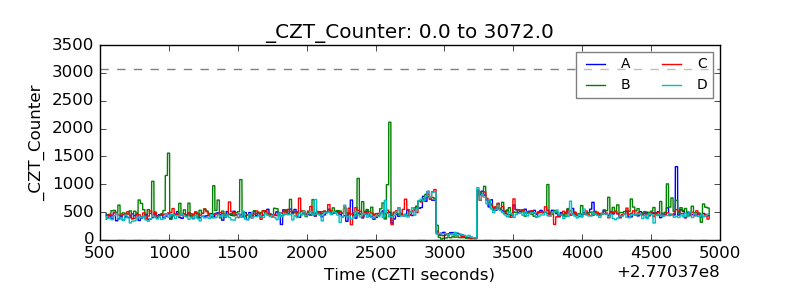 |
| +2.5 Volts monitor |  |
| +5 Volts monitor |  |
| _ROLL_ROT | 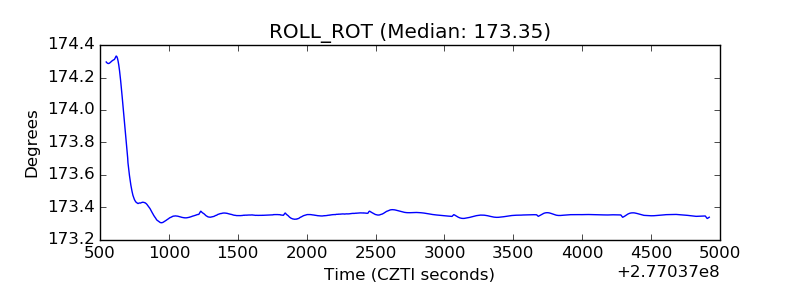 |
| _Roll_DEC | 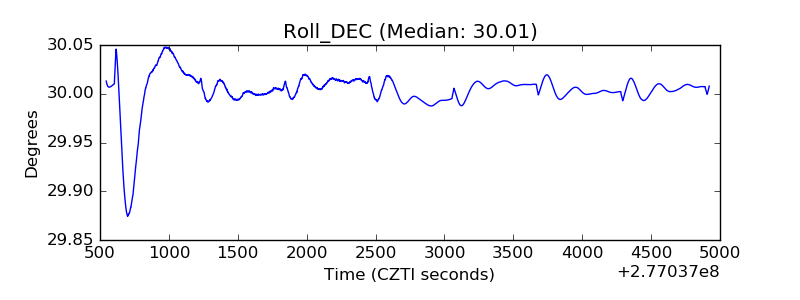 |
| _Roll_RA | 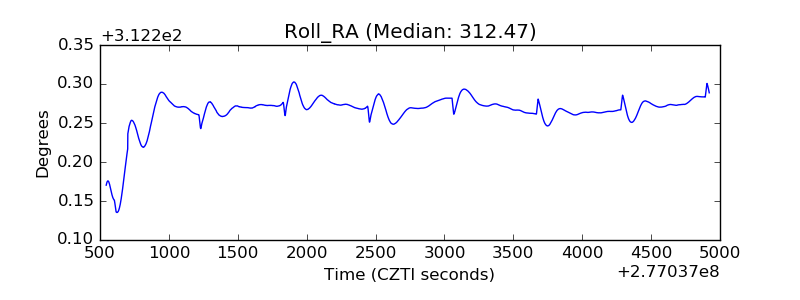 |
| Veto Counter | 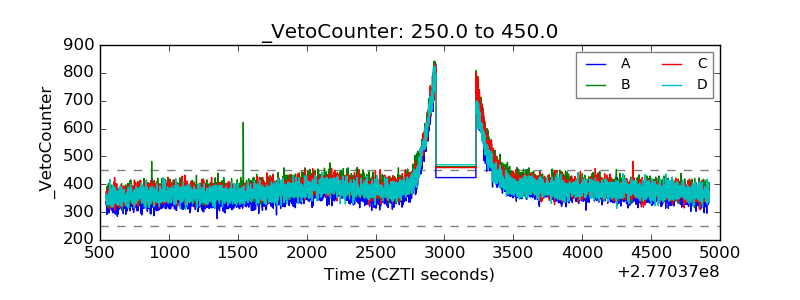 |