| Param | Original file | Final file |
|---|---|---|
| Filename | modeM0/AS1A05_069T04_9000002428_16436cztM0_level2.evt | modeM0/AS1A05_069T04_9000002428_16436cztM0_level2_quad_clean.evt |
| Size (bytes) | 824,719,680 | 159,482,880 |
| Size | 786.5 MB | 152.1 MB |
| Events in quadrant A | 5,521,298 | 1,018,064 |
| Events in quadrant B | 6,208,062 | 1,032,385 |
| Events in quadrant C | 6,284,391 | 988,146 |
| Events in quadrant D | 6,148,404 | 960,145 |
| Mode M0 | |||
|---|---|---|---|
| Quadrant | BADHDUFLAG | Total packets | Discarded packets |
| A | 0 | 24571 | 3 |
| B | 0 | 26003 | 2 |
| C | 0 | 26344 | 2 |
| D | 0 | 26420 | 2 |
| Mode SS | |||
|---|---|---|---|
| Quadrant | BADHDUFLAG | Total packets | Discarded packets |
| A | 0 | 246 | 0 |
| B | 0 | 246 | 0 |
| C | 0 | 246 | 0 |
| D | 0 | 246 | 0 |
| Mode M9 | |||
|---|---|---|---|
| Quadrant | BADHDUFLAG | Total packets | Discarded packets |
| A | 0 | 11 | 0 |
| B | 0 | 11 | 0 |
| C | 0 | 11 | 0 |
| D | 0 | 11 | 0 |
| Quadrant | Total seconds | Saturated seconds | Saturation percentage |
|---|---|---|---|
| A | 12020 | 103 | 0.856905% |
| B | 12020 | 141 | 1.173045% |
| C | 12020 | 329 | 2.737105% |
| D | 12020 | 122 | 1.014975% |
Noise dominated data is calculated using 1-second bins in cleaned event files. If a bin has >2000 counts, and if more than 50% of those come from <1% of pixels, then it is considered to be noise-dominated and hence unusable.
| Quadrant | # 1 sec bins | Bins with >0 counts | Bins with >2000 counts | High rate bins dominated by noise | Noise dominated (total time) | Noise dominated (detector-on time) | Marked lightcurve |
|---|---|---|---|---|---|---|---|
| A | 13221 | 12022 | 0 | 0 | 0.00% | 0.00% | 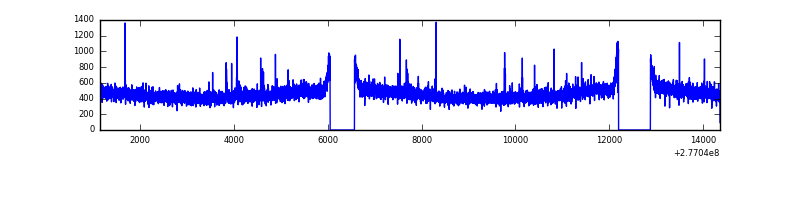 |
| B | 13221 | 12022 | 21 | 21 | 0.16% | 0.17% | 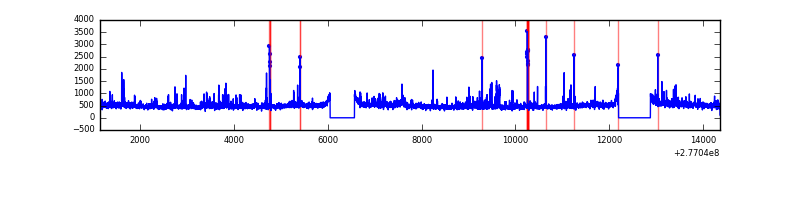 |
| C | 13221 | 12022 | 102 | 102 | 0.77% | 0.85% | 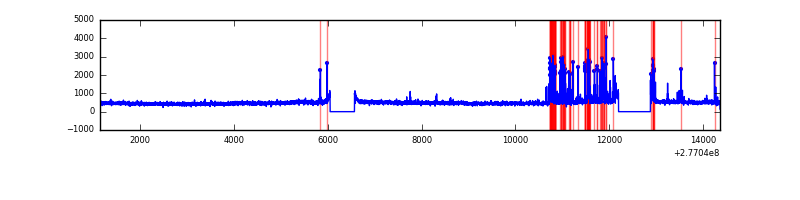 |
| D | 13221 | 12021 | 37 | 37 | 0.28% | 0.31% | 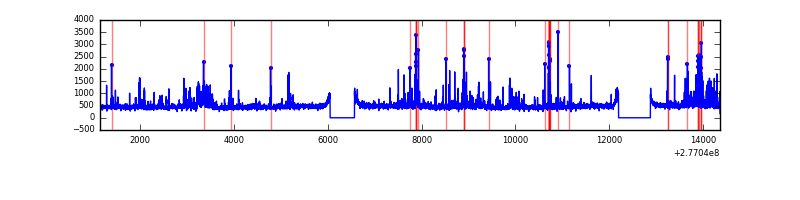 |
Top three noisy pixels from each quadrant. If the there are fewer than three noisy pixels in the level2.evt file, extra rows are filled as -1
| Pixel properties | Quadrant properties | ||||||
|---|---|---|---|---|---|---|---|
| Quadrant | DetID | PixID | Counts | Sigma | Mean | Median | Sigma |
| A | 15 | 174 | 55060 | 185.98 | 1421 | 1390 | 288.6 |
| A | 0 | 226 | 12314 | 37.85 | 1421 | 1390 | 288.6 |
| A | 12 | 194 | 10654 | 32.1 | 1421 | 1390 | 288.6 |
| B | 15 | 35 | 159994 | 579.57 | 1419 | 1378 | 273.7 |
| B | 0 | 198 | 144588 | 523.28 | 1419 | 1378 | 273.7 |
| B | 0 | 189 | 99755 | 359.46 | 1419 | 1378 | 273.7 |
| C | 4 | 254 | 568826 | 1779.6 | 1354 | 1361 | 318.9 |
| C | 14 | 238 | 208005 | 648.05 | 1354 | 1361 | 318.9 |
| C | 3 | 233 | 161132 | 501.05 | 1354 | 1361 | 318.9 |
| D | 5 | 222 | 355492 | 1044.84 | 1383 | 1340 | 339.0 |
| D | 1 | 52 | 192858 | 565.03 | 1383 | 1340 | 339.0 |
| D | 12 | 218 | 168379 | 492.81 | 1383 | 1340 | 339.0 |
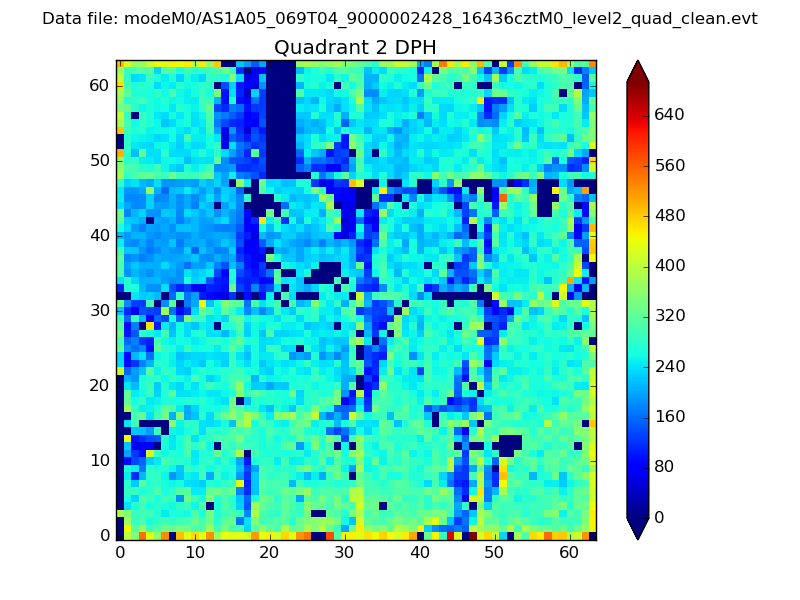
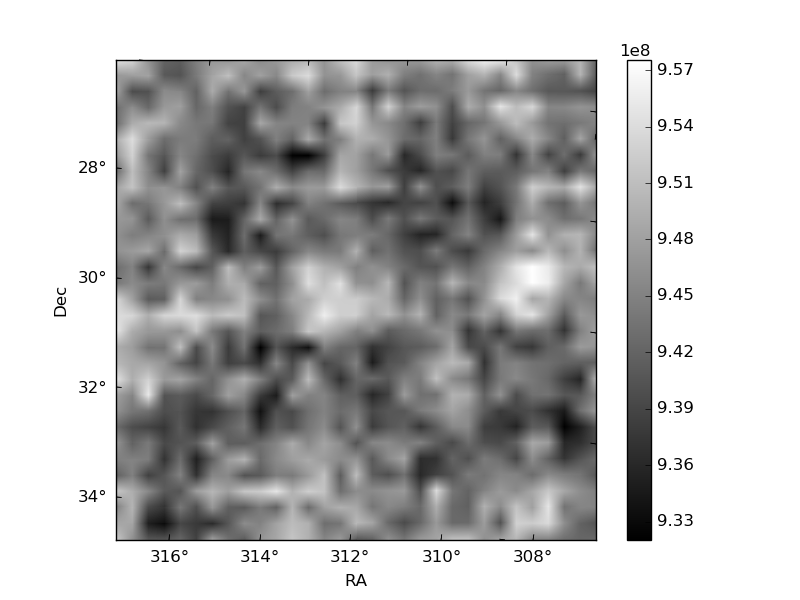
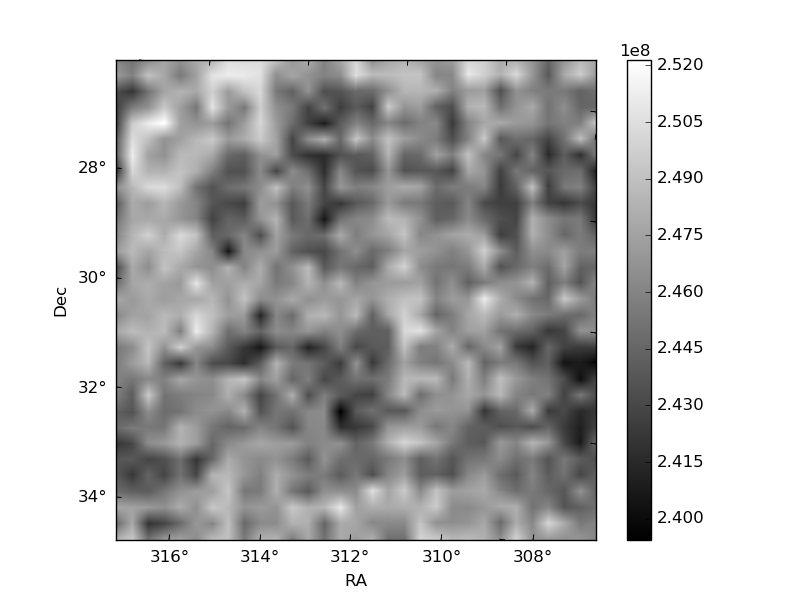
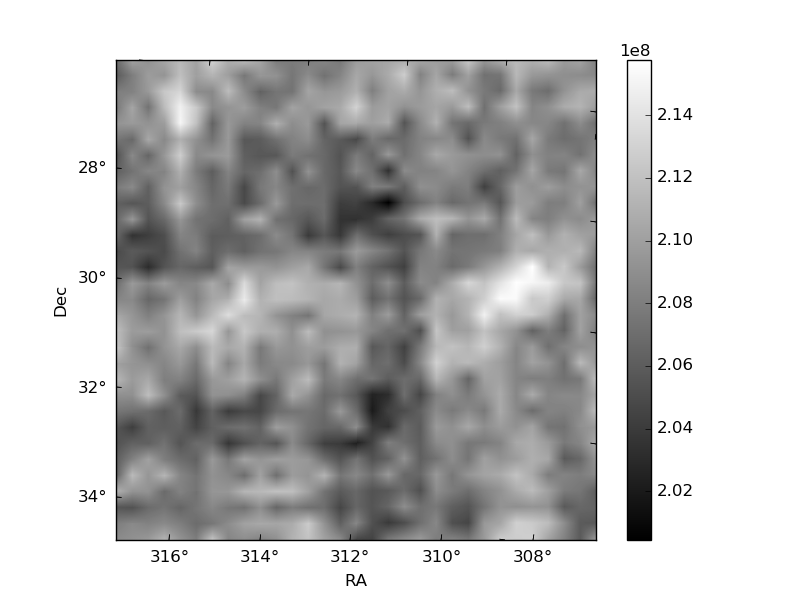
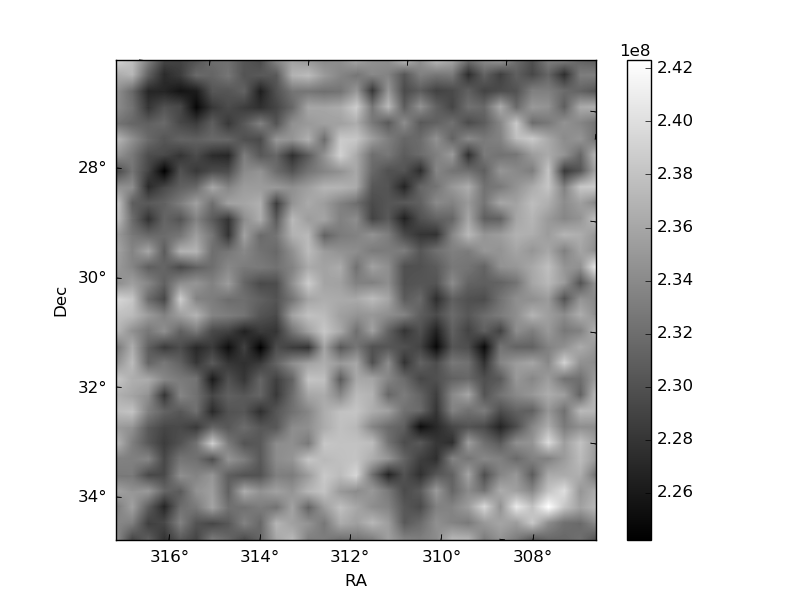
Histogram calculated using DETX and DETY for each event in the final _common_clean file
| Quadrant A | 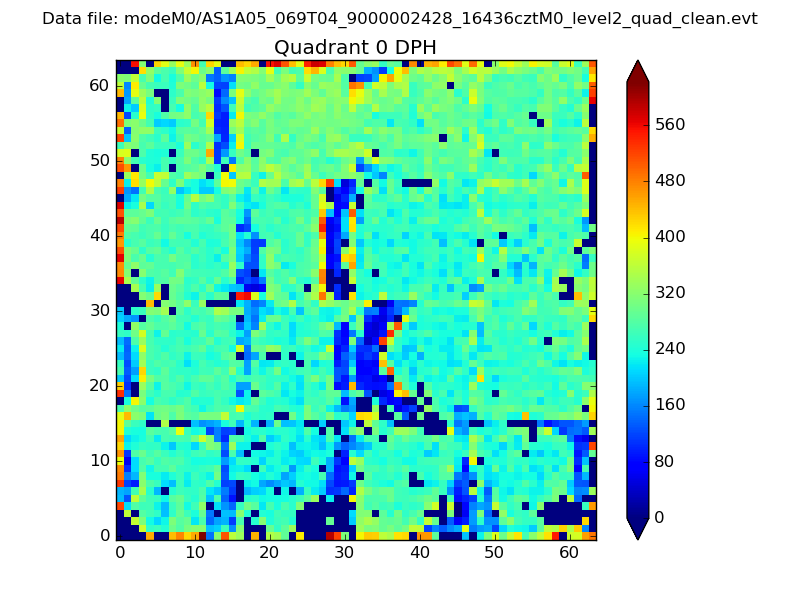 |
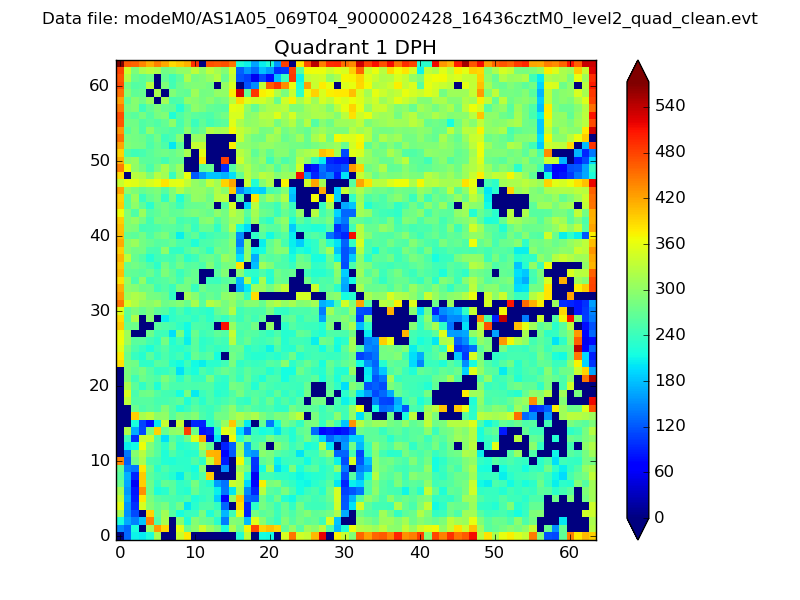 |
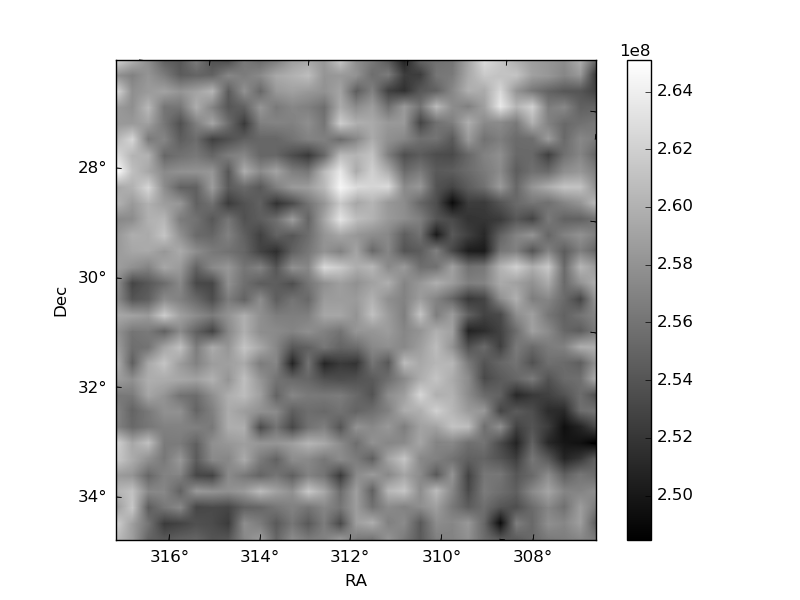
Quadrant B |
|---|---|---|---|
| Quadrant D | 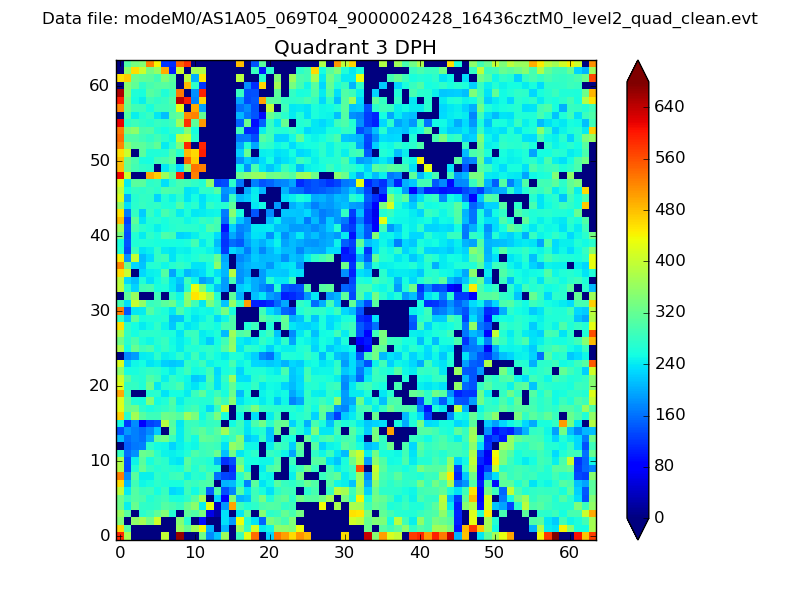 |
 |
Quadrant C |
| Plot type | Count rate plots | Images |
|---|---|---|
| Comparison with Poisson distribution Blue bars denote a histogram of data divided into 1 sec bins. Red curve is a Poisson curve with rate = median count rate of data. |
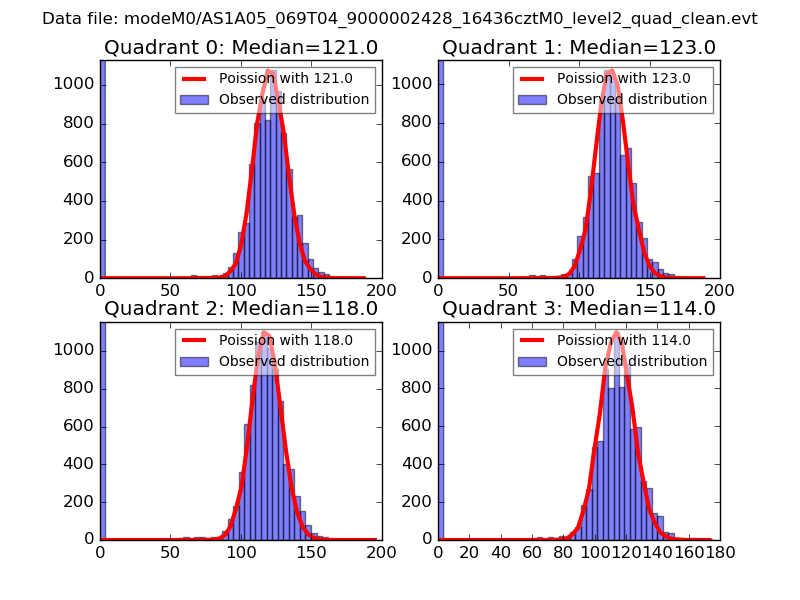 |
 |
| Quadrant-wise count rates Data is divided into 100 sec bins |
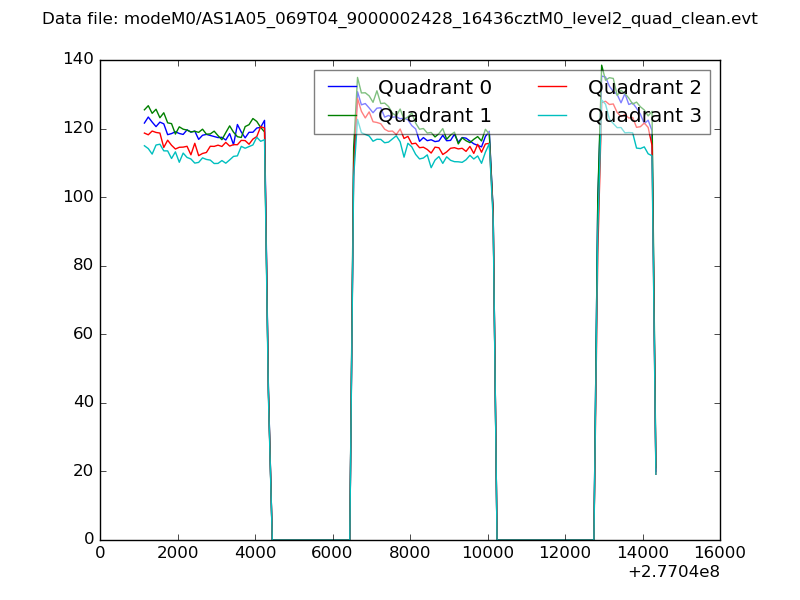 |
|
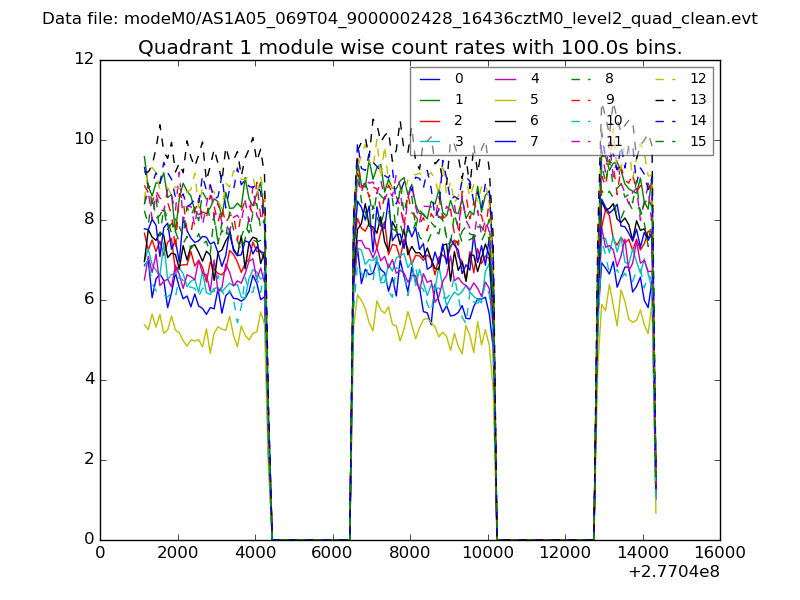
| Module-wise count rates for Quadrant A Data is divided into 100 sec bins |
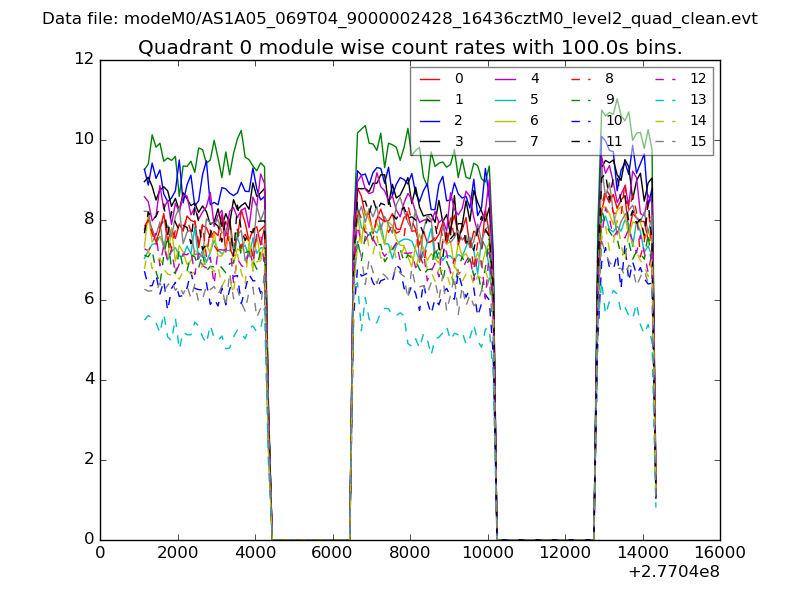 |
 |
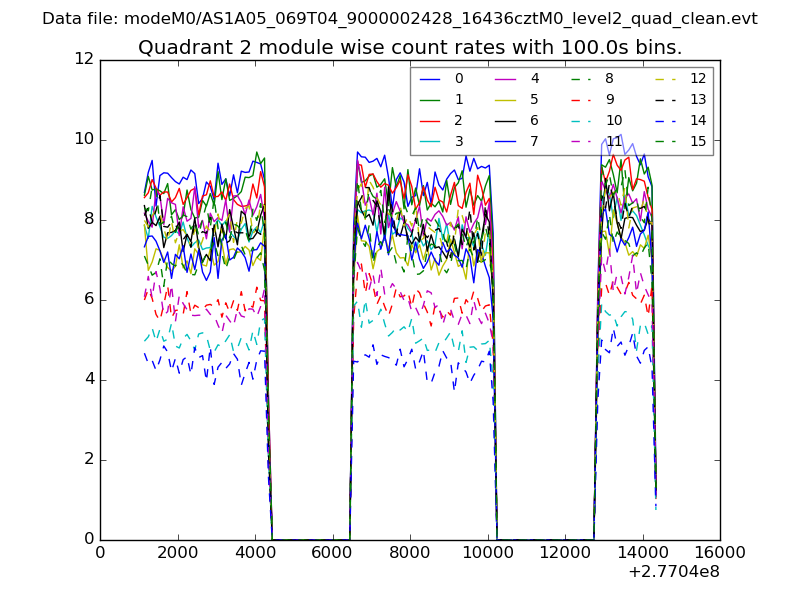
| Module-wise count rates for Quadrant B Data is divided into 100 sec bins |
 |
 |
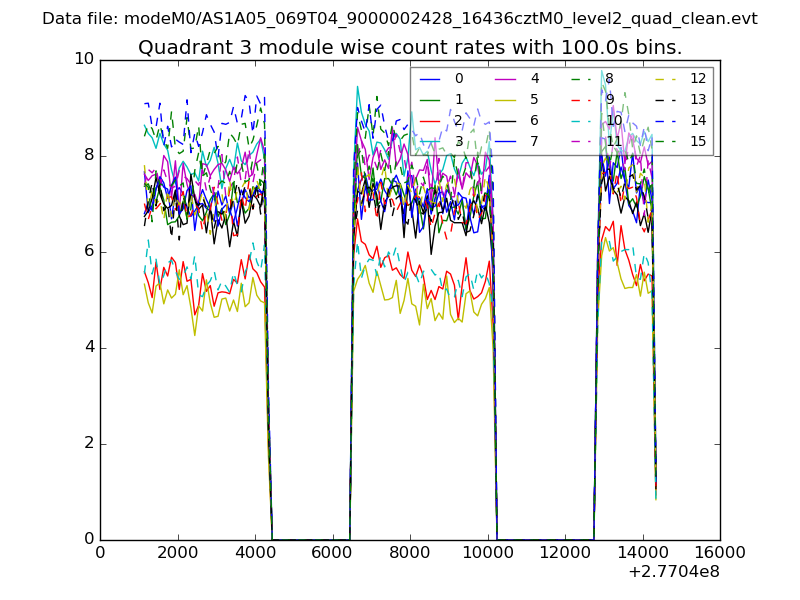
| Module-wise count rates for Quadrant C Data is divided into 100 sec bins |
 |
 |
| Module-wise count rates for Quadrant D Data is divided into 100 sec bins |
 |
 |
| Parameter | Plot |
|---|---|
| CZT HV Monitor | 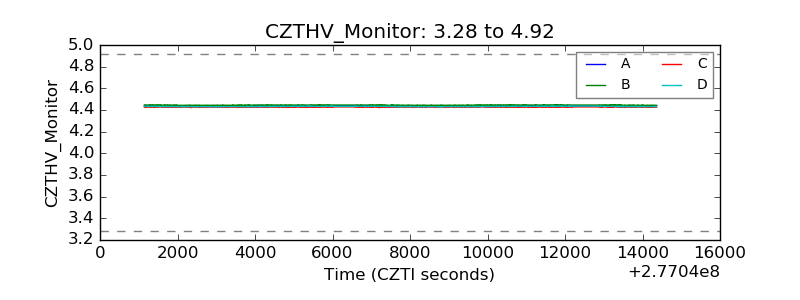 |
| D_VDD | 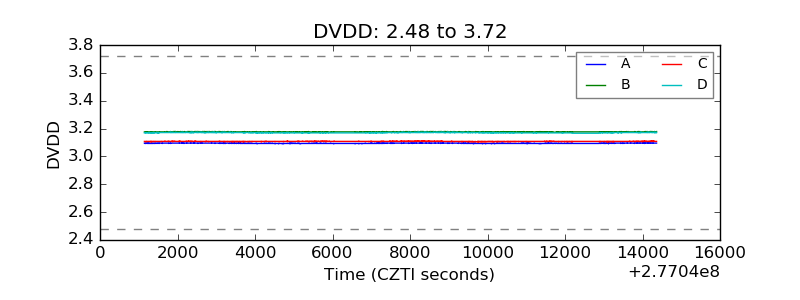 |
| Temperature 1 | 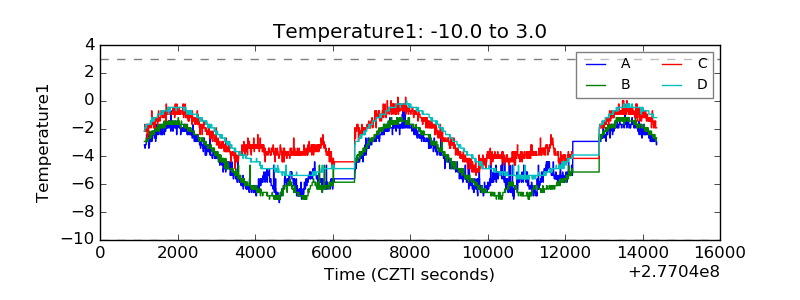 |
| Veto HV Monitor | 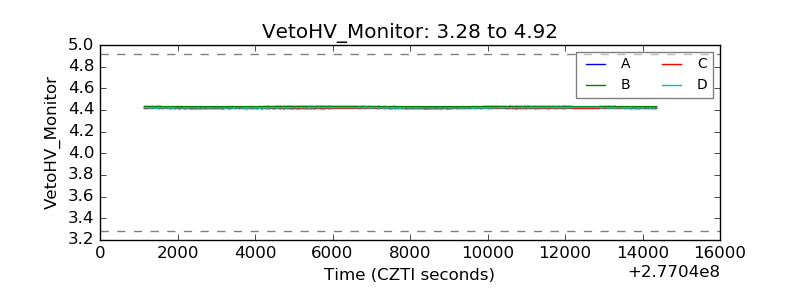 |
| Veto LLD | 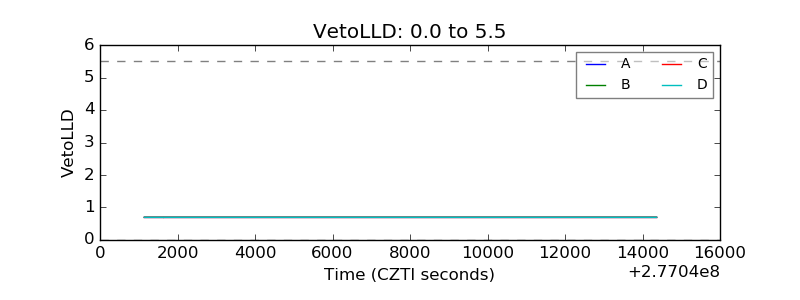 |
| Alpha Counter | 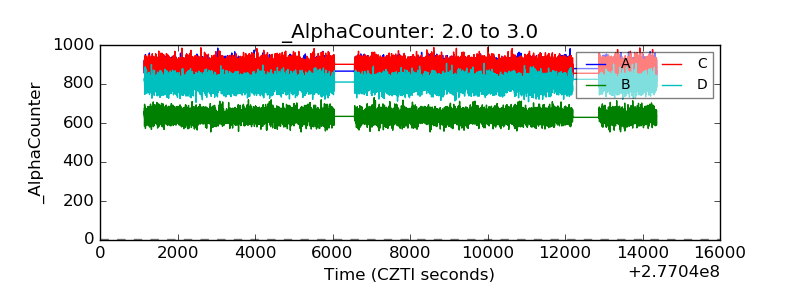 |
| _CPM_Rate | 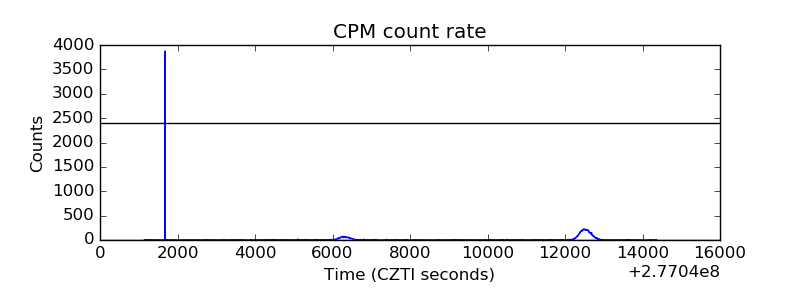 |
| CZT Counter | 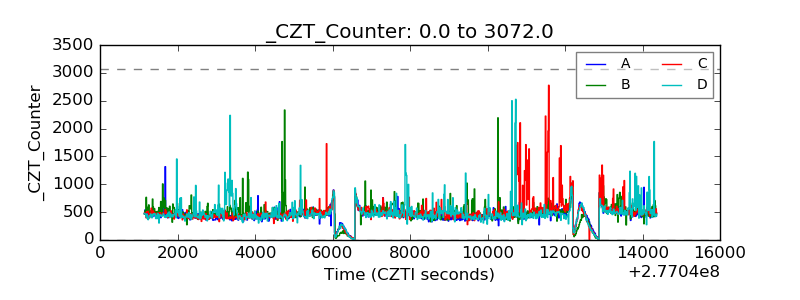 |
| +2.5 Volts monitor |  |
| +5 Volts monitor |  |
| _ROLL_ROT | 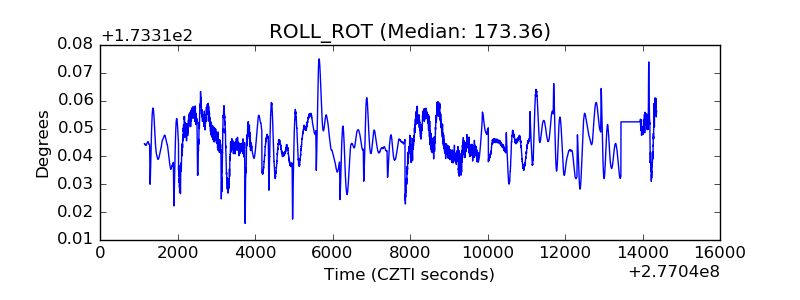 |
| _Roll_DEC | 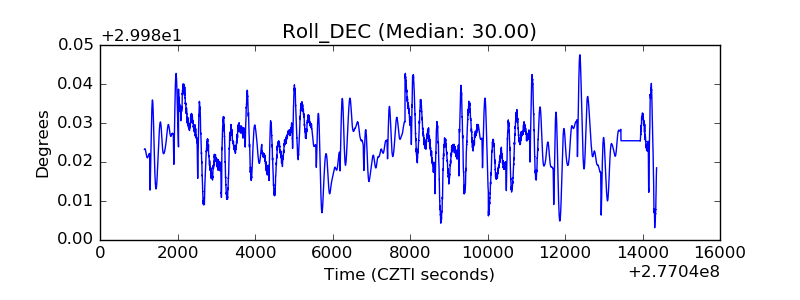 |
| _Roll_RA | 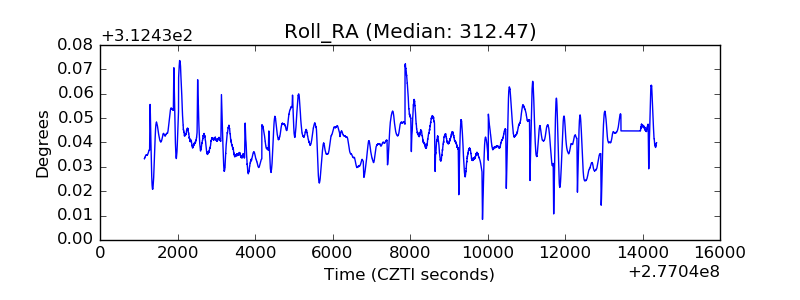 |
| Veto Counter | 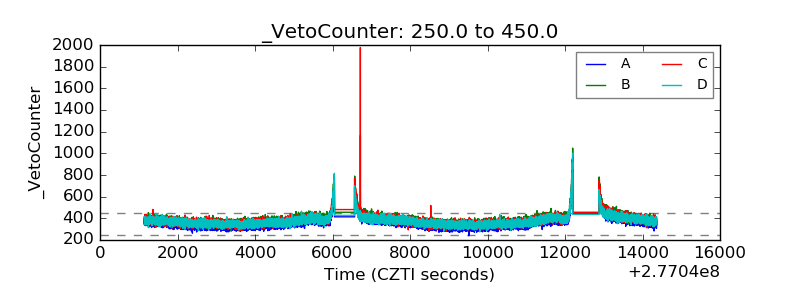 |