| Param | Original file | Final file |
|---|---|---|
| Filename | modeM0/AS1A05_069T04_9000002428_16440cztM0_level2.evt | modeM0/AS1A05_069T04_9000002428_16440cztM0_level2_quad_clean.evt |
| Size (bytes) | 580,530,240 | 89,340,480 |
| Size | 553.6 MB | 85.2 MB |
| Events in quadrant A | 4,269,547 | 535,192 |
| Events in quadrant B | 3,955,909 | 609,472 |
| Events in quadrant C | 4,615,240 | 565,363 |
| Events in quadrant D | 4,302,414 | 543,704 |
| Mode M0 | |||
|---|---|---|---|
| Quadrant | BADHDUFLAG | Total packets | Discarded packets |
| A | 0 | 16944 | 3 |
| B | 0 | 15984 | 2 |
| C | 0 | 18184 | 2 |
| D | 0 | 17296 | 2 |
| Mode SS | |||
|---|---|---|---|
| Quadrant | BADHDUFLAG | Total packets | Discarded packets |
| A | 0 | 132 | 0 |
| B | 0 | 132 | 0 |
| C | 0 | 132 | 0 |
| D | 0 | 132 | 0 |
| Mode M9 | |||
|---|---|---|---|
| Quadrant | BADHDUFLAG | Total packets | Discarded packets |
| A | 0 | 12 | 0 |
| B | 0 | 12 | 0 |
| C | 0 | 12 | 0 |
| D | 0 | 13 | 0 |
| Quadrant | Total seconds | Saturated seconds | Saturation percentage |
|---|---|---|---|
| A | 6469 | 546 | 8.440254% |
| B | 6469 | 167 | 2.581543% |
| C | 6469 | 232 | 3.586335% |
| D | 6469 | 211 | 3.261710% |
Noise dominated data is calculated using 1-second bins in cleaned event files. If a bin has >2000 counts, and if more than 50% of those come from <1% of pixels, then it is considered to be noise-dominated and hence unusable.
| Quadrant | # 1 sec bins | Bins with >0 counts | Bins with >2000 counts | High rate bins dominated by noise | Noise dominated (total time) | Noise dominated (detector-on time) | Marked lightcurve |
|---|---|---|---|---|---|---|---|
| A | 7634 | 6470 | 515 | 515 | 6.75% | 7.96% | 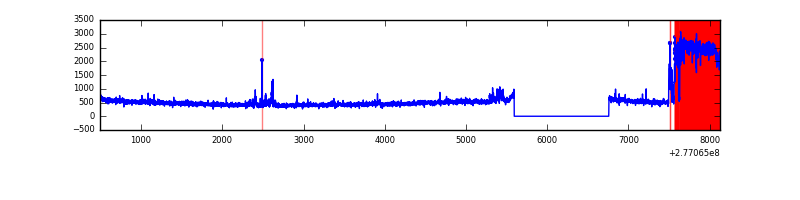 |
| B | 7635 | 6471 | 115 | 115 | 1.51% | 1.78% | 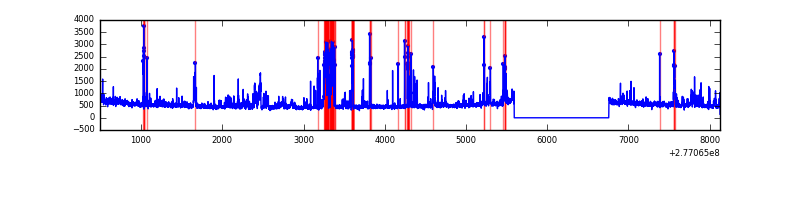 |
| C | 7635 | 6471 | 24 | 24 | 0.31% | 0.37% | 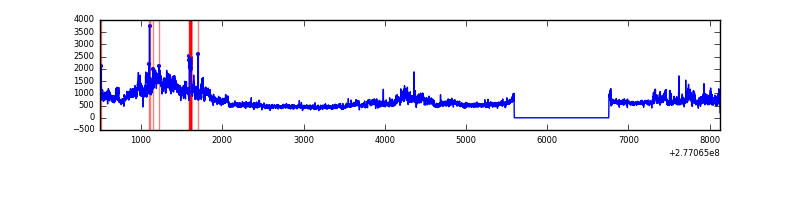 |
| D | 7635 | 6470 | 181 | 181 | 2.37% | 2.80% |  |
Top three noisy pixels from each quadrant. If the there are fewer than three noisy pixels in the level2.evt file, extra rows are filled as -1
| Pixel properties | Quadrant properties | ||||||
|---|---|---|---|---|---|---|---|
| Quadrant | DetID | PixID | Counts | Sigma | Mean | Median | Sigma |
| A | 15 | 174 | 1415662 | 9470.27 | 734 | 718 | 149.4 |
| A | 15 | 223 | 21529 | 139.29 | 734 | 718 | 149.4 |
| A | 0 | 226 | 6542 | 38.98 | 734 | 718 | 149.4 |
| B | 0 | 229 | 422451 | 2834.64 | 784 | 765 | 148.8 |
| B | 15 | 35 | 173922 | 1163.99 | 784 | 765 | 148.8 |
| B | 4 | 173 | 46769 | 309.25 | 784 | 765 | 148.8 |
| C | 3 | 233 | 1491460 | 8514.99 | 750 | 756 | 175.1 |
| C | 14 | 238 | 123354 | 700.29 | 750 | 756 | 175.1 |
| C | 7 | 247 | 43656 | 245.05 | 750 | 756 | 175.1 |
| D | 5 | 222 | 958227 | 5248.56 | 750 | 729 | 182.4 |
| D | 12 | 218 | 341149 | 1866.02 | 750 | 729 | 182.4 |
| D | 13 | 168 | 51164 | 276.46 | 750 | 729 | 182.4 |
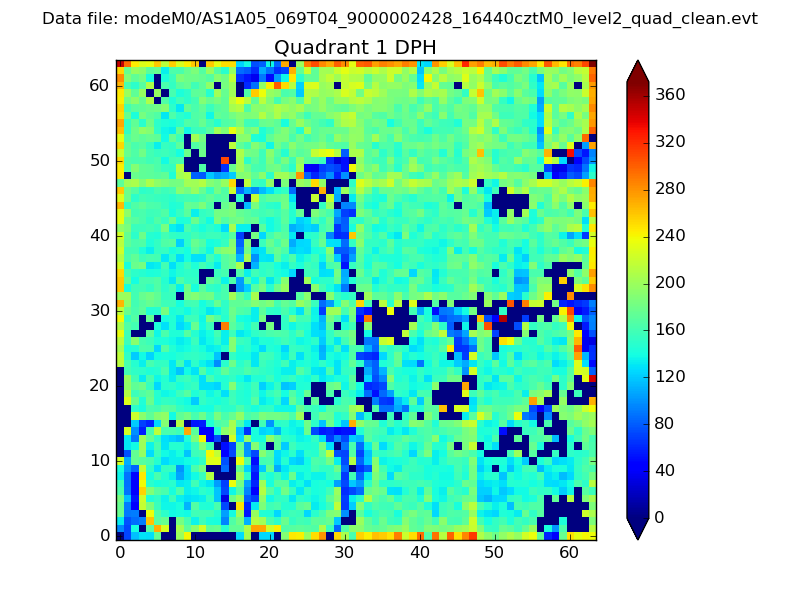
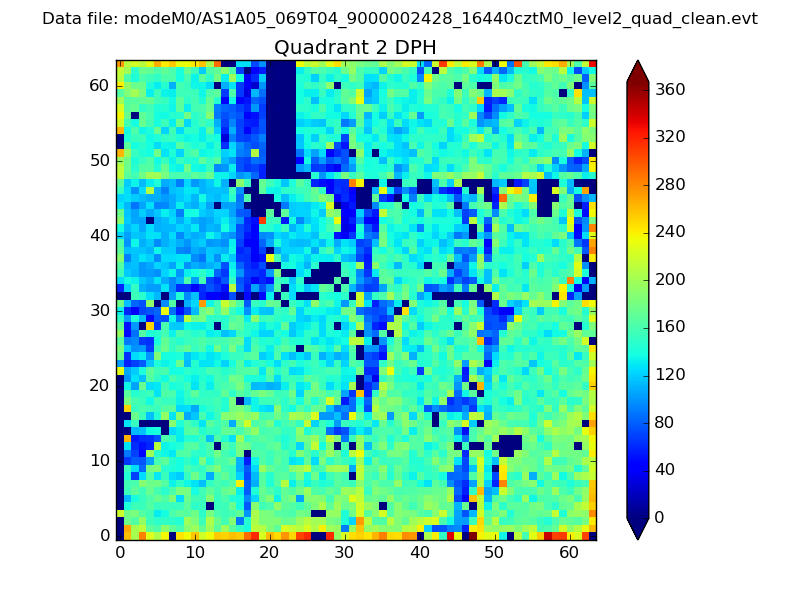
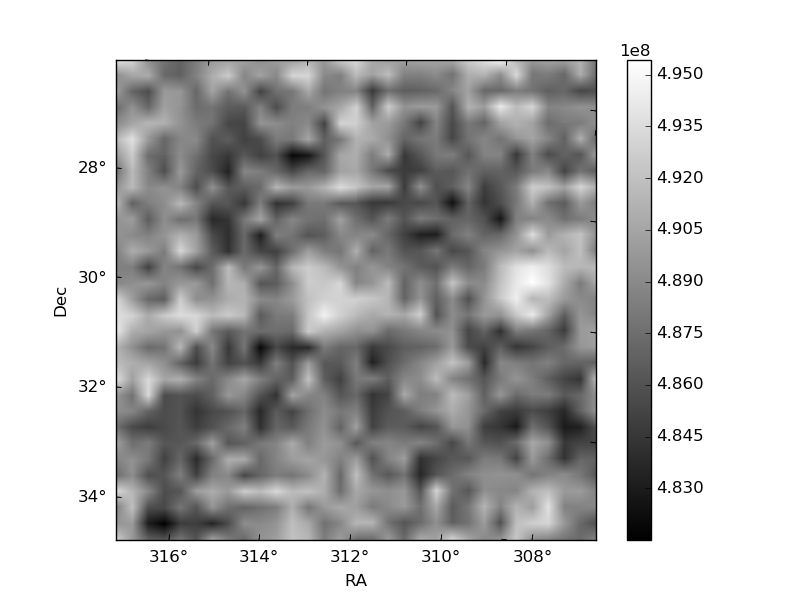
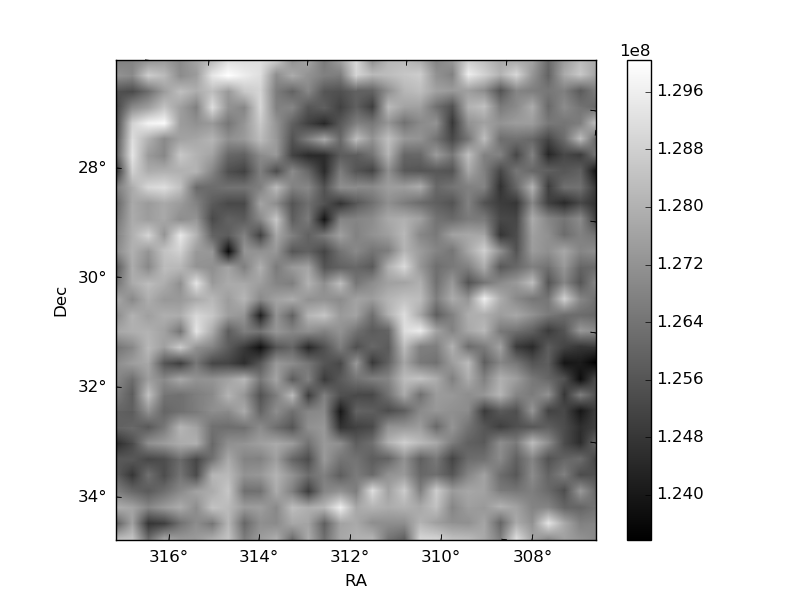
Histogram calculated using DETX and DETY for each event in the final _common_clean file
| Quadrant A | 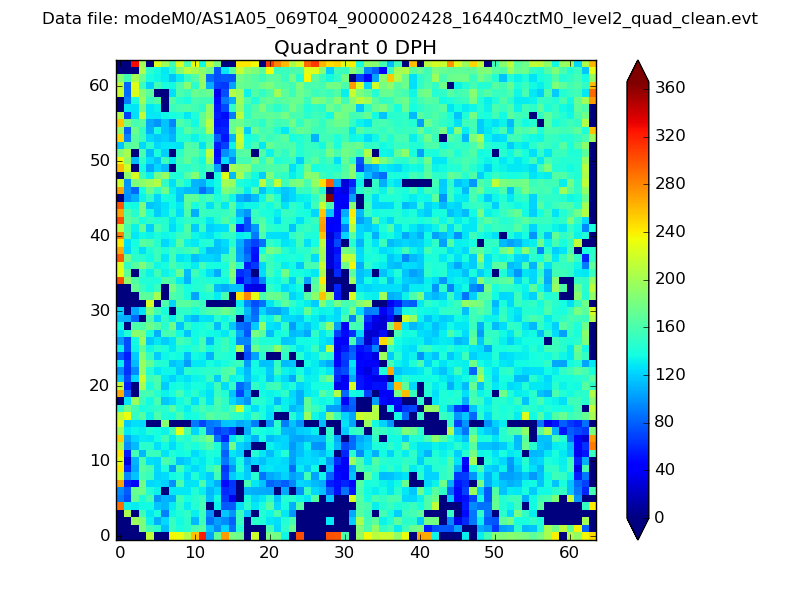 |
 |
Quadrant B |
|---|---|---|---|
| Quadrant D | 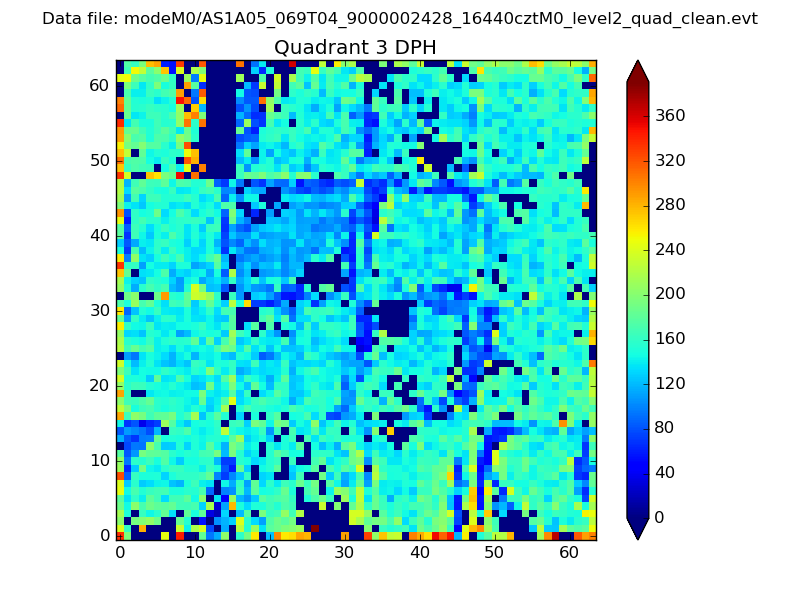 |
 |
Quadrant C |
| Plot type | Count rate plots | Images |
|---|---|---|
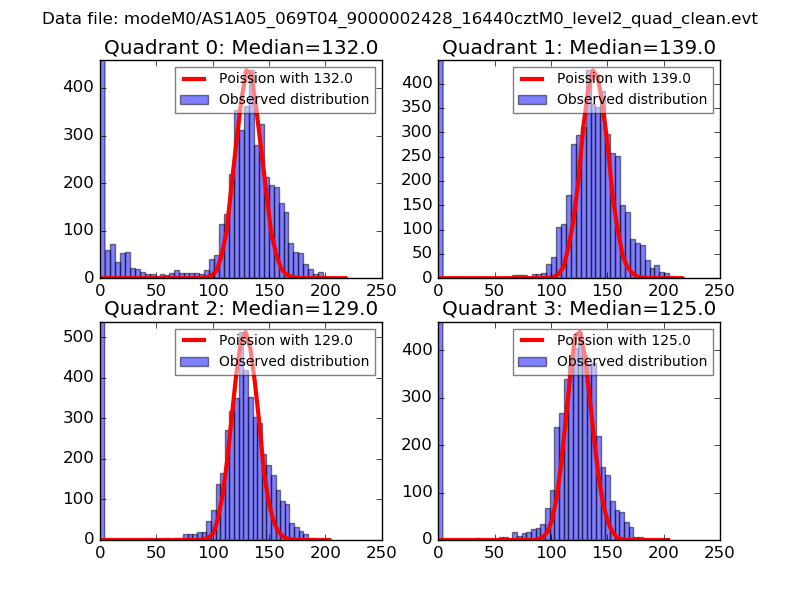
| Comparison with Poisson distribution Blue bars denote a histogram of data divided into 1 sec bins. Red curve is a Poisson curve with rate = median count rate of data. |
 |
 |
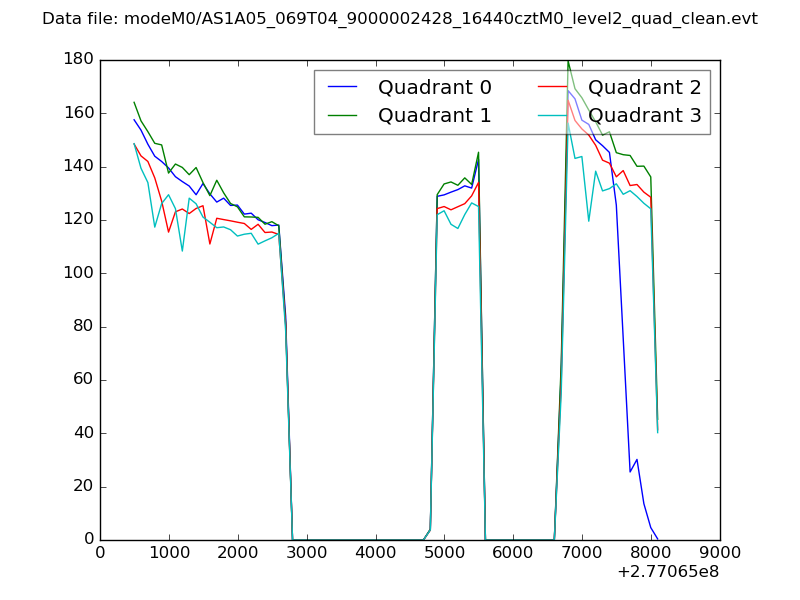
| Quadrant-wise count rates Data is divided into 100 sec bins |
 |
|
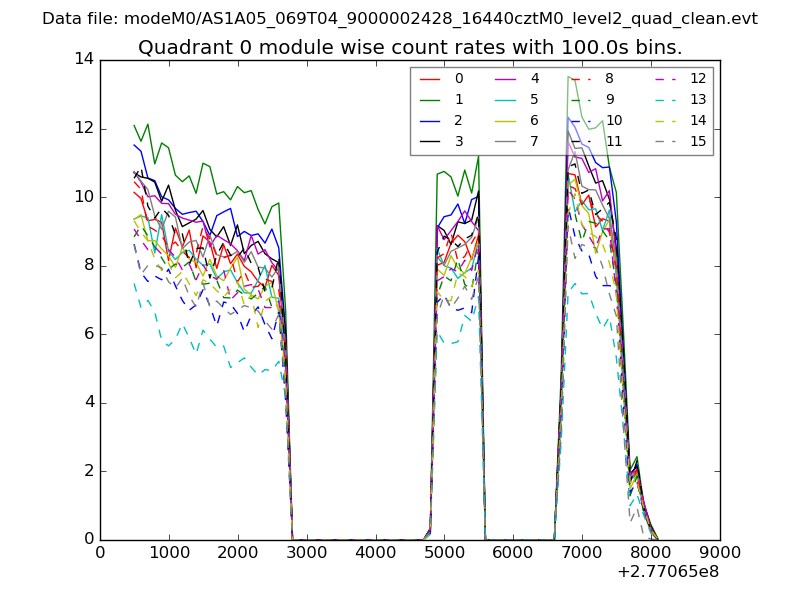
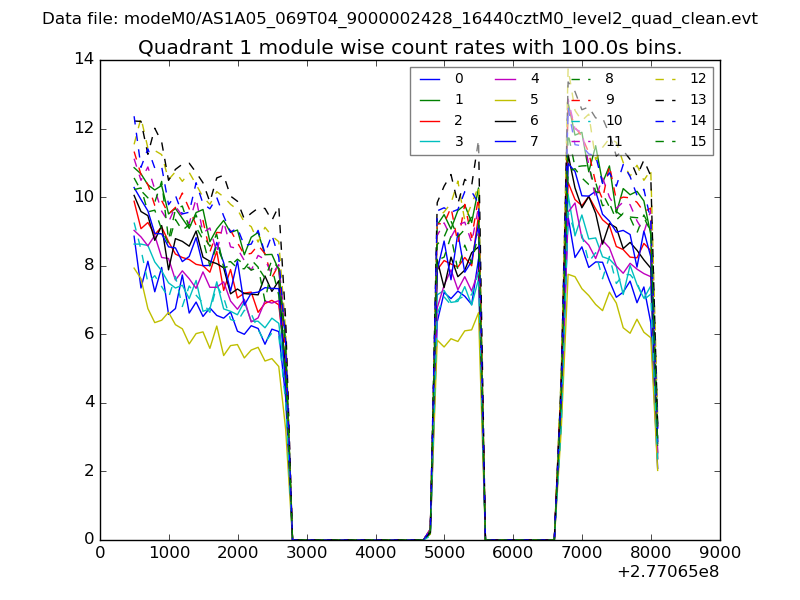
| Module-wise count rates for Quadrant A Data is divided into 100 sec bins |
 |
 |
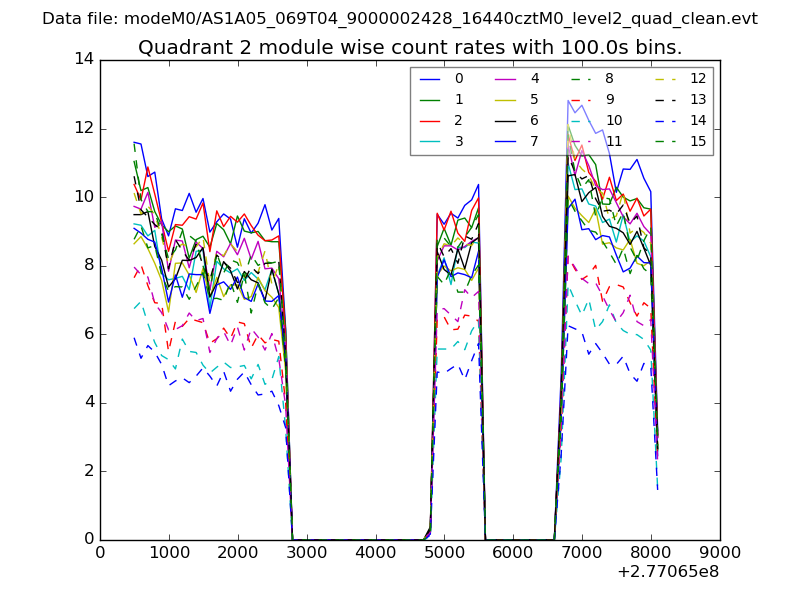
| Module-wise count rates for Quadrant B Data is divided into 100 sec bins |
 |
 |
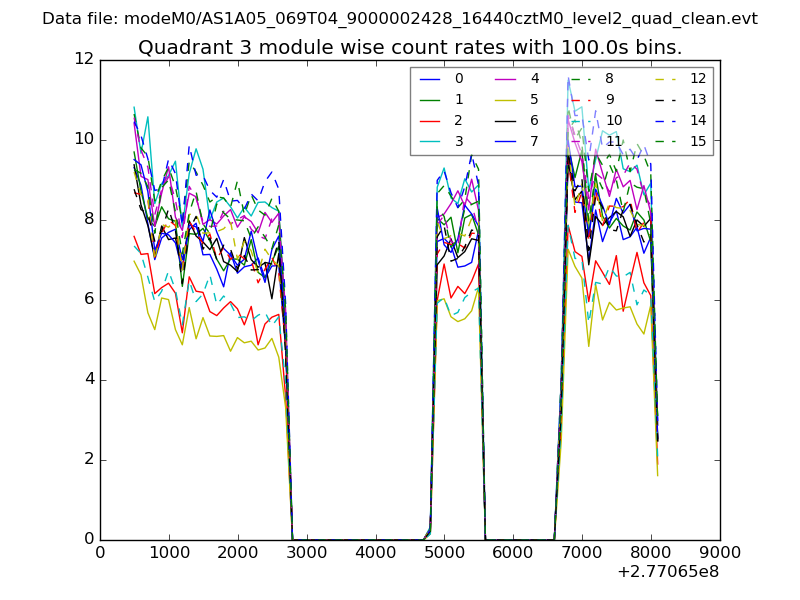
| Module-wise count rates for Quadrant C Data is divided into 100 sec bins |
 |
 |
| Module-wise count rates for Quadrant D Data is divided into 100 sec bins |
 |
 |
| Parameter | Plot |
|---|---|
| CZT HV Monitor |  |
| D_VDD |  |
| Temperature 1 | 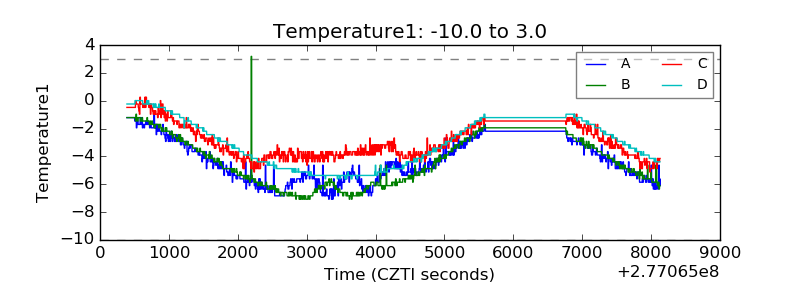 |
| Veto HV Monitor | 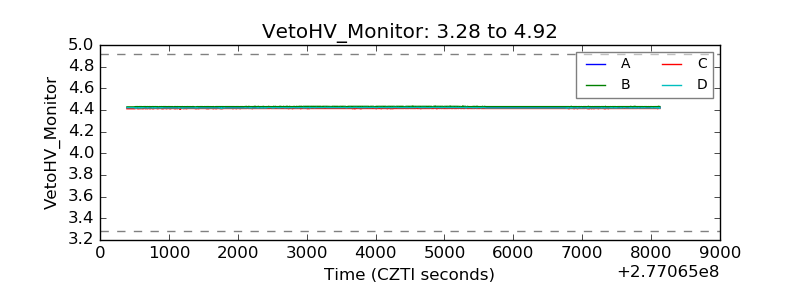 |
| Veto LLD | 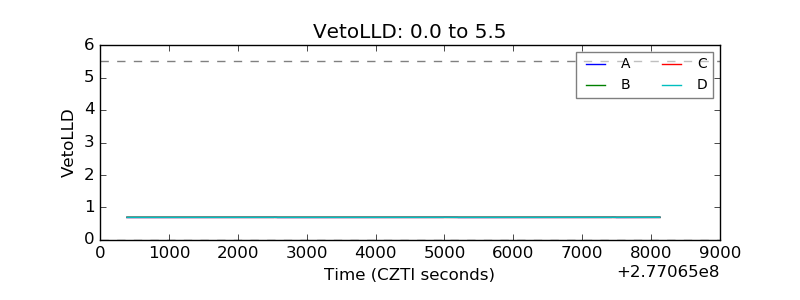 |
| Alpha Counter | 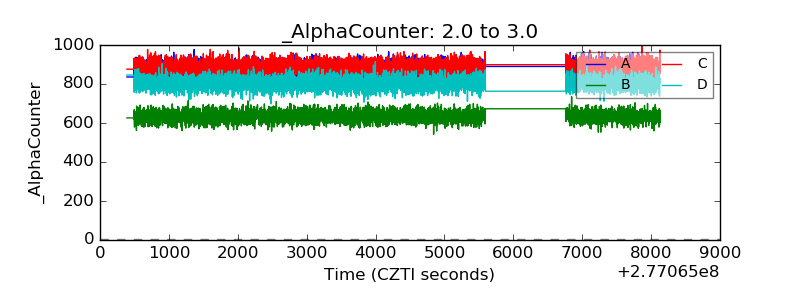 |
| _CPM_Rate | 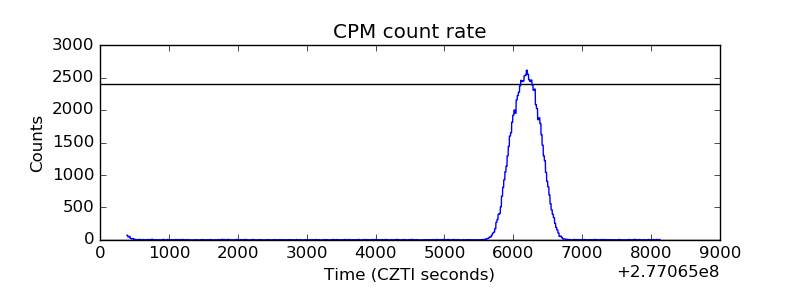 |
| CZT Counter | 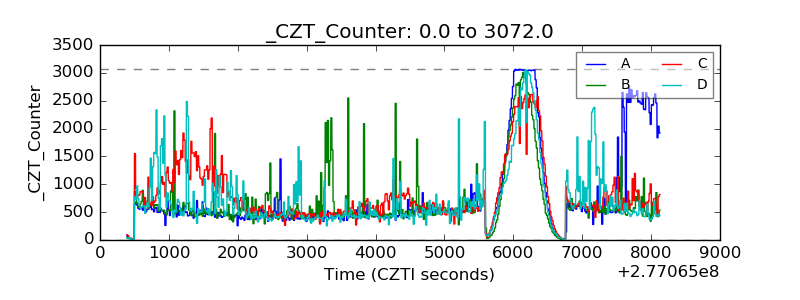 |
| +2.5 Volts monitor |  |
| +5 Volts monitor |  |
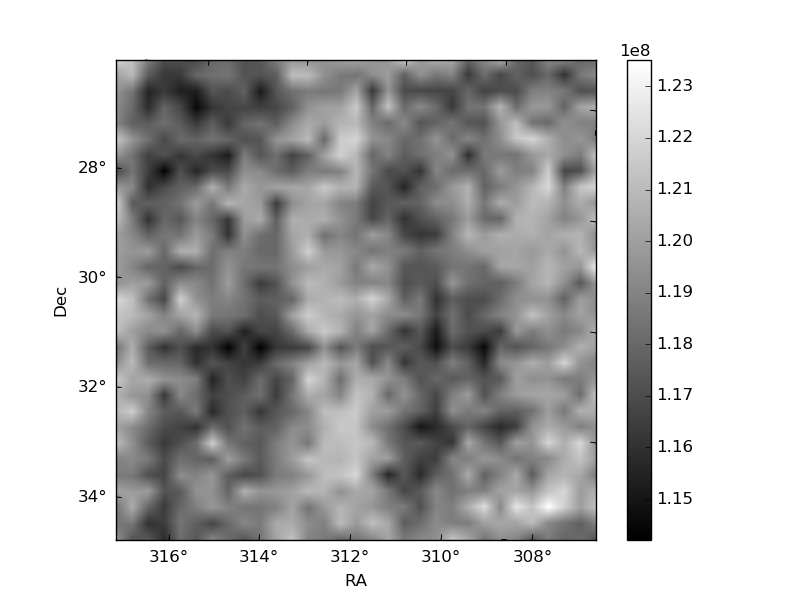
| _ROLL_ROT |  |
| _Roll_DEC | 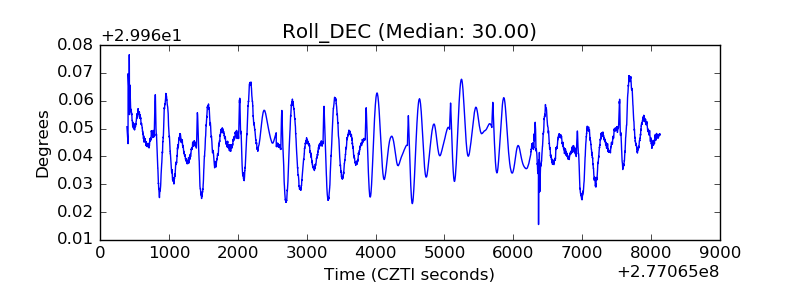 |
| _Roll_RA | 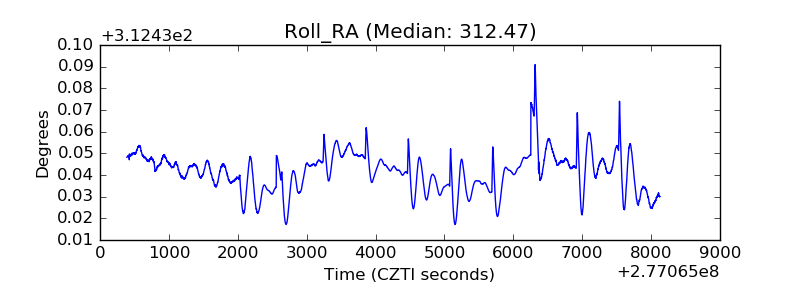 |
| Veto Counter | 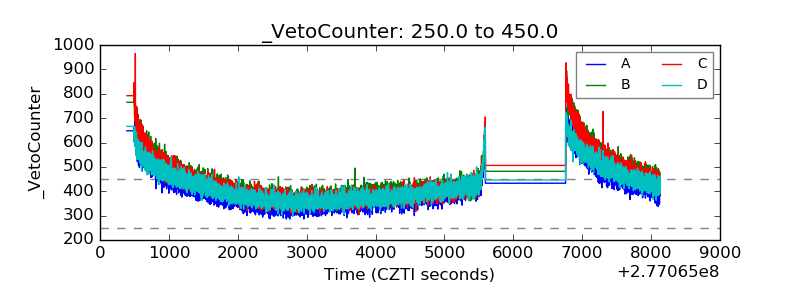 |