| Param | Original file | Final file |
|---|---|---|
| Filename | modeM0/AS1A05_069T04_9000002428_16441cztM0_level2.evt | modeM0/AS1A05_069T04_9000002428_16441cztM0_level2_quad_clean.evt |
| Size (bytes) | 836,930,880 | 82,370,880 |
| Size | 798.2 MB | 78.6 MB |
| Events in quadrant A | 12,511,360 | 339,073 |
| Events in quadrant B | 3,665,572 | 608,445 |
| Events in quadrant C | 5,181,348 | 565,403 |
| Events in quadrant D | 3,568,479 | 546,344 |
| Mode M0 | |||
|---|---|---|---|
| Quadrant | BADHDUFLAG | Total packets | Discarded packets |
| A | 0 | 41327 | 3 |
| B | 0 | 14972 | 2 |
| C | 0 | 19985 | 2 |
| D | 0 | 14825 | 2 |
| Mode SS | |||
|---|---|---|---|
| Quadrant | BADHDUFLAG | Total packets | Discarded packets |
| A | 0 | 126 | 0 |
| B | 0 | 126 | 0 |
| C | 0 | 126 | 0 |
| D | 0 | 126 | 0 |
| Mode M9 | |||
|---|---|---|---|
| Quadrant | BADHDUFLAG | Total packets | Discarded packets |
| A | 0 | 14 | 0 |
| B | 0 | 14 | 0 |
| C | 0 | 14 | 0 |
| D | 0 | 15 | 0 |
| Quadrant | Total seconds | Saturated seconds | Saturation percentage |
|---|---|---|---|
| A | 6216 | 4491 | 72.249035% |
| B | 6216 | 99 | 1.592664% |
| C | 6216 | 361 | 5.807593% |
| D | 6216 | 117 | 1.882239% |
Noise dominated data is calculated using 1-second bins in cleaned event files. If a bin has >2000 counts, and if more than 50% of those come from <1% of pixels, then it is considered to be noise-dominated and hence unusable.
| Quadrant | # 1 sec bins | Bins with >0 counts | Bins with >2000 counts | High rate bins dominated by noise | Noise dominated (total time) | Noise dominated (detector-on time) | Marked lightcurve |
|---|---|---|---|---|---|---|---|
| A | 7456 | 6216 | 4292 | 4292 | 57.56% | 69.05% | 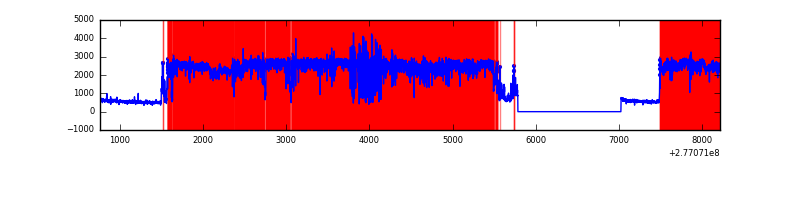 |
| B | 7457 | 6217 | 34 | 34 | 0.46% | 0.55% | 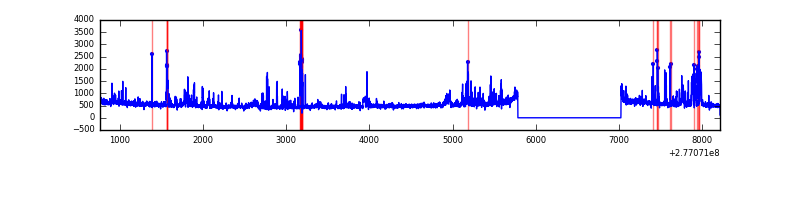 |
| C | 7457 | 6217 | 52 | 52 | 0.70% | 0.84% | 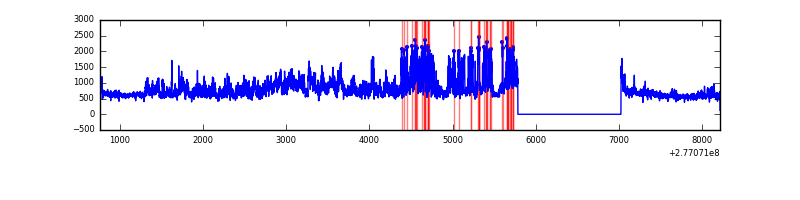 |
| D | 7457 | 6218 | 82 | 82 | 1.10% | 1.32% | 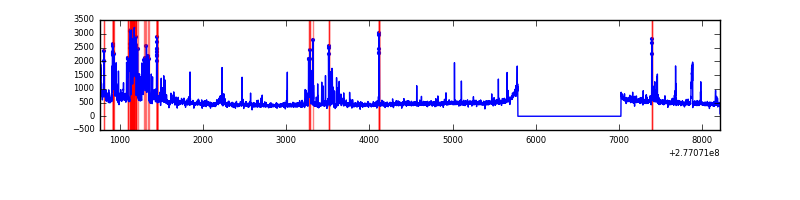 |
Top three noisy pixels from each quadrant. If the there are fewer than three noisy pixels in the level2.evt file, extra rows are filled as -1
| Pixel properties | Quadrant properties | ||||||
|---|---|---|---|---|---|---|---|
| Quadrant | DetID | PixID | Counts | Sigma | Mean | Median | Sigma |
| A | 15 | 174 | 10769004 | 119533.02 | 448 | 438 | 90.1 |
| A | 15 | 223 | 10901 | 116.14 | 448 | 438 | 90.1 |
| A | 3 | 1 | 4903 | 49.56 | 448 | 438 | 90.1 |
| B | 15 | 35 | 281290 | 1920.5 | 780 | 761 | 146.1 |
| B | 0 | 229 | 80414 | 545.31 | 780 | 761 | 146.1 |
| B | 4 | 173 | 79284 | 537.57 | 780 | 761 | 146.1 |
| C | 3 | 233 | 2131609 | 12331.54 | 739 | 744 | 172.8 |
| C | 14 | 238 | 114118 | 656.11 | 739 | 744 | 172.8 |
| C | 4 | 254 | 29865 | 168.53 | 739 | 744 | 172.8 |
| D | 5 | 222 | 610565 | 3347.97 | 747 | 725 | 182.2 |
| D | 13 | 168 | 42468 | 229.17 | 747 | 725 | 182.2 |
| D | 1 | 52 | 40702 | 219.47 | 747 | 725 | 182.2 |
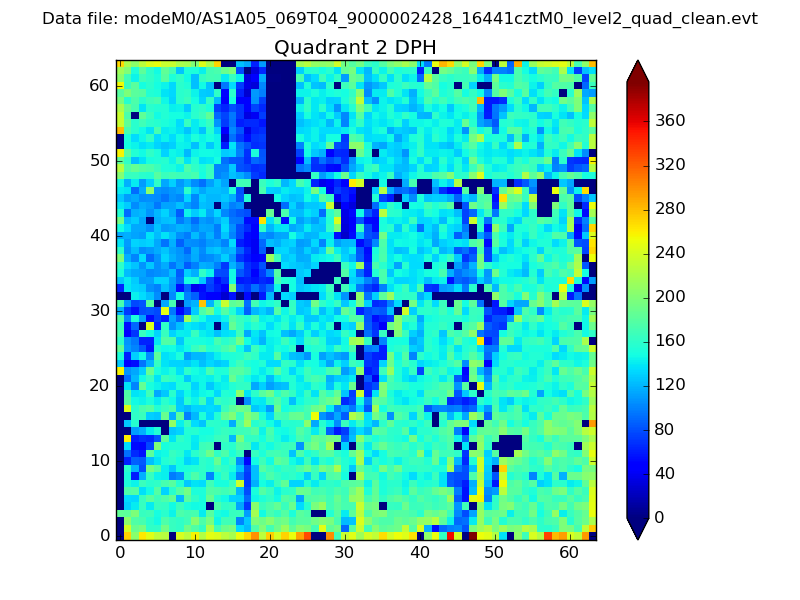
Histogram calculated using DETX and DETY for each event in the final _common_clean file
| Quadrant A | 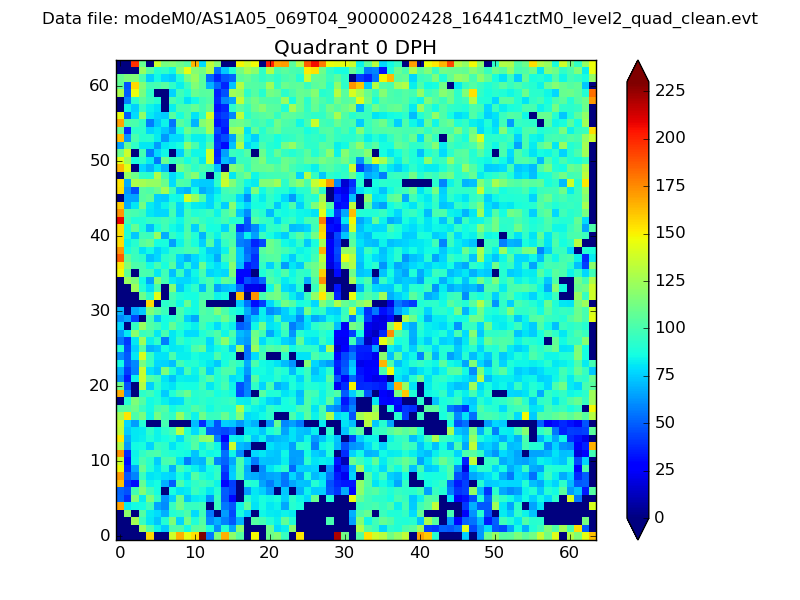 |
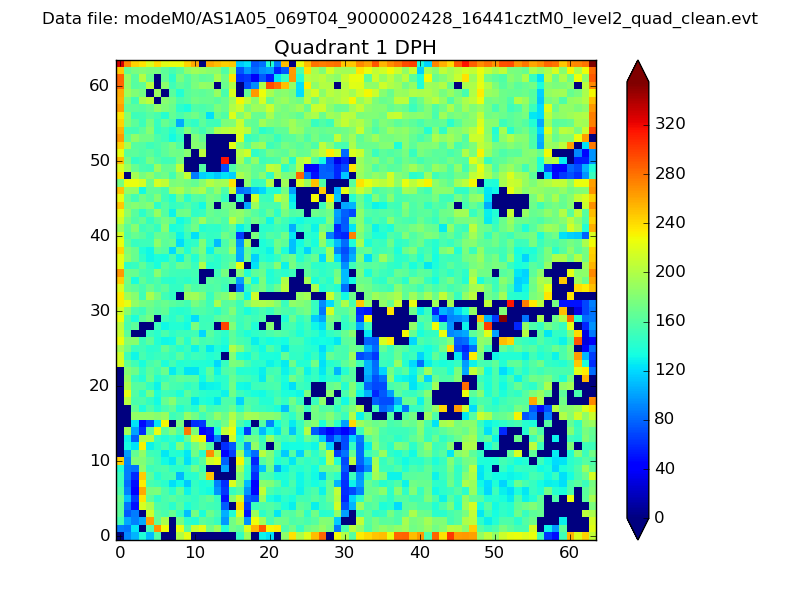 |
Quadrant B |
|---|---|---|---|
| Quadrant D | 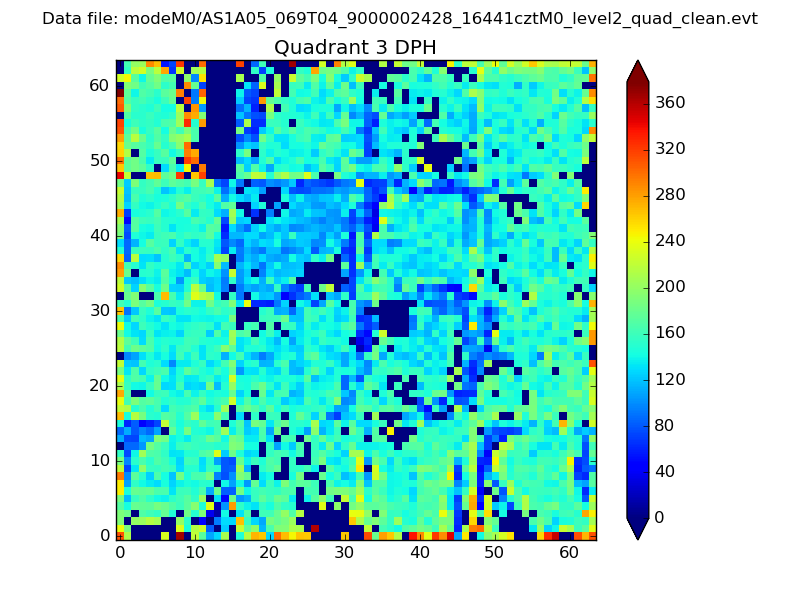 |
 |
Quadrant C |
| Plot type | Count rate plots | Images |
|---|---|---|
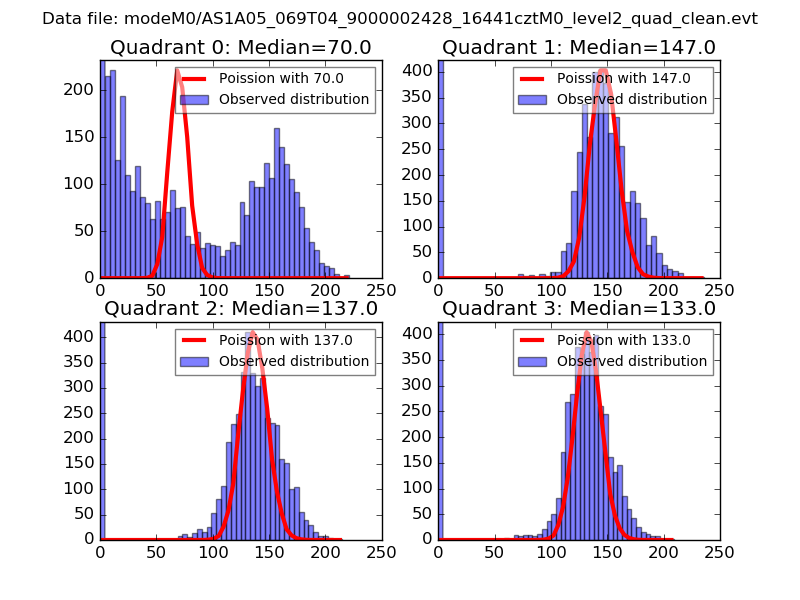
| Comparison with Poisson distribution Blue bars denote a histogram of data divided into 1 sec bins. Red curve is a Poisson curve with rate = median count rate of data. |
 |
 |
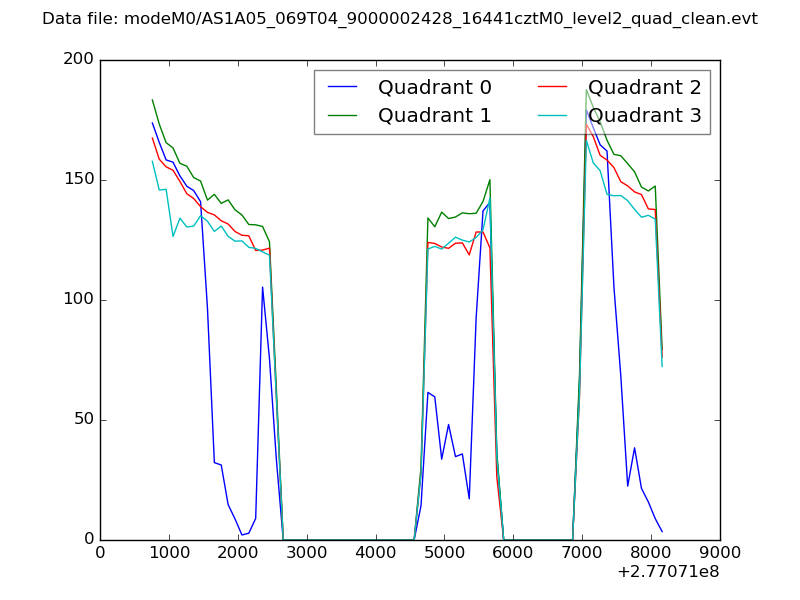
| Quadrant-wise count rates Data is divided into 100 sec bins |
 |
|
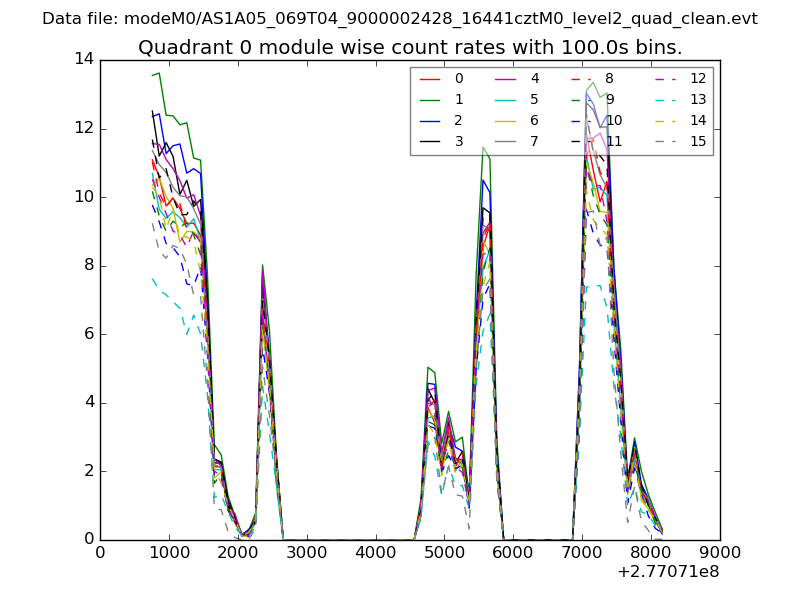
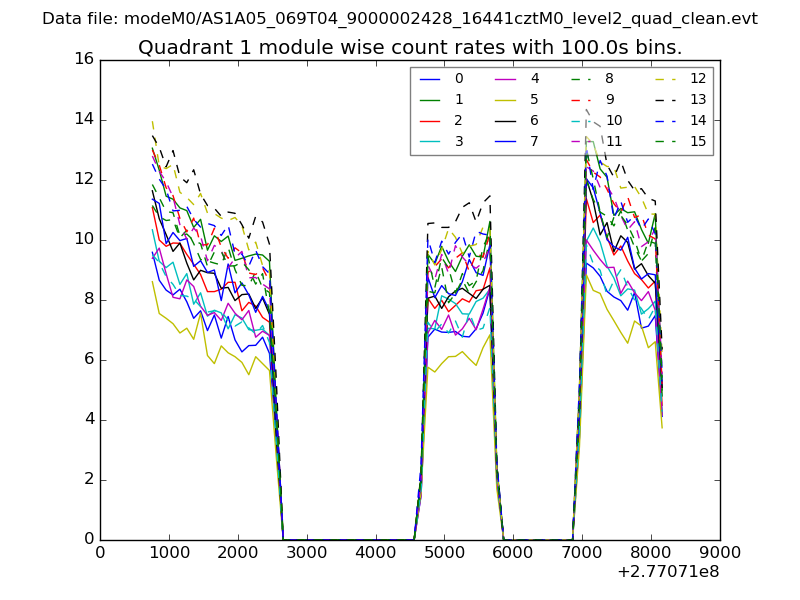
| Module-wise count rates for Quadrant A Data is divided into 100 sec bins |
 |
 |
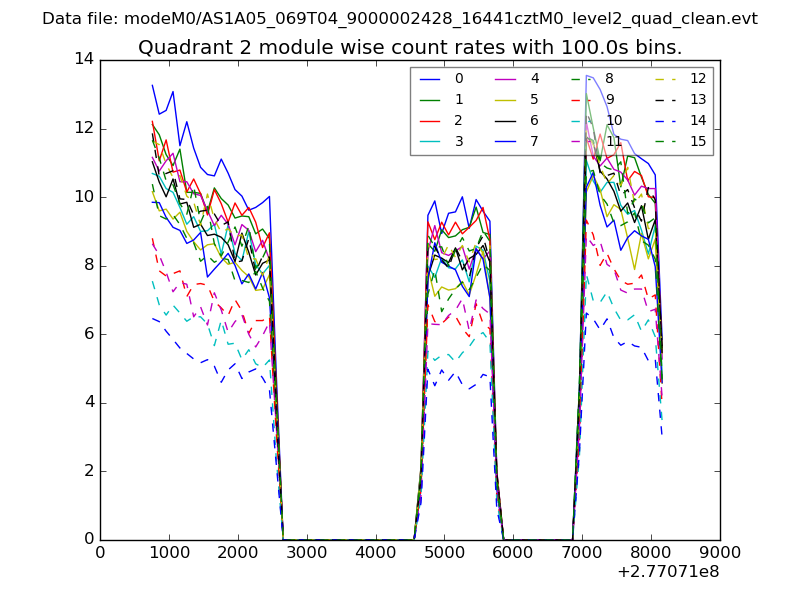
| Module-wise count rates for Quadrant B Data is divided into 100 sec bins |
 |
 |
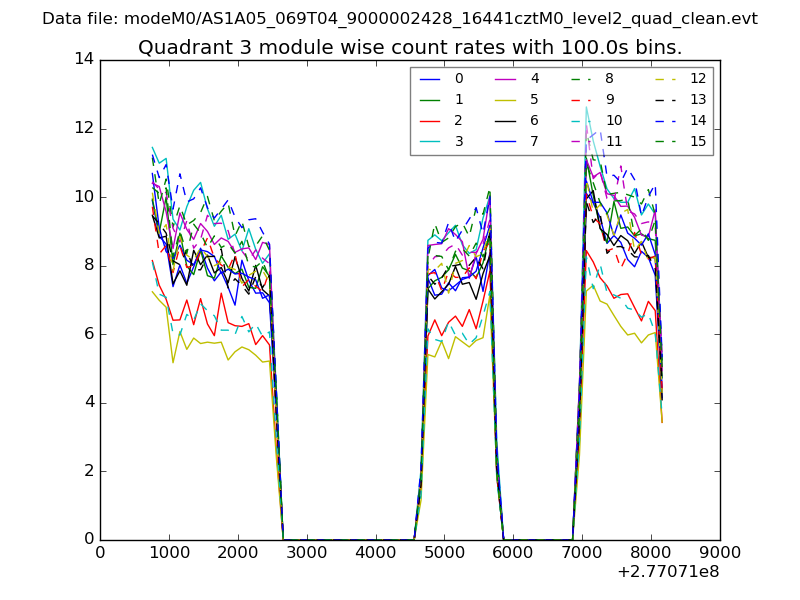
| Module-wise count rates for Quadrant C Data is divided into 100 sec bins |
 |
 |
| Module-wise count rates for Quadrant D Data is divided into 100 sec bins |
 |
 |
| Parameter | Plot |
|---|---|
| CZT HV Monitor | 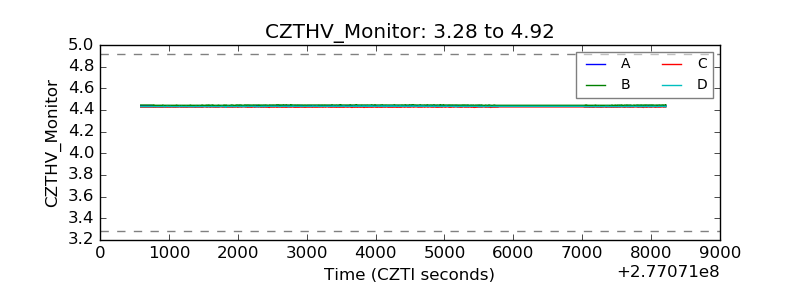 |
| D_VDD | 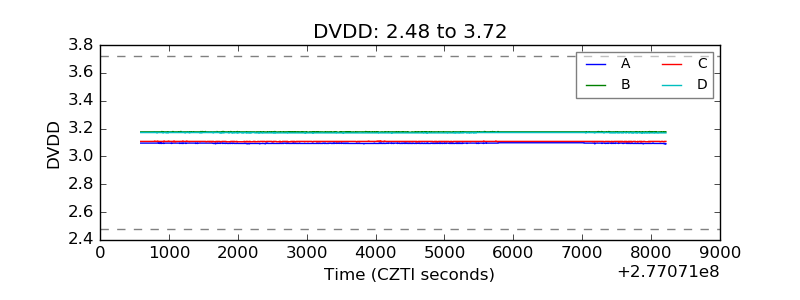 |
| Temperature 1 | 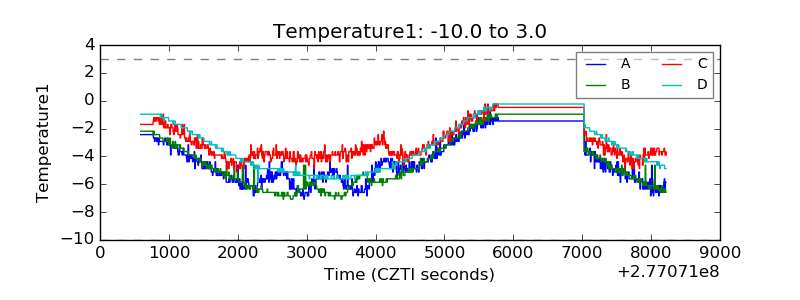 |
| Veto HV Monitor | 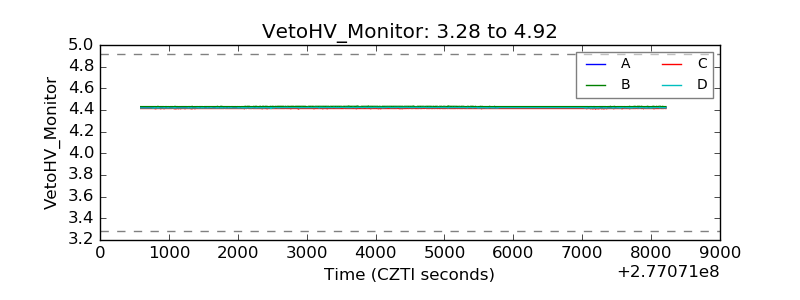 |
| Veto LLD | 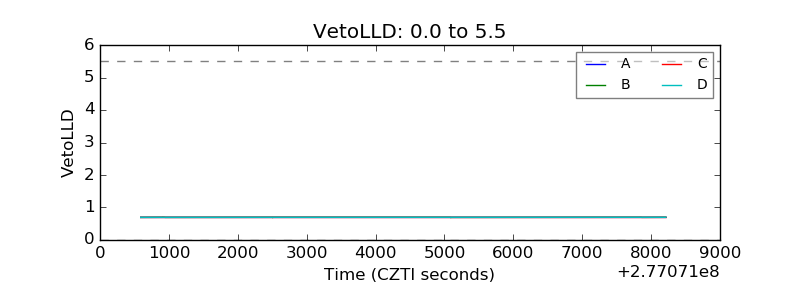 |
| Alpha Counter | 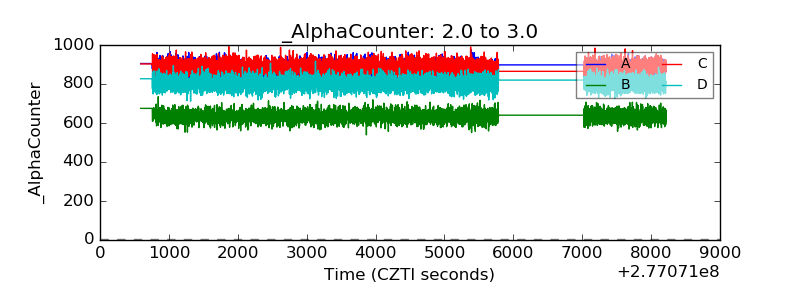 |
| _CPM_Rate | 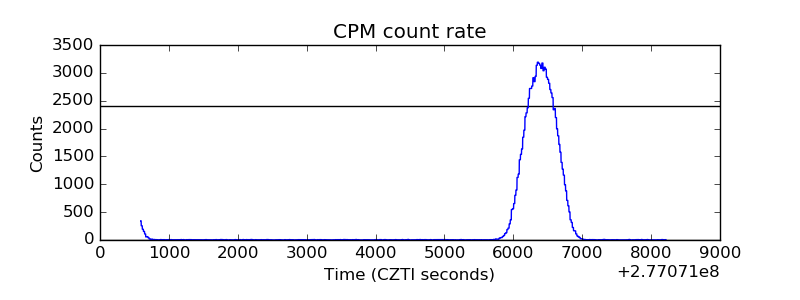 |
| CZT Counter | 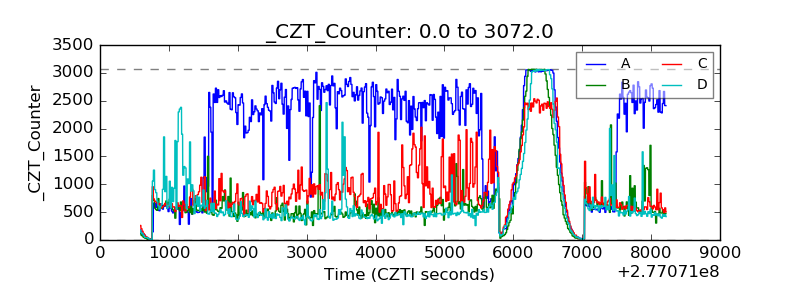 |
| +2.5 Volts monitor |  |
| +5 Volts monitor |  |
| _ROLL_ROT | 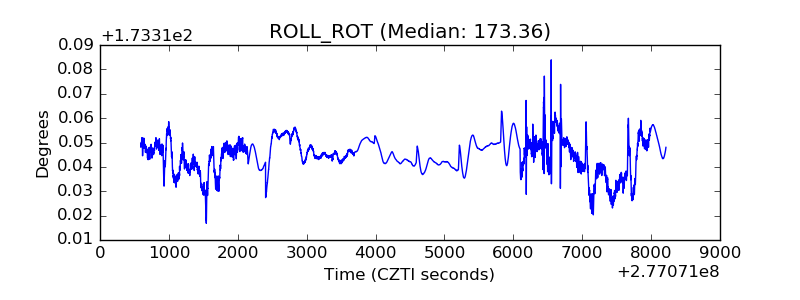 |
| _Roll_DEC | 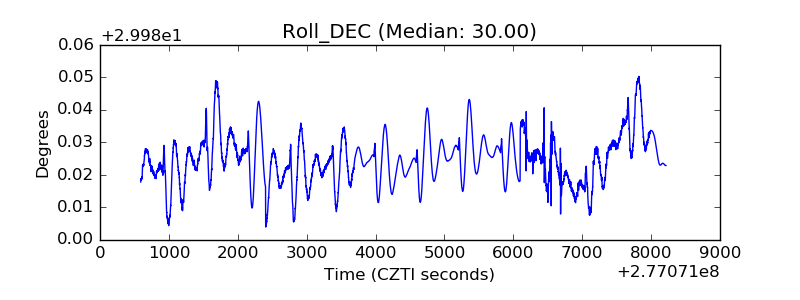 |
| _Roll_RA | 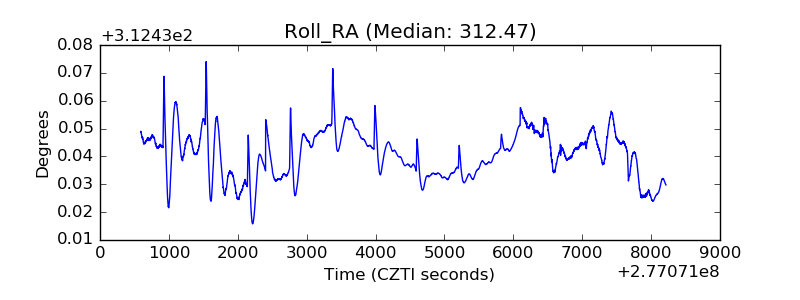 |
| Veto Counter | 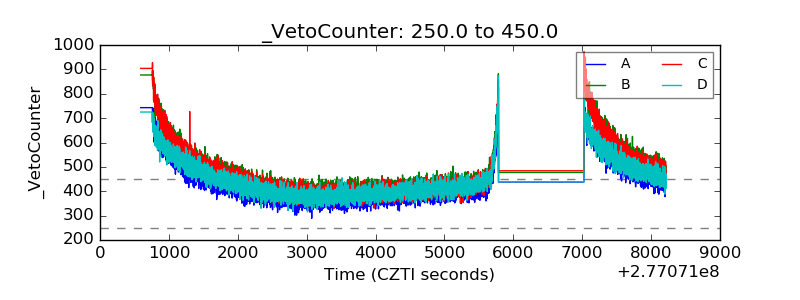 |