| Param | Original file | Final file |
|---|---|---|
| Filename | modeM0/AS1A05_069T04_9000002428_16442cztM0_level2.evt | modeM0/AS1A05_069T04_9000002428_16442cztM0_level2_quad_clean.evt |
| Size (bytes) | 731,761,920 | 81,711,360 |
| Size | 697.9 MB | 77.9 MB |
| Events in quadrant A | 11,200,770 | 372,700 |
| Events in quadrant B | 3,628,550 | 591,468 |
| Events in quadrant C | 3,794,229 | 551,289 |
| Events in quadrant D | 3,124,904 | 532,112 |
| Mode M0 | |||
|---|---|---|---|
| Quadrant | BADHDUFLAG | Total packets | Discarded packets |
| A | 0 | 37357 | 3 |
| B | 0 | 14687 | 2 |
| C | 0 | 15326 | 2 |
| D | 0 | 13405 | 2 |
| Mode SS | |||
|---|---|---|---|
| Quadrant | BADHDUFLAG | Total packets | Discarded packets |
| A | 0 | 124 | 0 |
| B | 0 | 124 | 0 |
| C | 0 | 124 | 0 |
| D | 0 | 124 | 0 |
| Mode M9 | |||
|---|---|---|---|
| Quadrant | BADHDUFLAG | Total packets | Discarded packets |
| A | 0 | 15 | 0 |
| B | 0 | 15 | 0 |
| C | 0 | 15 | 0 |
| D | 0 | 16 | 0 |
| Quadrant | Total seconds | Saturated seconds | Saturation percentage |
|---|---|---|---|
| A | 6099 | 4001 | 65.600918% |
| B | 6099 | 60 | 0.983768% |
| C | 6099 | 109 | 1.787178% |
| D | 6099 | 22 | 0.360715% |
Noise dominated data is calculated using 1-second bins in cleaned event files. If a bin has >2000 counts, and if more than 50% of those come from <1% of pixels, then it is considered to be noise-dominated and hence unusable.
| Quadrant | # 1 sec bins | Bins with >0 counts | Bins with >2000 counts | High rate bins dominated by noise | Noise dominated (total time) | Noise dominated (detector-on time) | Marked lightcurve |
|---|---|---|---|---|---|---|---|
| A | 7425 | 6101 | 3762 | 3762 | 50.67% | 61.66% |  |
| B | 7425 | 6101 | 19 | 19 | 0.26% | 0.31% | 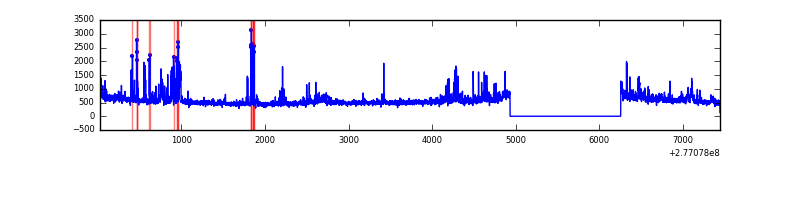 |
| C | 7425 | 6101 | 2 | 2 | 0.03% | 0.03% | 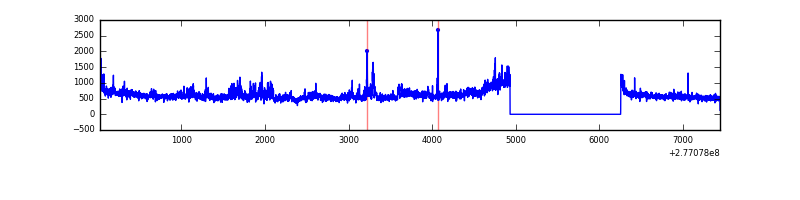 |
| D | 7425 | 6101 | 8 | 8 | 0.11% | 0.13% | 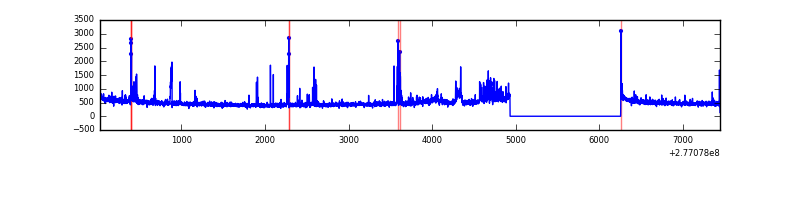 |
Top three noisy pixels from each quadrant. If the there are fewer than three noisy pixels in the level2.evt file, extra rows are filled as -1
| Pixel properties | Quadrant properties | ||||||
|---|---|---|---|---|---|---|---|
| Quadrant | DetID | PixID | Counts | Sigma | Mean | Median | Sigma |
| A | 15 | 174 | 9619218 | 116913.45 | 411 | 404 | 82.3 |
| A | 0 | 226 | 3699 | 40.05 | 411 | 404 | 82.3 |
| A | 12 | 194 | 3054 | 32.21 | 411 | 404 | 82.3 |
| B | 15 | 35 | 210381 | 1423.96 | 783 | 765 | 147.2 |
| B | 3 | 64 | 66764 | 448.34 | 783 | 765 | 147.2 |
| B | 0 | 198 | 62513 | 419.47 | 783 | 765 | 147.2 |
| C | 3 | 233 | 732624 | 4220.6 | 745 | 752 | 173.4 |
| C | 14 | 238 | 117248 | 671.82 | 745 | 752 | 173.4 |
| C | 4 | 254 | 25139 | 140.64 | 745 | 752 | 173.4 |
| D | 5 | 222 | 143620 | 792.03 | 744 | 722 | 180.4 |
| D | 12 | 218 | 96825 | 532.66 | 744 | 722 | 180.4 |
| D | 10 | 70 | 31782 | 172.15 | 744 | 722 | 180.4 |
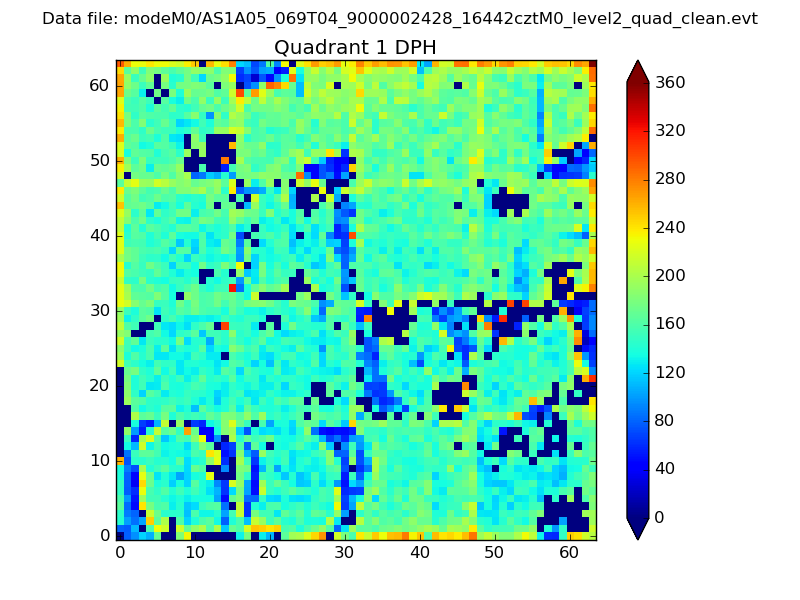
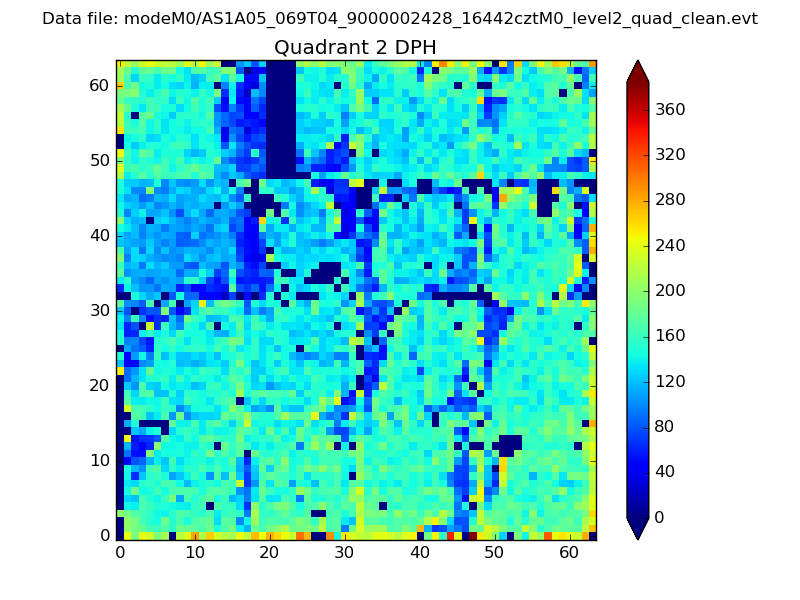
Histogram calculated using DETX and DETY for each event in the final _common_clean file
| Quadrant A | 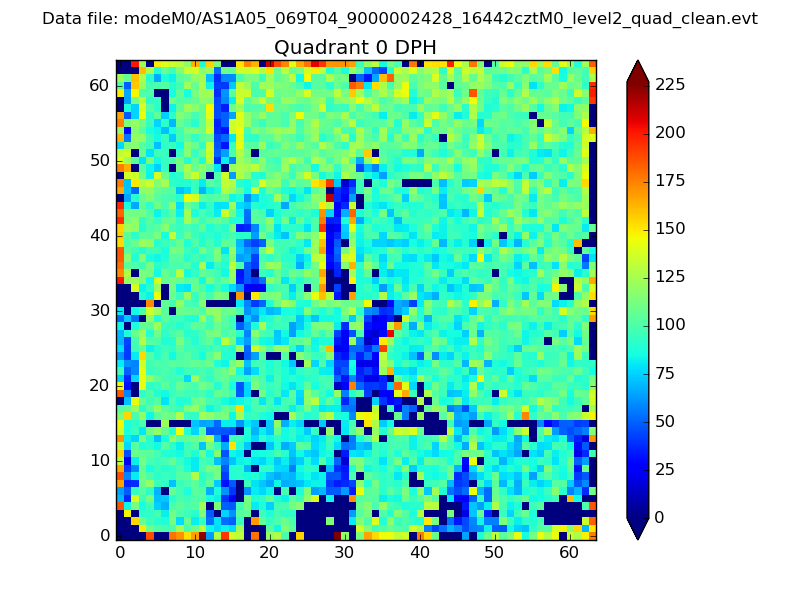 |
 |
Quadrant B |
|---|---|---|---|
| Quadrant D | 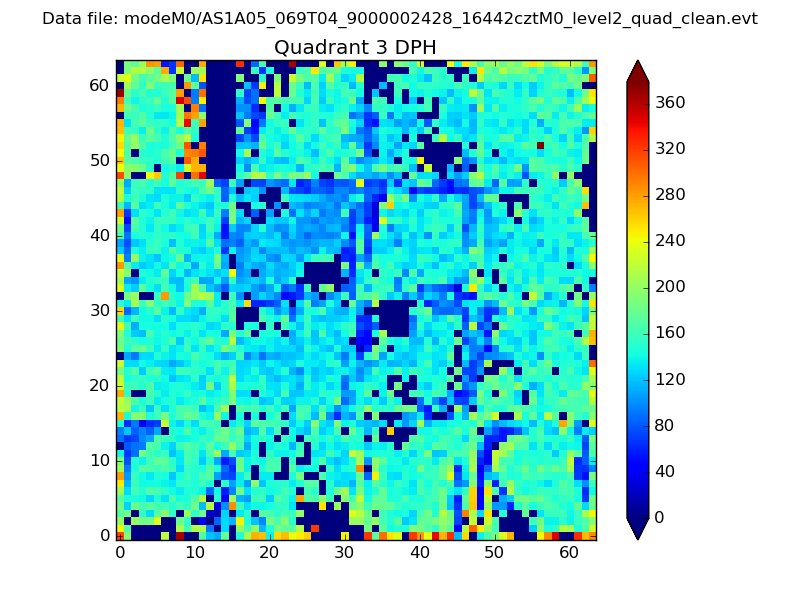 |
 |
Quadrant C |
| Plot type | Count rate plots | Images |
|---|---|---|
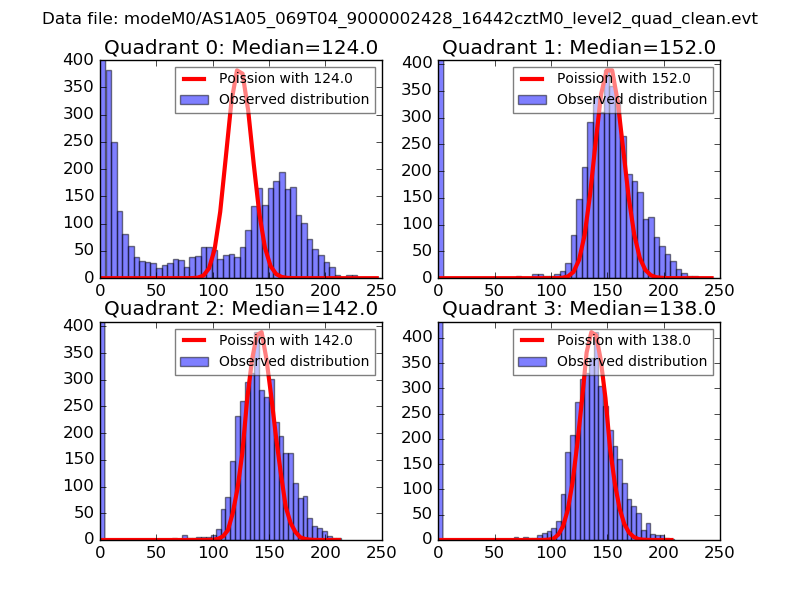
| Comparison with Poisson distribution Blue bars denote a histogram of data divided into 1 sec bins. Red curve is a Poisson curve with rate = median count rate of data. |
 |
 |
| Quadrant-wise count rates Data is divided into 100 sec bins |
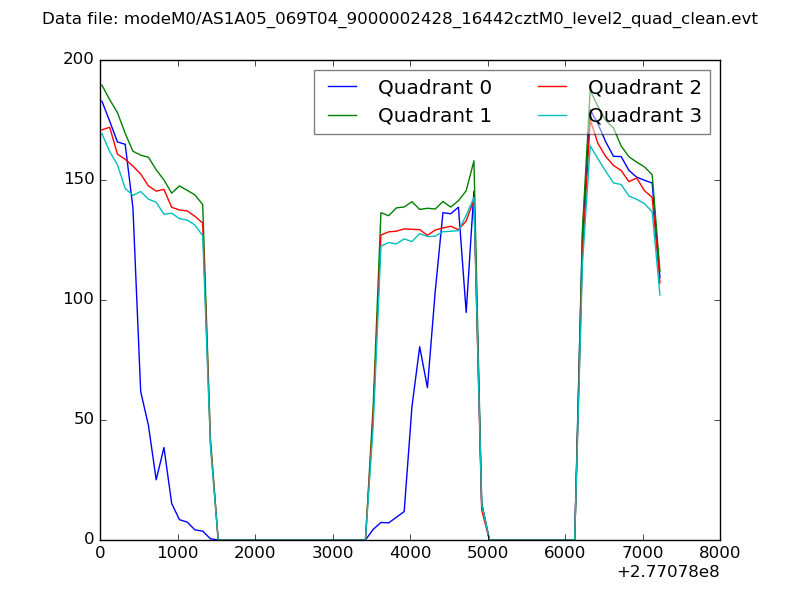 |
|
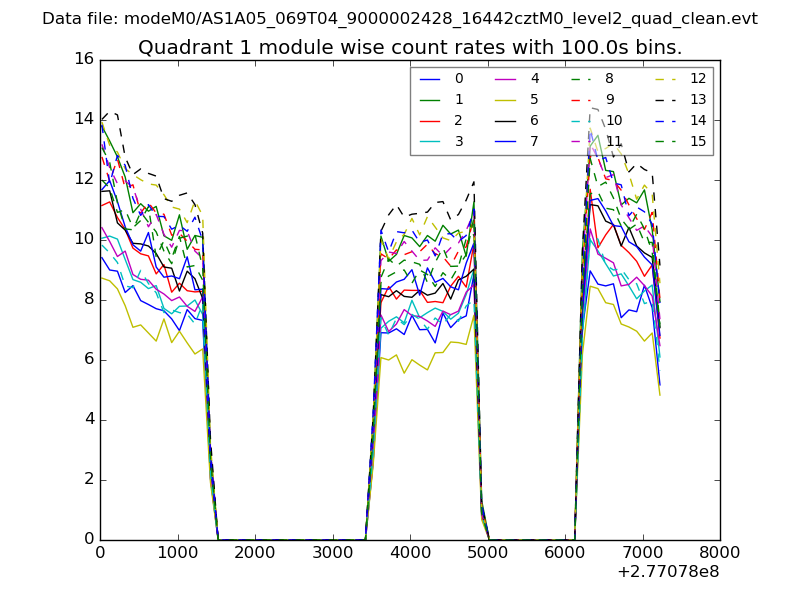
| Module-wise count rates for Quadrant A Data is divided into 100 sec bins |
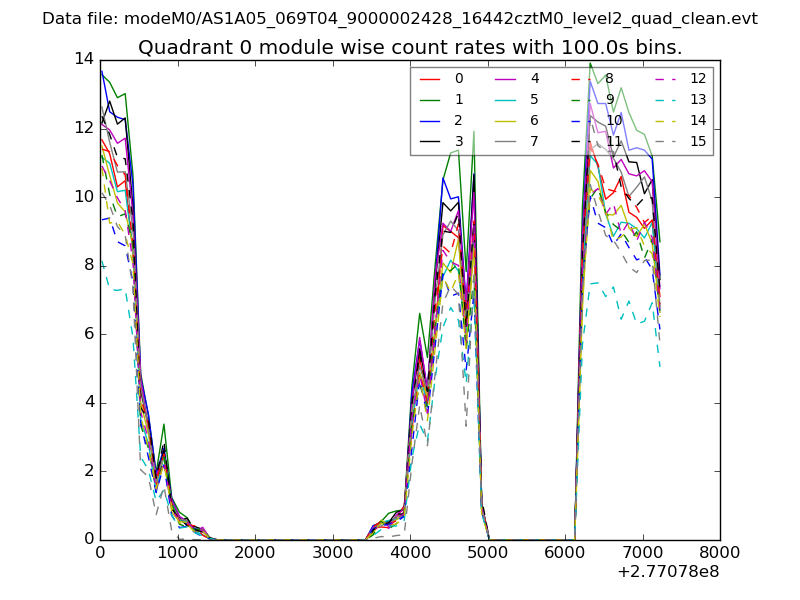 |
 |
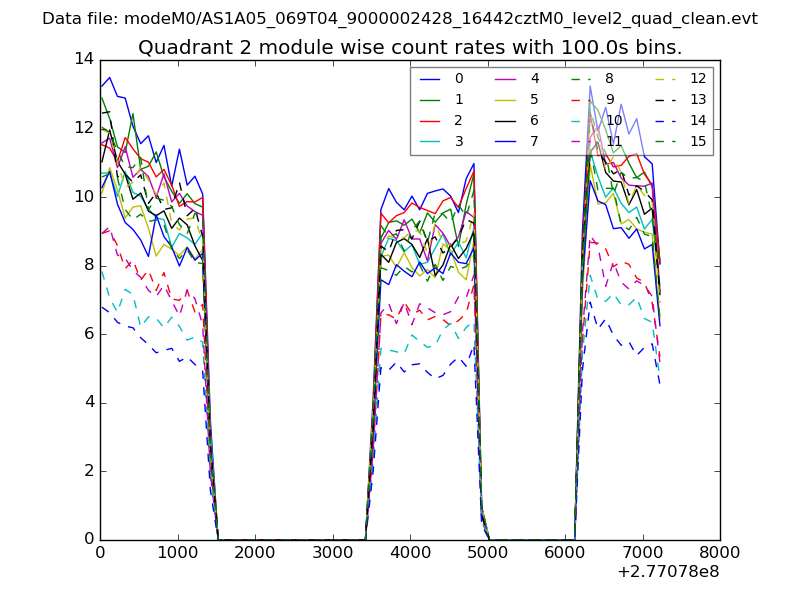
| Module-wise count rates for Quadrant B Data is divided into 100 sec bins |
 |
 |
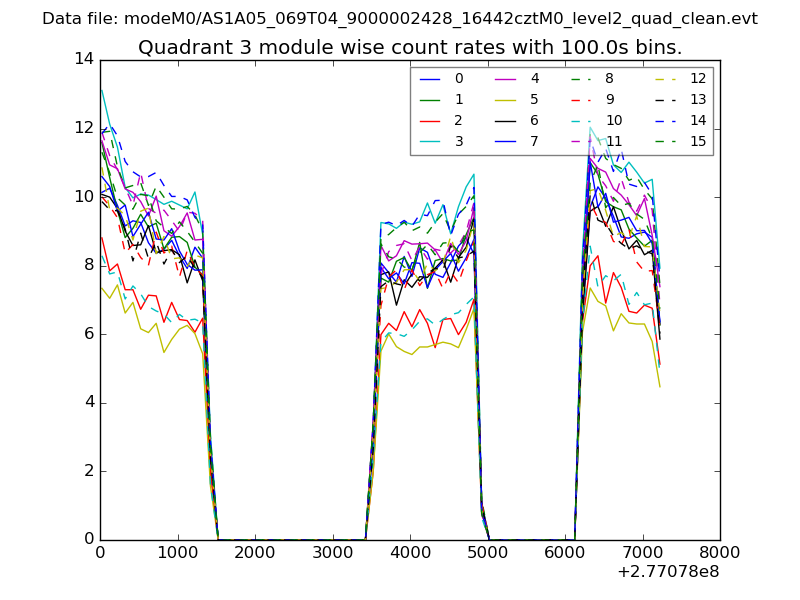
| Module-wise count rates for Quadrant C Data is divided into 100 sec bins |
 |
 |
| Module-wise count rates for Quadrant D Data is divided into 100 sec bins |
 |
 |
| Parameter | Plot |
|---|---|
| CZT HV Monitor | 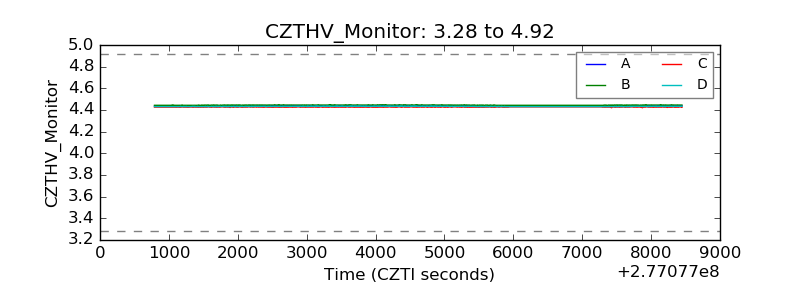 |
| D_VDD | 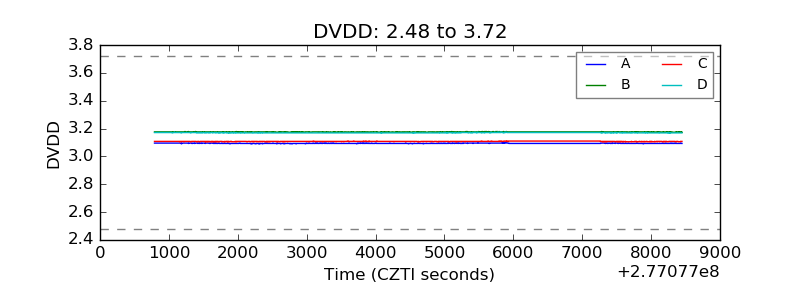 |
| Temperature 1 | 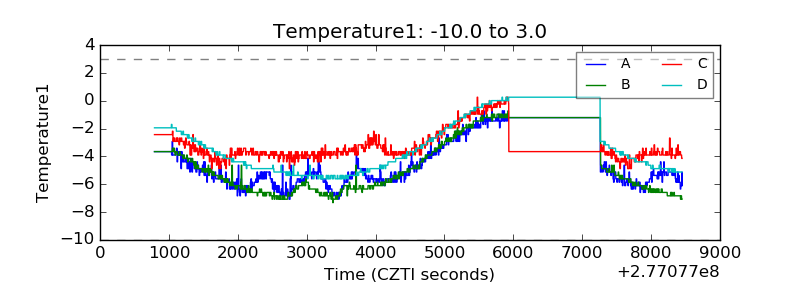 |
| Veto HV Monitor | 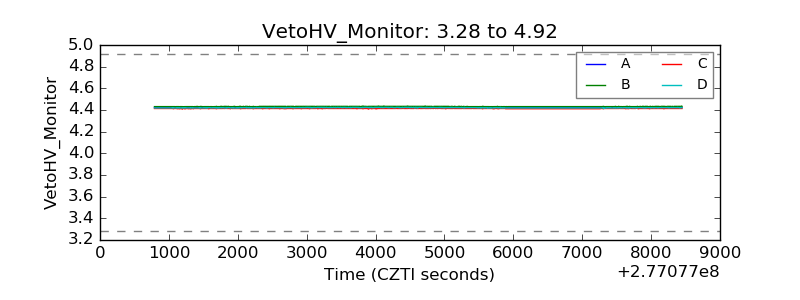 |
| Veto LLD | 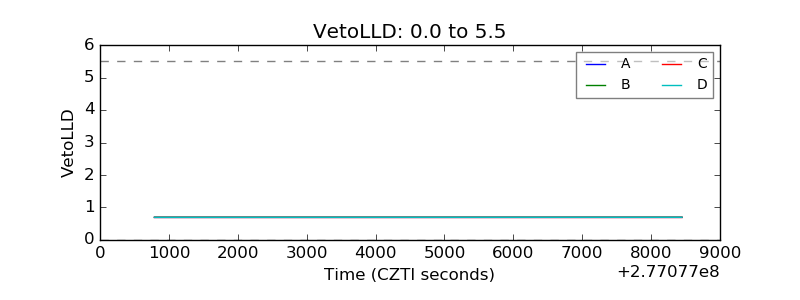 |
| Alpha Counter | 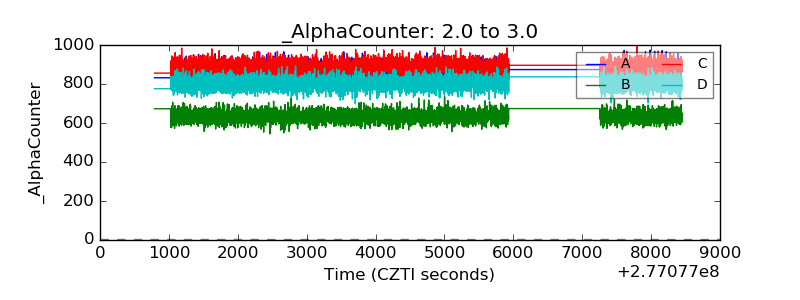 |
| _CPM_Rate | 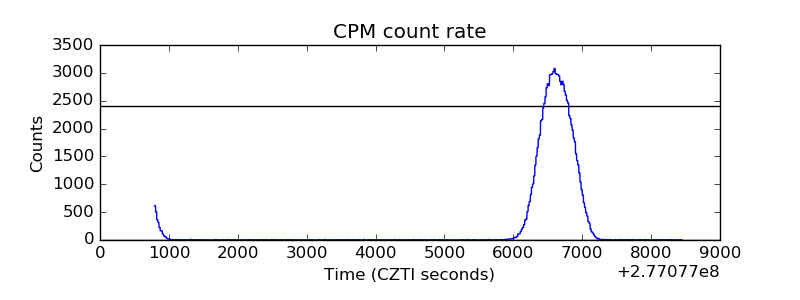 |
| CZT Counter | 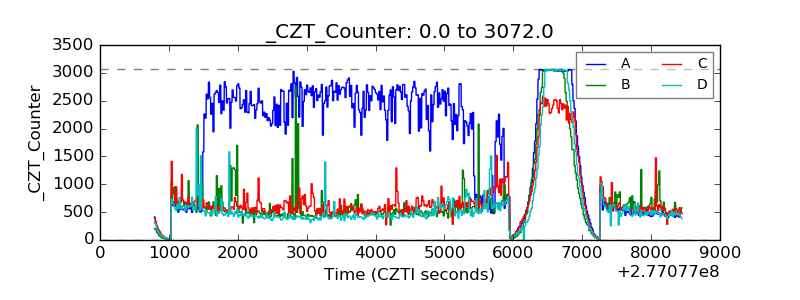 |
| +2.5 Volts monitor |  |
| +5 Volts monitor |  |
| _ROLL_ROT | 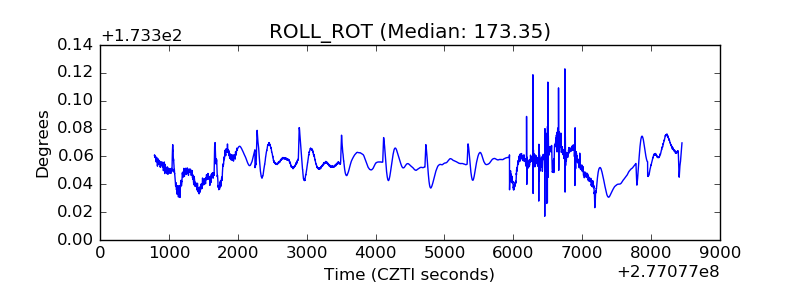 |
| _Roll_DEC | 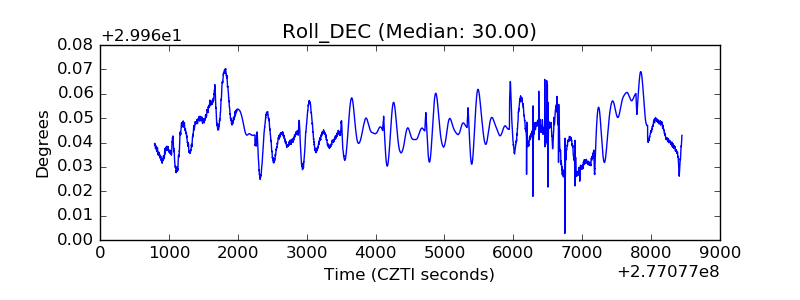 |
| _Roll_RA | 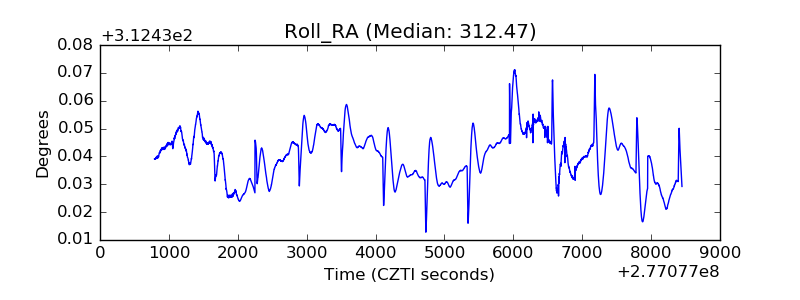 |
| Veto Counter | 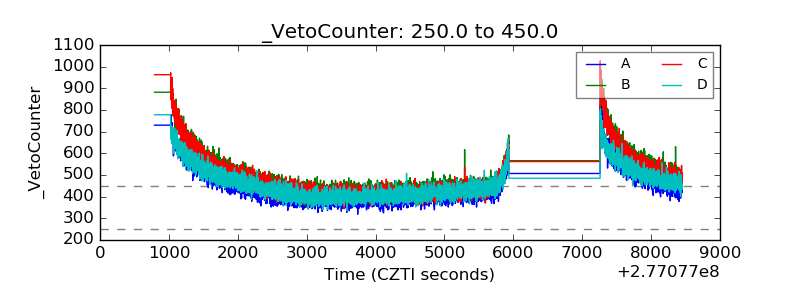 |