| Param | Original file | Final file |
|---|---|---|
| Filename | modeM0/AS1A05_069T04_9000002428_16443cztM0_level2.evt | modeM0/AS1A05_069T04_9000002428_16443cztM0_level2_quad_clean.evt |
| Size (bytes) | 503,170,560 | 81,492,480 |
| Size | 479.9 MB | 77.7 MB |
| Events in quadrant A | 3,724,733 | 515,712 |
| Events in quadrant B | 3,735,385 | 534,657 |
| Events in quadrant C | 4,021,484 | 496,613 |
| Events in quadrant D | 3,329,697 | 480,962 |
| Mode M0 | |||
|---|---|---|---|
| Quadrant | BADHDUFLAG | Total packets | Discarded packets |
| A | 0 | 14982 | 3 |
| B | 0 | 15103 | 2 |
| C | 0 | 16076 | 2 |
| D | 0 | 14133 | 2 |
| Mode SS | |||
|---|---|---|---|
| Quadrant | BADHDUFLAG | Total packets | Discarded packets |
| A | 0 | 130 | 0 |
| B | 0 | 130 | 0 |
| C | 0 | 130 | 0 |
| D | 0 | 130 | 0 |
| Mode M9 | |||
|---|---|---|---|
| Quadrant | BADHDUFLAG | Total packets | Discarded packets |
| A | 0 | 26 | 0 |
| B | 0 | 26 | 0 |
| C | 0 | 26 | 0 |
| D | 0 | 26 | 0 |
| Quadrant | Total seconds | Saturated seconds | Saturation percentage |
|---|---|---|---|
| A | 6291 | 116 | 1.843904% |
| B | 6291 | 105 | 1.669051% |
| C | 6291 | 193 | 3.067875% |
| D | 6291 | 62 | 0.985535% |
Noise dominated data is calculated using 1-second bins in cleaned event files. If a bin has >2000 counts, and if more than 50% of those come from <1% of pixels, then it is considered to be noise-dominated and hence unusable.
| Quadrant | # 1 sec bins | Bins with >0 counts | Bins with >2000 counts | High rate bins dominated by noise | Noise dominated (total time) | Noise dominated (detector-on time) | Marked lightcurve |
|---|---|---|---|---|---|---|---|
| A | 8962 | 6294 | 74 | 74 | 0.83% | 1.18% | 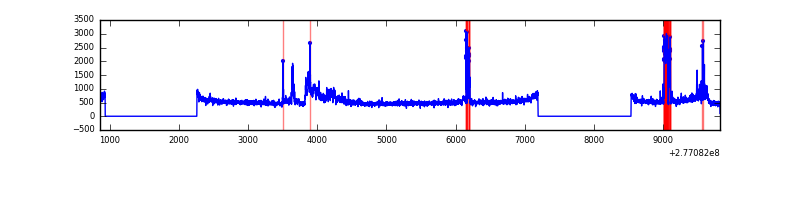 |
| B | 8962 | 6293 | 13 | 13 | 0.15% | 0.21% |  |
| C | 8962 | 6293 | 14 | 14 | 0.16% | 0.22% | 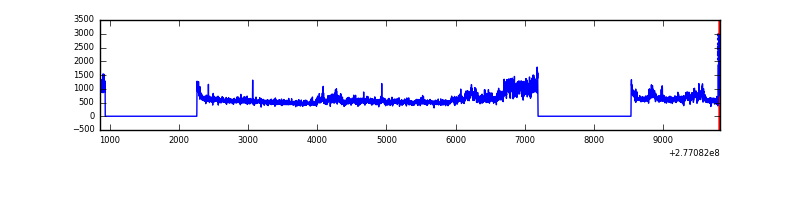 |
| D | 8962 | 6294 | 30 | 30 | 0.33% | 0.48% | 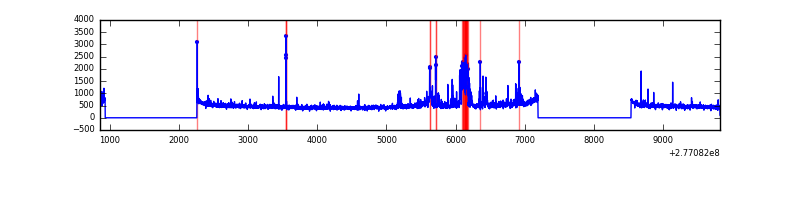 |
Top three noisy pixels from each quadrant. If the there are fewer than three noisy pixels in the level2.evt file, extra rows are filled as -1
| Pixel properties | Quadrant properties | ||||||
|---|---|---|---|---|---|---|---|
| Quadrant | DetID | PixID | Counts | Sigma | Mean | Median | Sigma |
| A | 15 | 174 | 630472 | 3919.4 | 805 | 788 | 160.7 |
| A | 0 | 226 | 7182 | 39.8 | 805 | 788 | 160.7 |
| A | 12 | 194 | 5832 | 31.4 | 805 | 788 | 160.7 |
| B | 15 | 35 | 146612 | 945.12 | 817 | 797 | 154.3 |
| B | 0 | 198 | 73970 | 474.28 | 817 | 797 | 154.3 |
| B | 0 | 244 | 71612 | 459.0 | 817 | 797 | 154.3 |
| C | 3 | 233 | 819611 | 4588.59 | 771 | 776 | 178.5 |
| C | 14 | 238 | 121522 | 676.64 | 771 | 776 | 178.5 |
| C | 4 | 254 | 63762 | 352.96 | 771 | 776 | 178.5 |
| D | 5 | 222 | 350293 | 1875.39 | 773 | 752 | 186.4 |
| D | 2 | 234 | 22013 | 114.07 | 773 | 752 | 186.4 |
| D | 2 | 120 | 18145 | 93.32 | 773 | 752 | 186.4 |
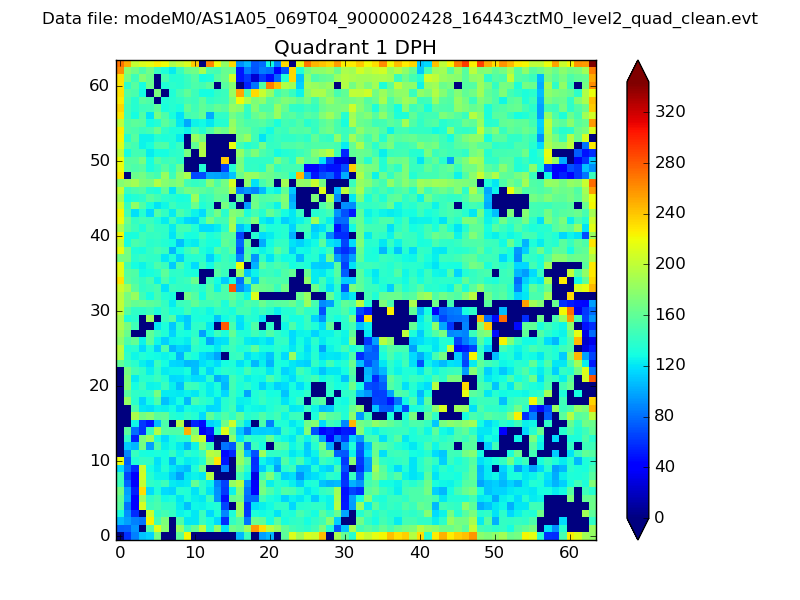
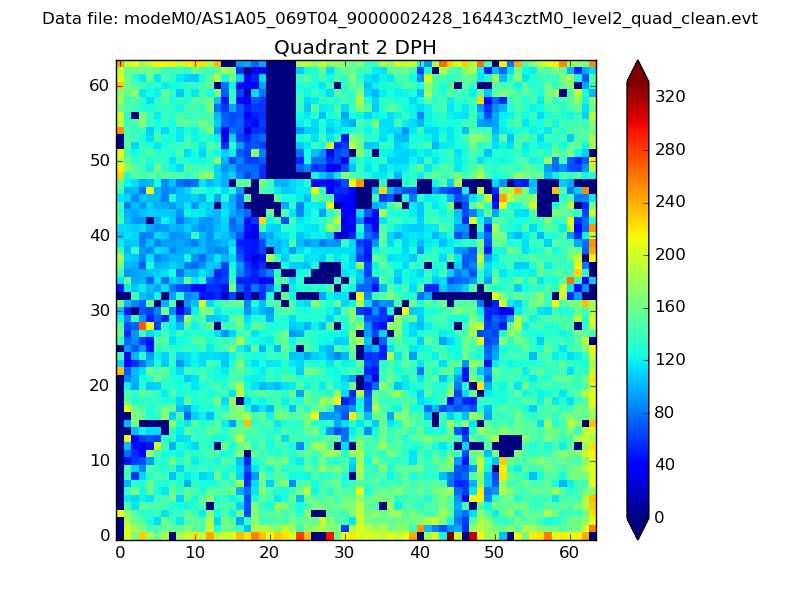
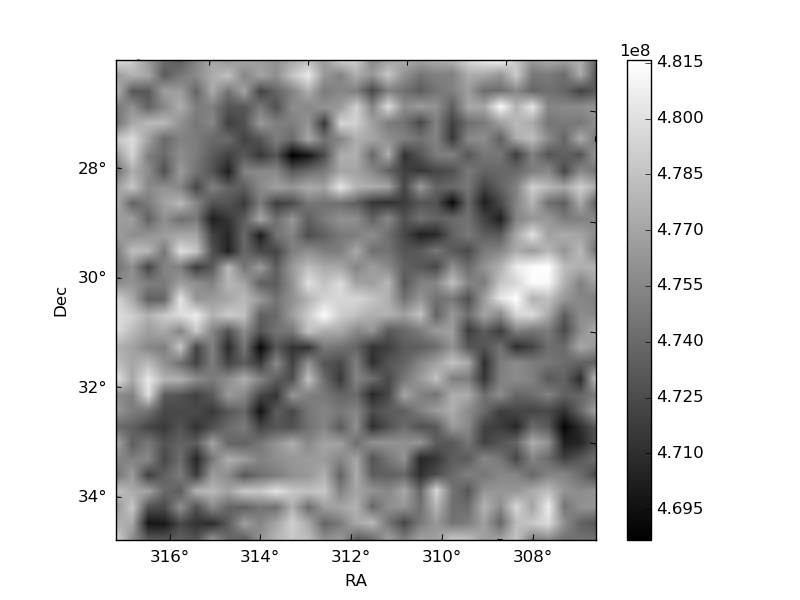
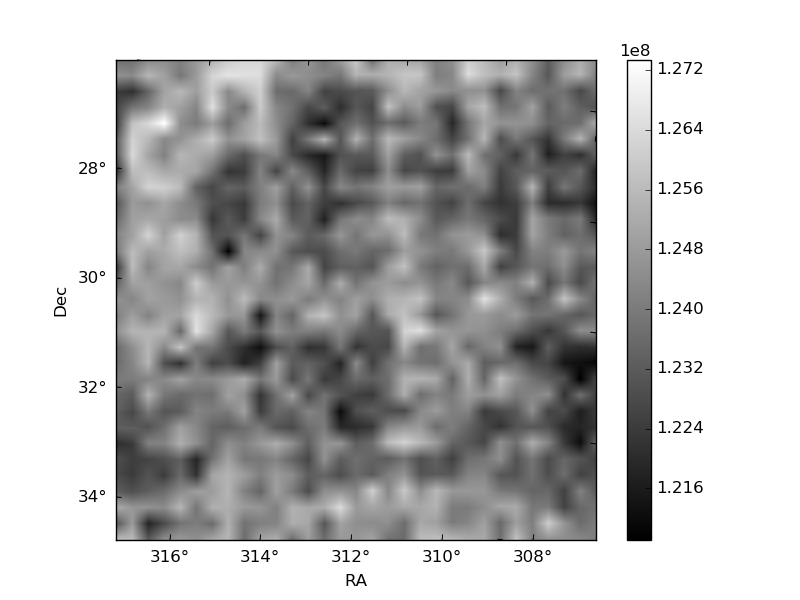
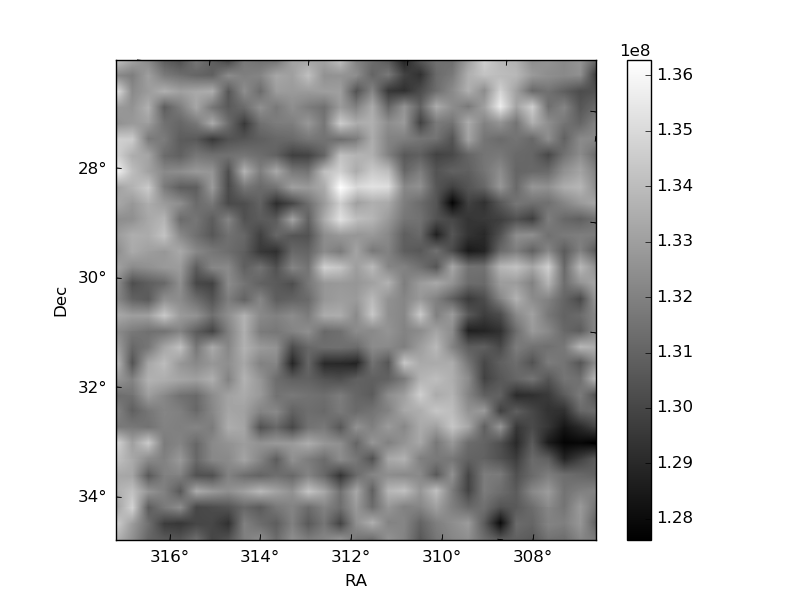
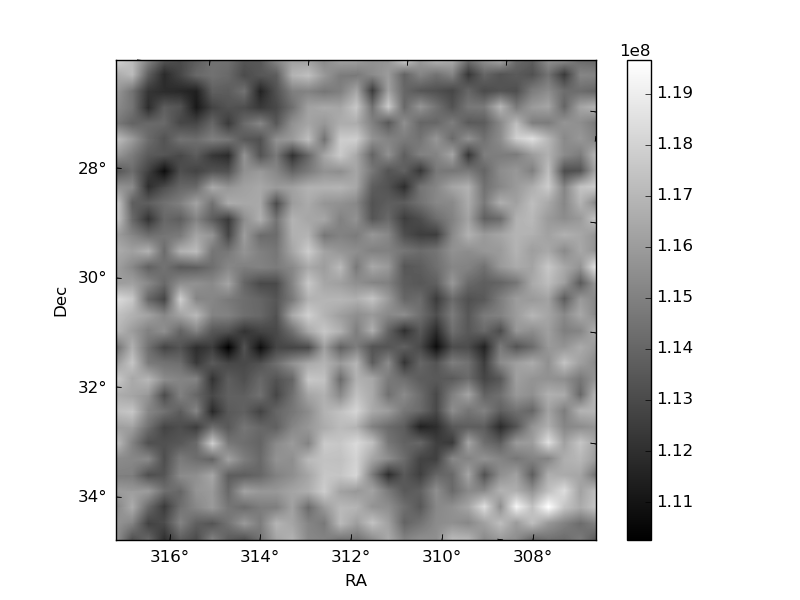
Histogram calculated using DETX and DETY for each event in the final _common_clean file
| Quadrant A | 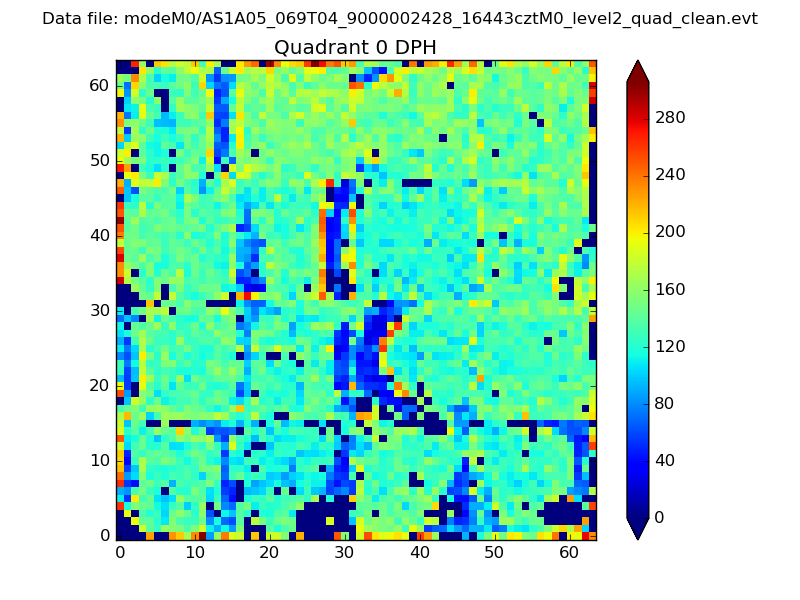 |
 |
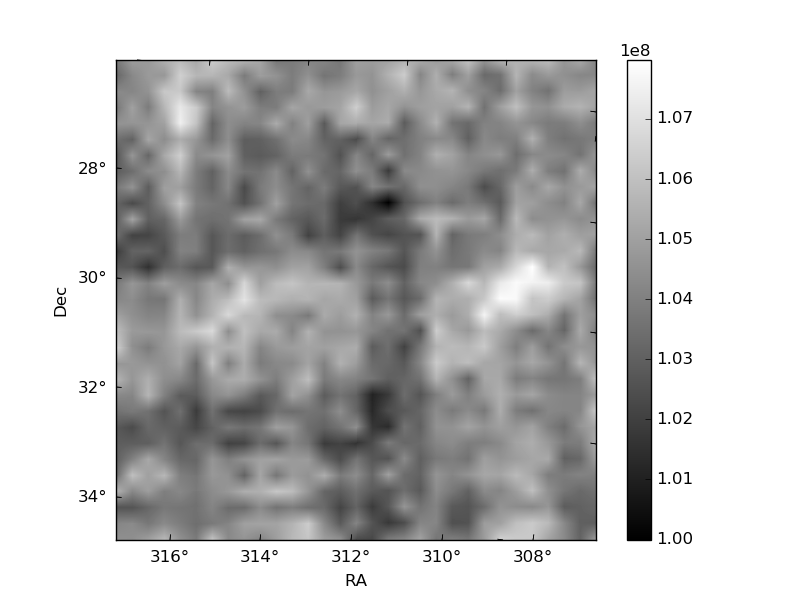
Quadrant B |
|---|---|---|---|
| Quadrant D | 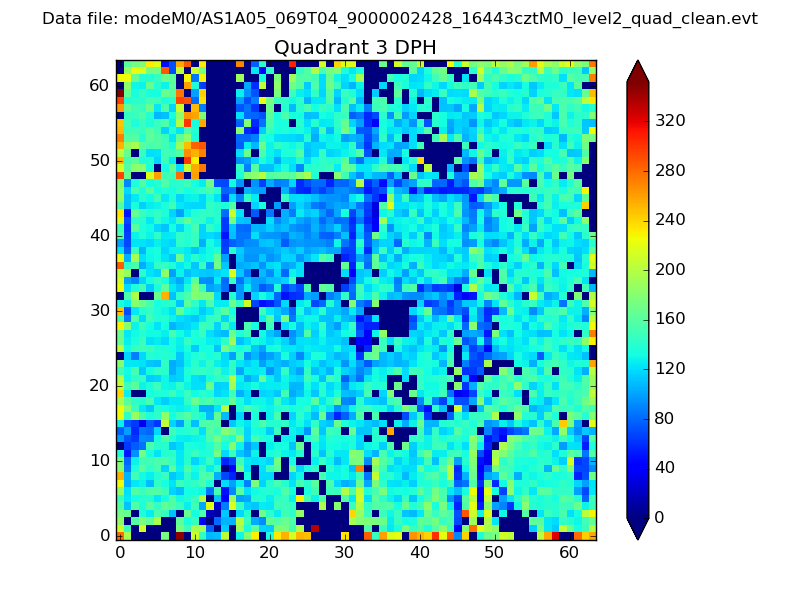 |
 |
Quadrant C |
| Plot type | Count rate plots | Images |
|---|---|---|
| Comparison with Poisson distribution Blue bars denote a histogram of data divided into 1 sec bins. Red curve is a Poisson curve with rate = median count rate of data. |
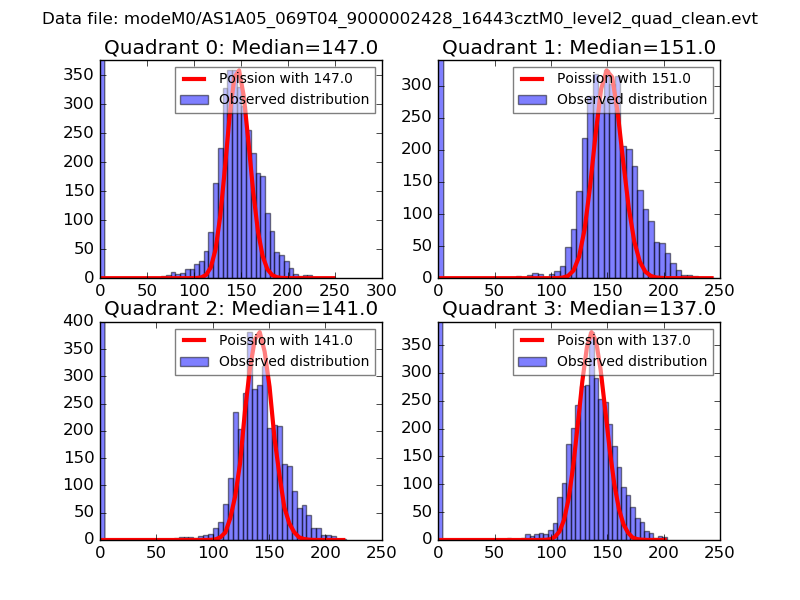 |
 |
| Quadrant-wise count rates Data is divided into 100 sec bins |
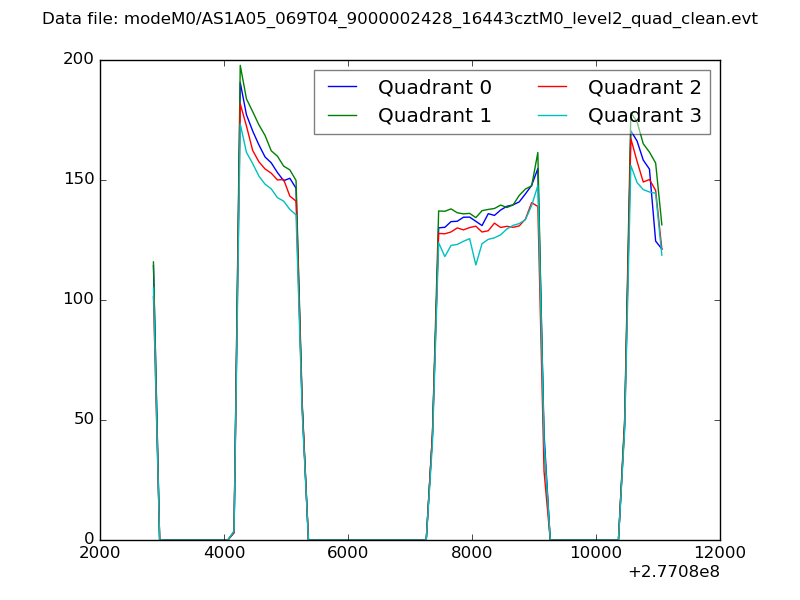 |
|
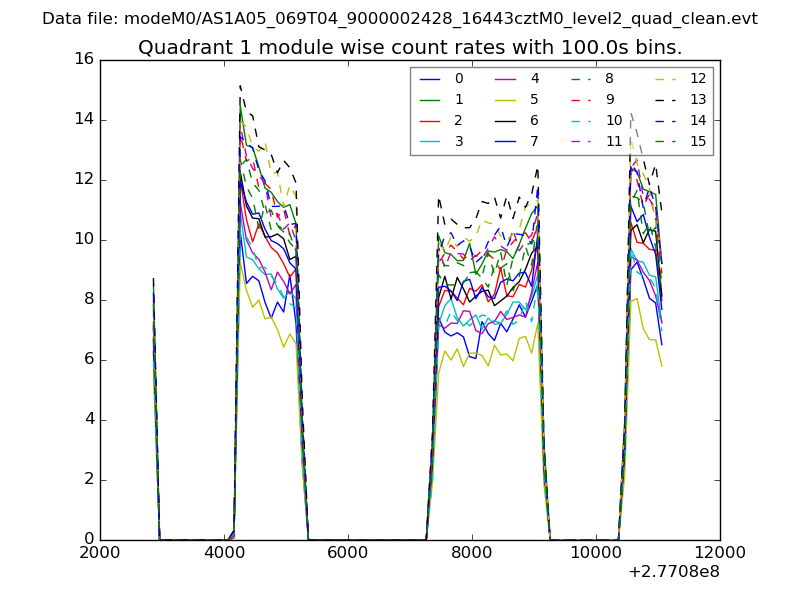
| Module-wise count rates for Quadrant A Data is divided into 100 sec bins |
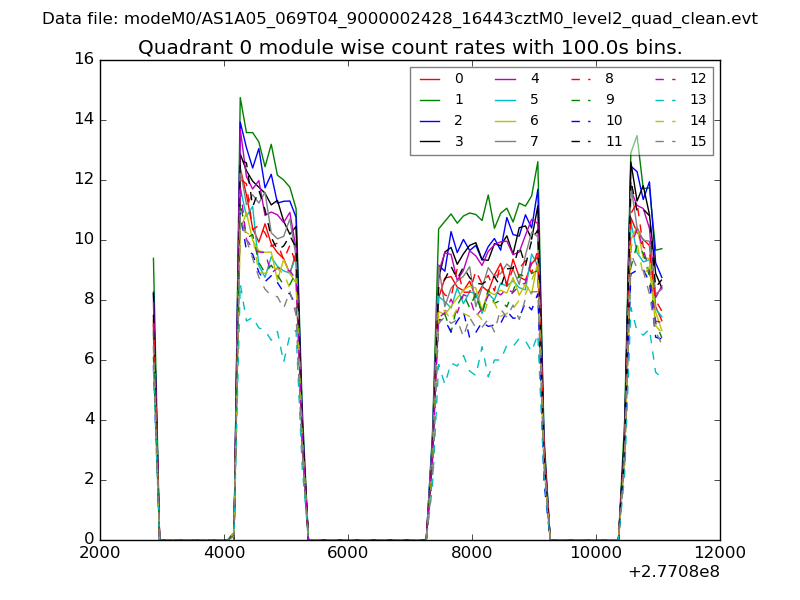 |
 |
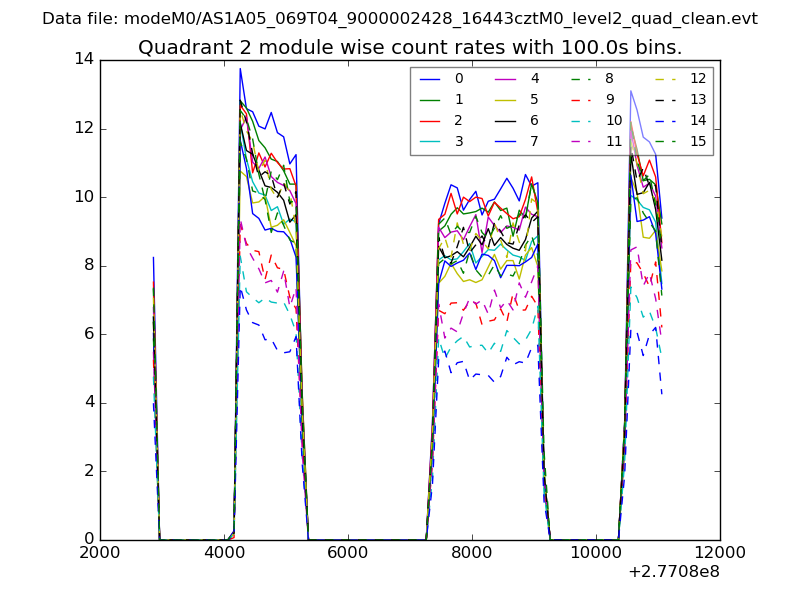
| Module-wise count rates for Quadrant B Data is divided into 100 sec bins |
 |
 |
| Module-wise count rates for Quadrant C Data is divided into 100 sec bins |
 |
 |
| Module-wise count rates for Quadrant D Data is divided into 100 sec bins |
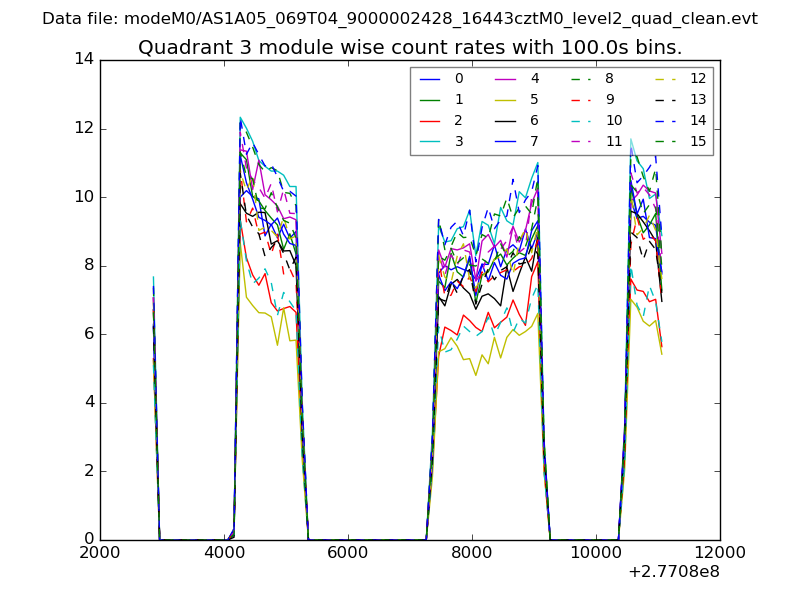 |
 |
| Parameter | Plot |
|---|---|
| CZT HV Monitor | 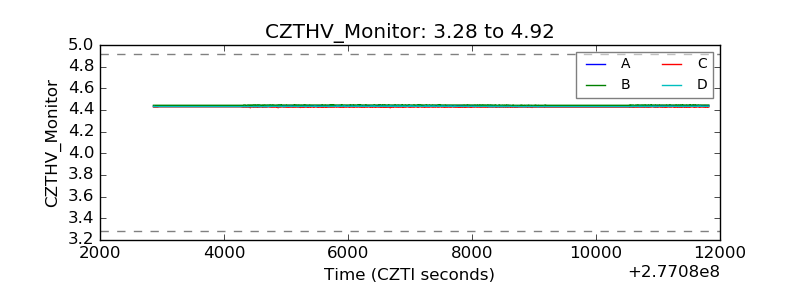 |
| D_VDD | 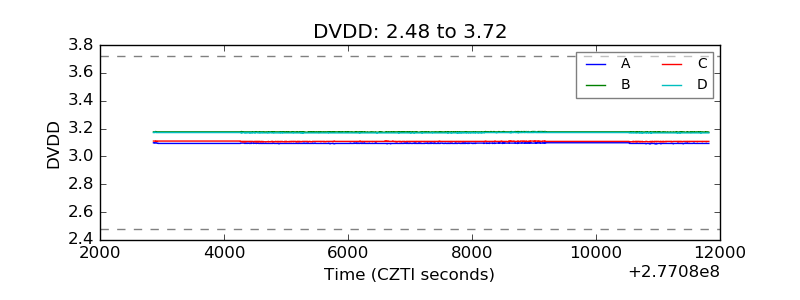 |
| Temperature 1 | 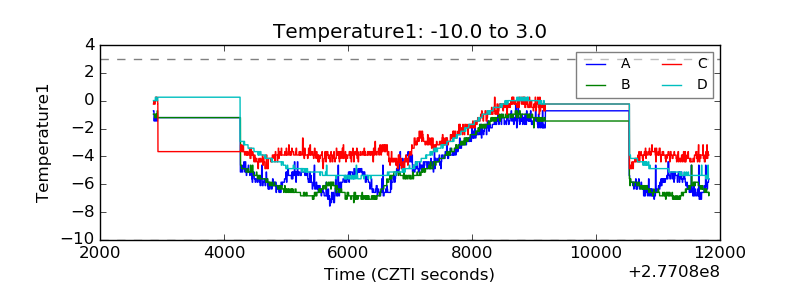 |
| Veto HV Monitor | 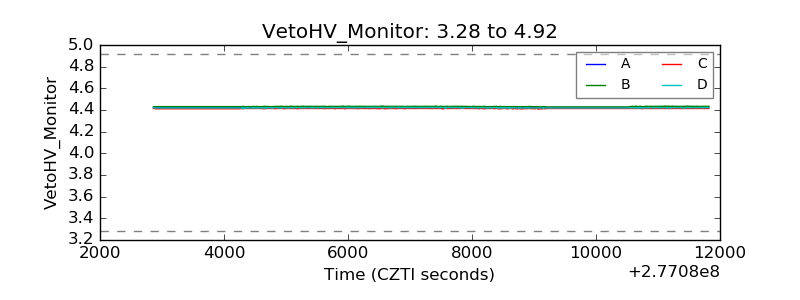 |
| Veto LLD | 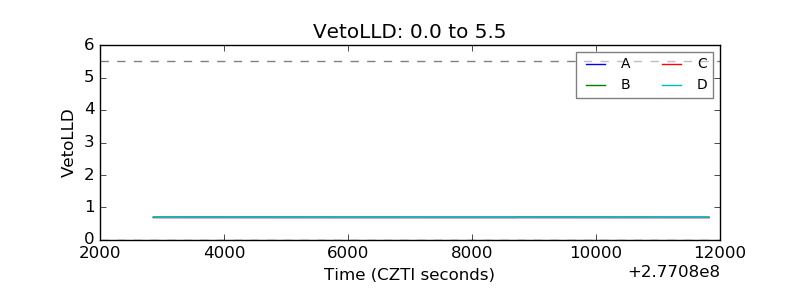 |
| Alpha Counter | 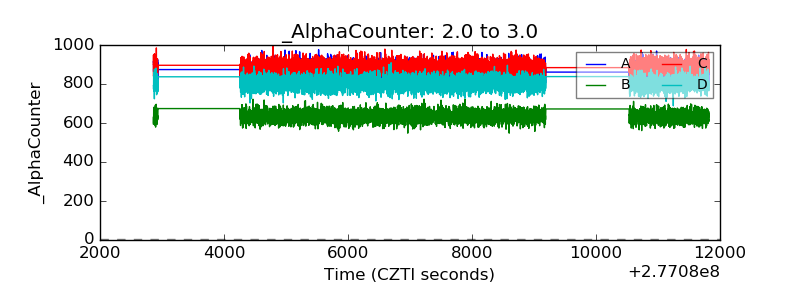 |
| _CPM_Rate | 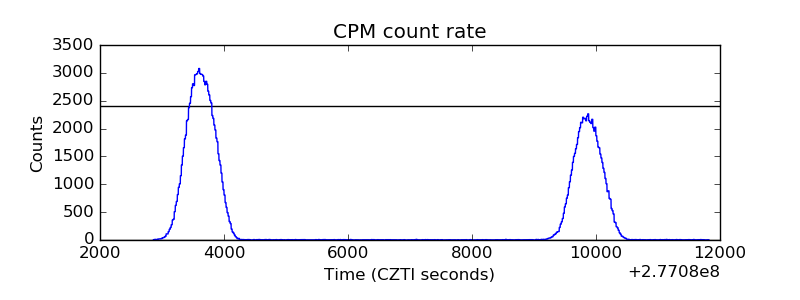 |
| CZT Counter | 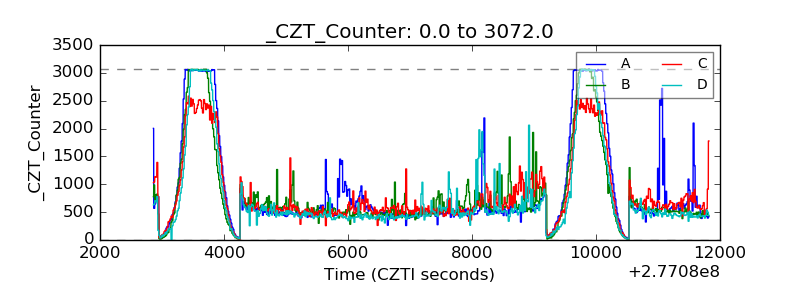 |
| +2.5 Volts monitor |  |
| +5 Volts monitor |  |
| _ROLL_ROT | 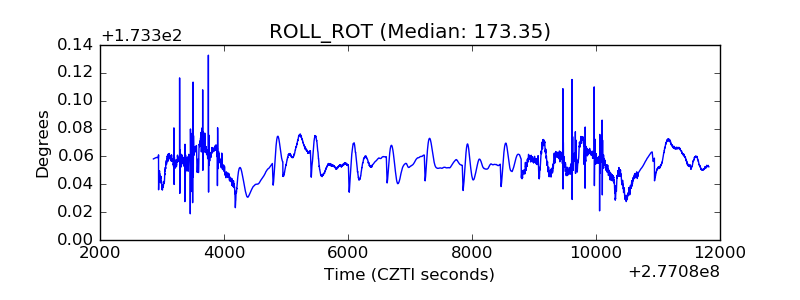 |
| _Roll_DEC | 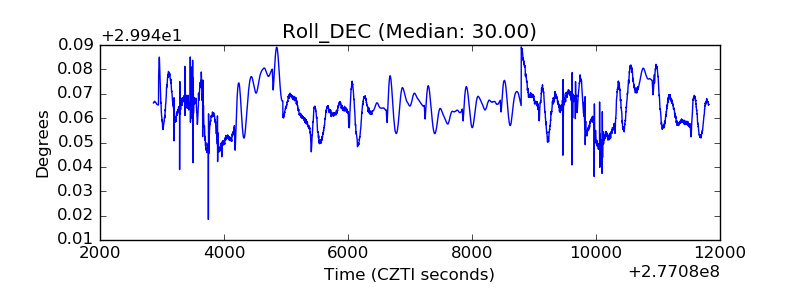 |
| _Roll_RA | 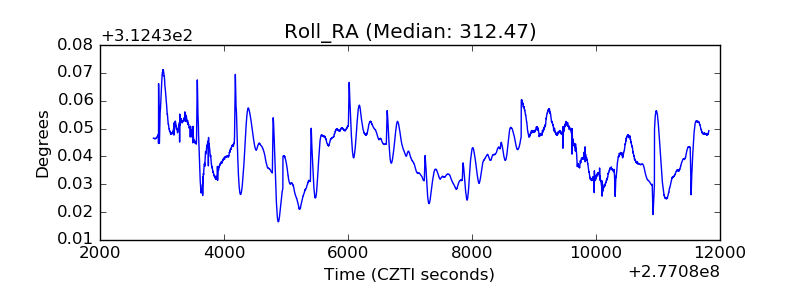 |
| Veto Counter | 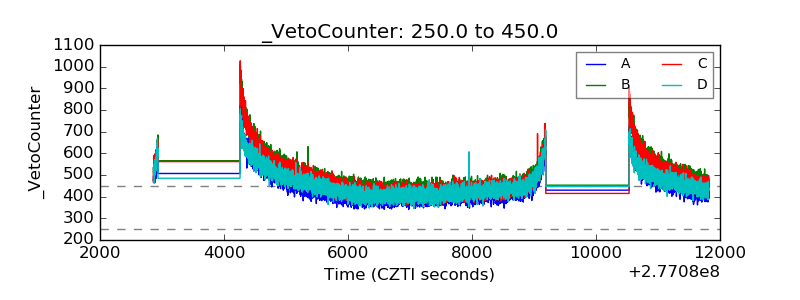 |