| Param | Original file | Final file |
|---|---|---|
| Filename | modeM0/AS1A05_069T04_9000002428_16446cztM0_level2.evt | modeM0/AS1A05_069T04_9000002428_16446cztM0_level2_quad_clean.evt |
| Size (bytes) | 568,103,040 | 75,277,440 |
| Size | 541.8 MB | 71.8 MB |
| Events in quadrant A | 3,343,607 | 461,685 |
| Events in quadrant B | 3,875,702 | 471,219 |
| Events in quadrant C | 6,365,191 | 421,083 |
| Events in quadrant D | 3,148,953 | 440,976 |
| Mode M0 | |||
|---|---|---|---|
| Quadrant | BADHDUFLAG | Total packets | Discarded packets |
| A | 0 | 14513 | 2 |
| B | 0 | 15939 | 1 |
| C | 0 | 23730 | 1 |
| D | 0 | 14355 | 1 |
| Mode SS | |||
|---|---|---|---|
| Quadrant | BADHDUFLAG | Total packets | Discarded packets |
| A | 0 | 142 | 0 |
| B | 0 | 142 | 0 |
| C | 0 | 142 | 0 |
| D | 0 | 142 | 0 |
| Mode M9 | |||
|---|---|---|---|
| Quadrant | BADHDUFLAG | Total packets | Discarded packets |
| A | 0 | 5 | 0 |
| B | 0 | 5 | 0 |
| C | 0 | 5 | 0 |
| D | 0 | 5 | 0 |
| Quadrant | Total seconds | Saturated seconds | Saturation percentage |
|---|---|---|---|
| A | 6947 | 171 | 2.461494% |
| B | 6947 | 204 | 2.936519% |
| C | 6947 | 992 | 14.279545% |
| D | 6947 | 101 | 1.453865% |
Noise dominated data is calculated using 1-second bins in cleaned event files. If a bin has >2000 counts, and if more than 50% of those come from <1% of pixels, then it is considered to be noise-dominated and hence unusable.
| Quadrant | # 1 sec bins | Bins with >0 counts | Bins with >2000 counts | High rate bins dominated by noise | Noise dominated (total time) | Noise dominated (detector-on time) | Marked lightcurve |
|---|---|---|---|---|---|---|---|
| A | 7493 | 6948 | 5 | 5 | 0.07% | 0.07% | 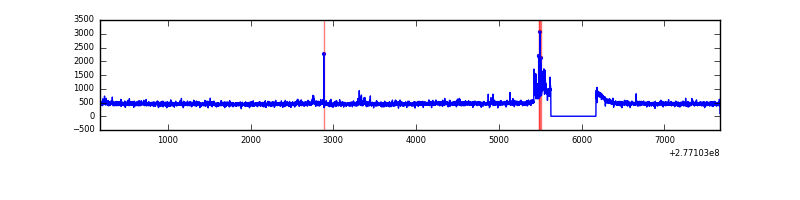 |
| B | 7493 | 6948 | 16 | 16 | 0.21% | 0.23% | 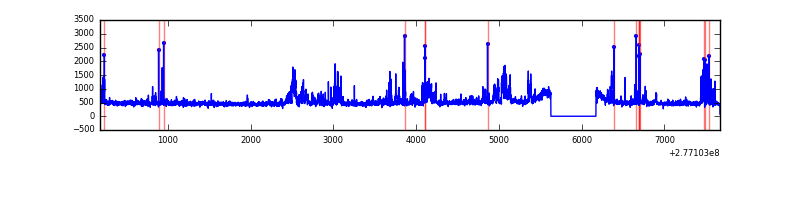 |
| C | 7493 | 6948 | 517 | 517 | 6.90% | 7.44% | 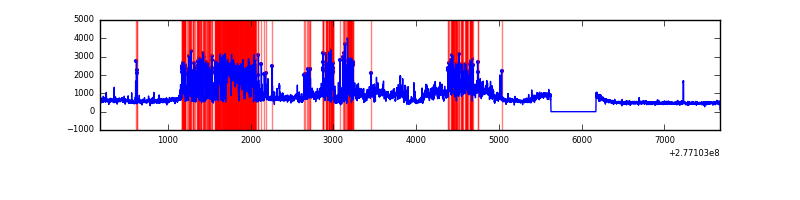 |
| D | 7493 | 6948 | 5 | 5 | 0.07% | 0.07% | 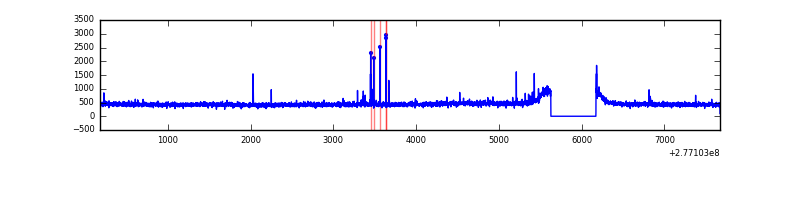 |
Top three noisy pixels from each quadrant. If the there are fewer than three noisy pixels in the level2.evt file, extra rows are filled as -1
| Pixel properties | Quadrant properties | ||||||
|---|---|---|---|---|---|---|---|
| Quadrant | DetID | PixID | Counts | Sigma | Mean | Median | Sigma |
| A | 15 | 174 | 116223 | 674.5 | 838 | 818 | 171.1 |
| A | 0 | 226 | 7304 | 37.91 | 838 | 818 | 171.1 |
| A | 15 | 223 | 6548 | 33.49 | 838 | 818 | 171.1 |
| B | 15 | 35 | 217348 | 1323.17 | 845 | 821 | 163.6 |
| B | 4 | 173 | 130260 | 790.99 | 845 | 821 | 163.6 |
| B | 4 | 216 | 73812 | 446.04 | 845 | 821 | 163.6 |
| C | 4 | 254 | 1662732 | 9247.63 | 762 | 766 | 179.7 |
| C | 3 | 233 | 1574750 | 8758.07 | 762 | 766 | 179.7 |
| C | 14 | 238 | 117255 | 648.18 | 762 | 766 | 179.7 |
| D | 10 | 70 | 30184 | 149.27 | 816 | 793 | 196.9 |
| D | 2 | 234 | 25985 | 127.95 | 816 | 793 | 196.9 |
| D | 14 | 226 | 7820 | 35.69 | 816 | 793 | 196.9 |
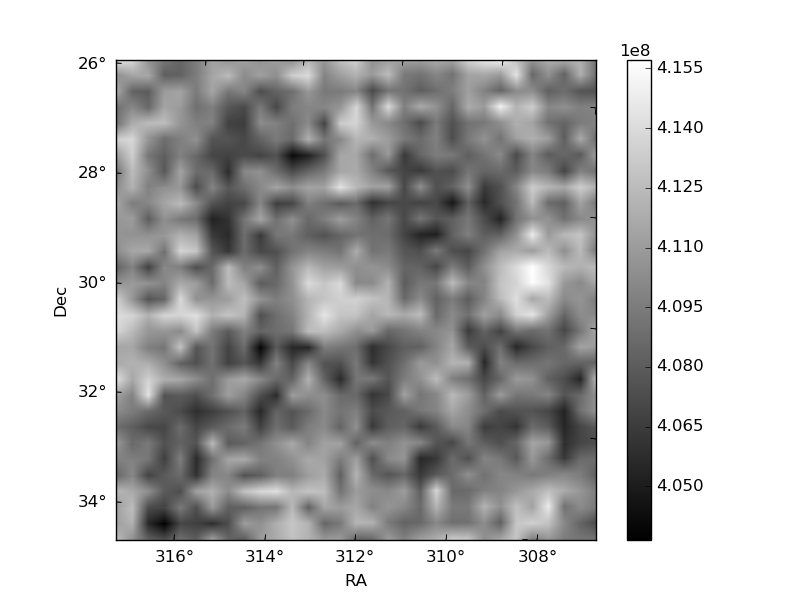
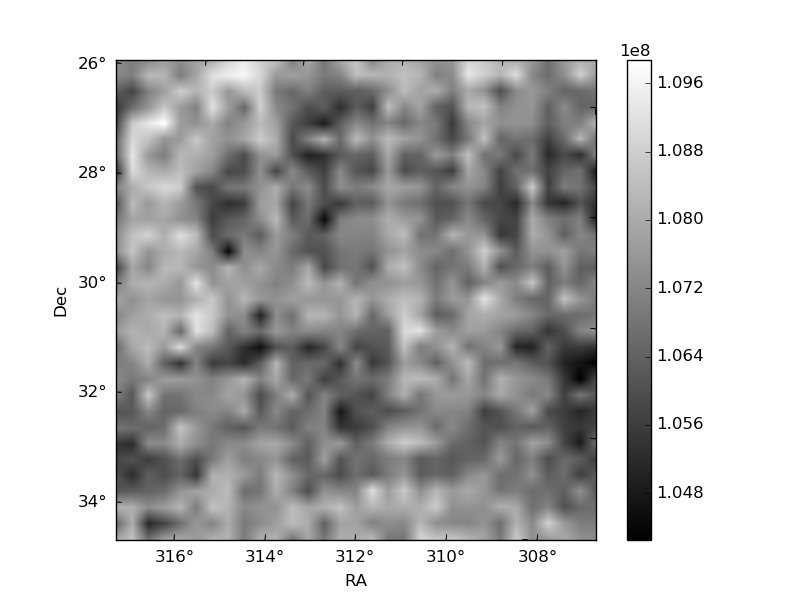
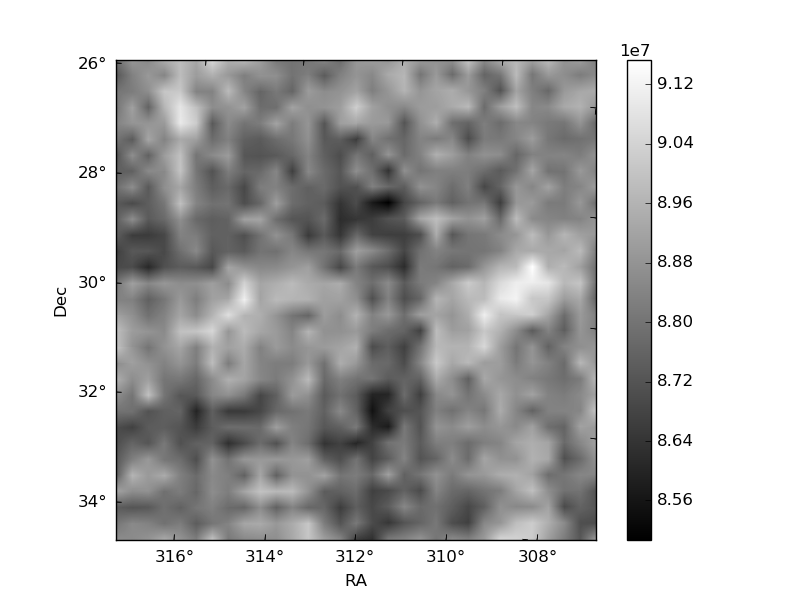
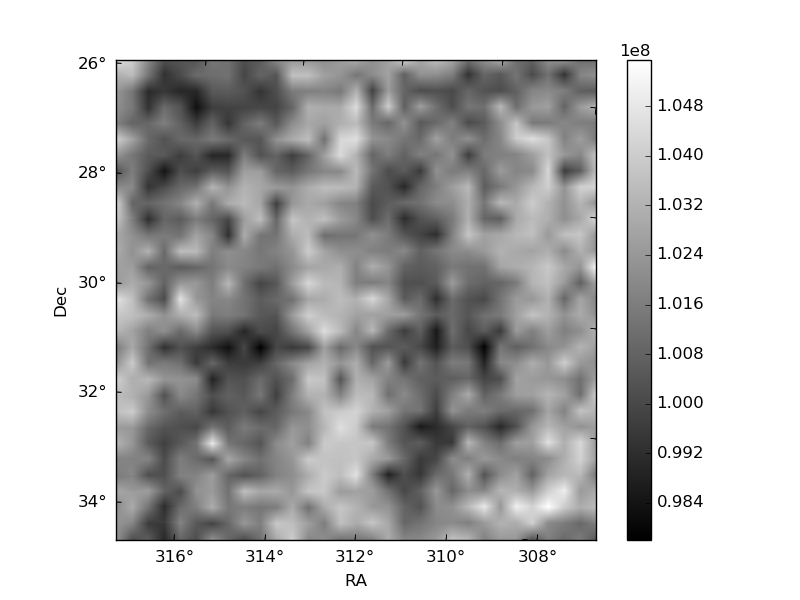
Histogram calculated using DETX and DETY for each event in the final _common_clean file
| Quadrant A | 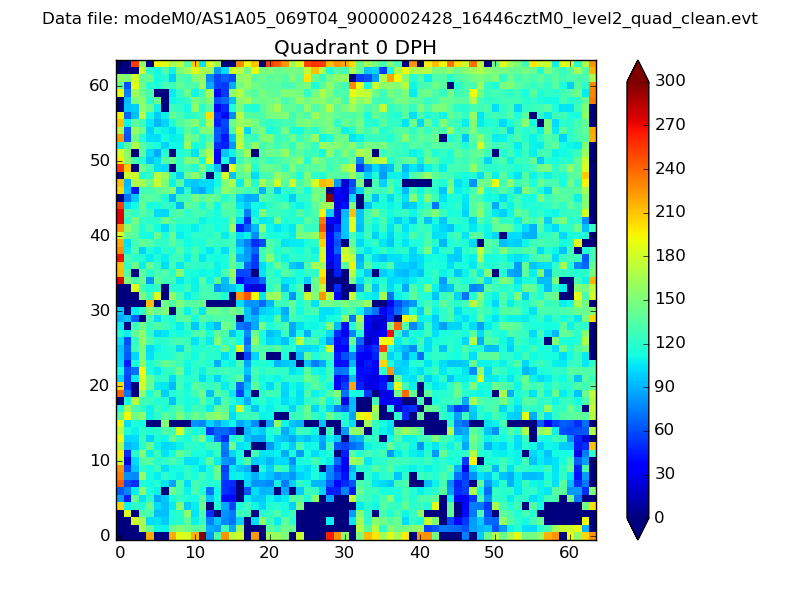 |
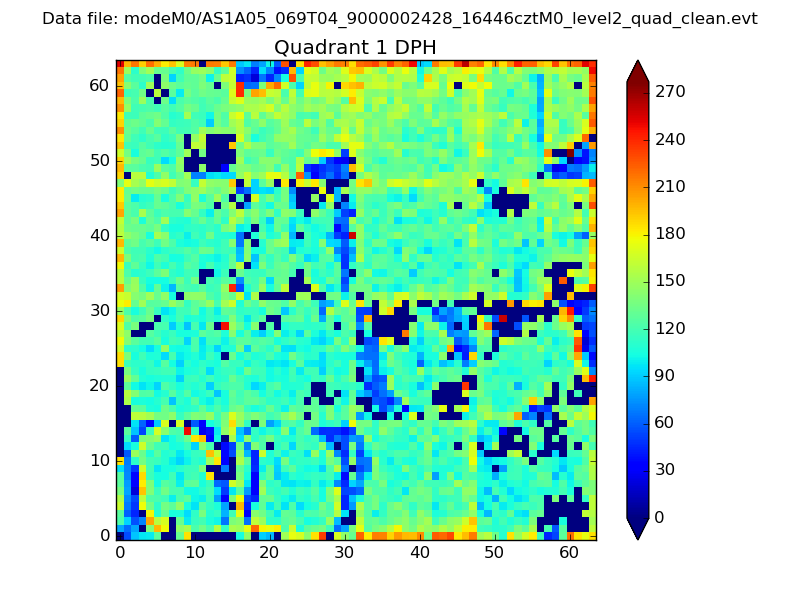 |
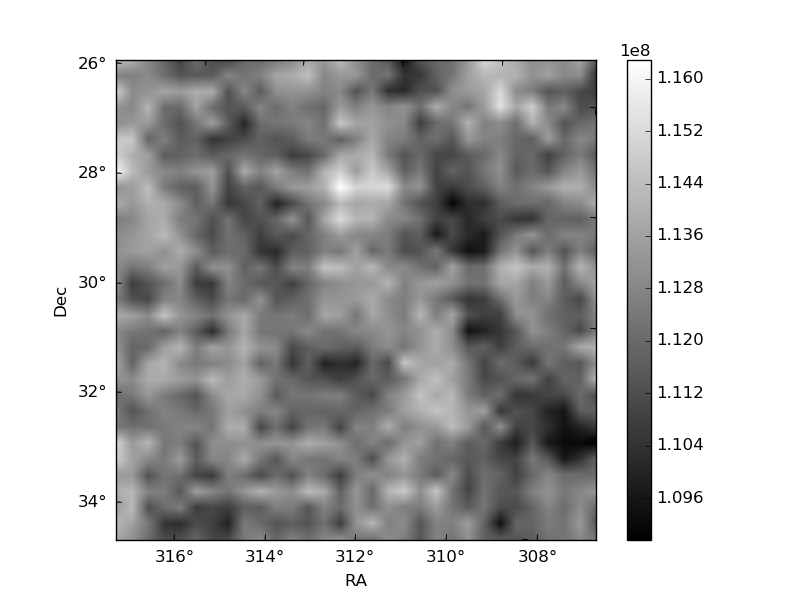
Quadrant B |
|---|---|---|---|
| Quadrant D | 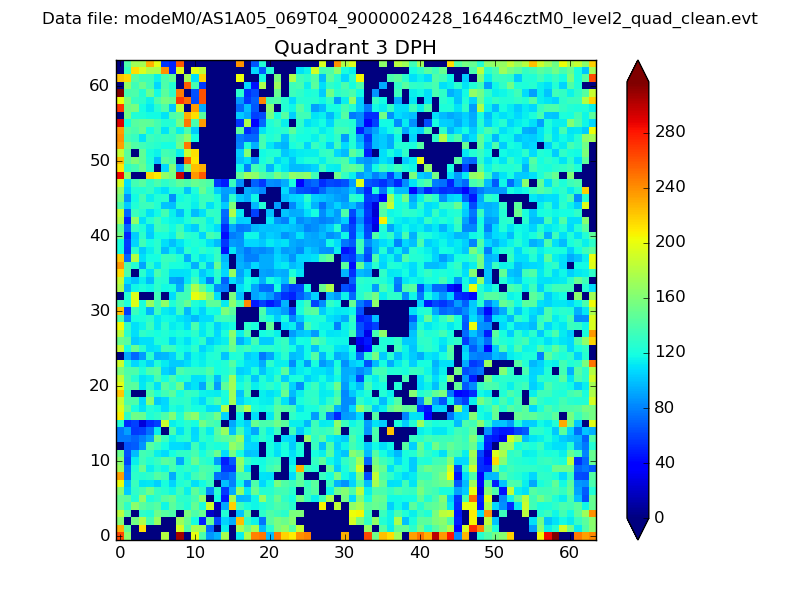 |
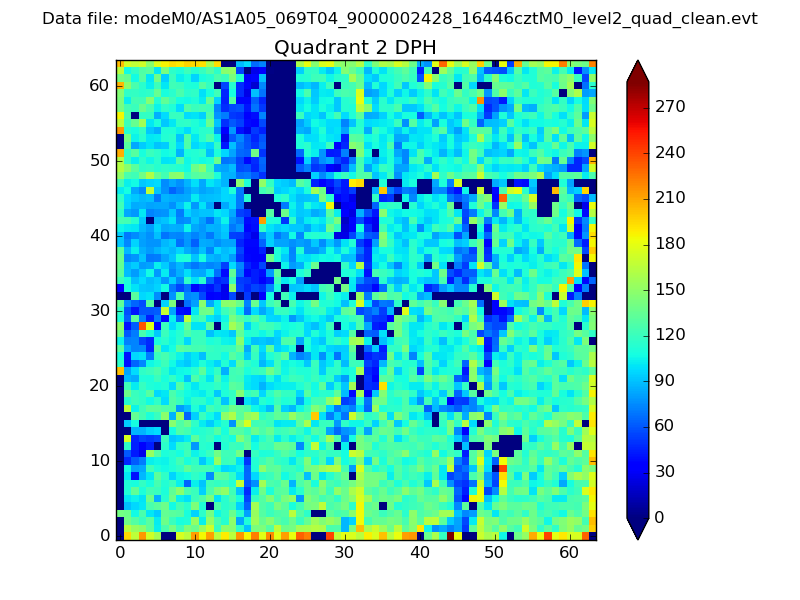 |
Quadrant C |
| Plot type | Count rate plots | Images |
|---|---|---|
| Comparison with Poisson distribution Blue bars denote a histogram of data divided into 1 sec bins. Red curve is a Poisson curve with rate = median count rate of data. |
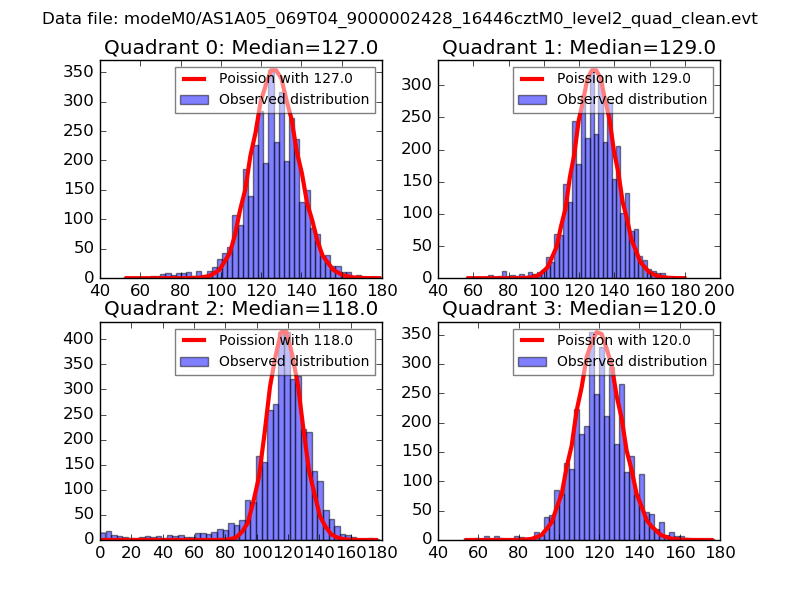 |
 |
| Quadrant-wise count rates Data is divided into 100 sec bins |
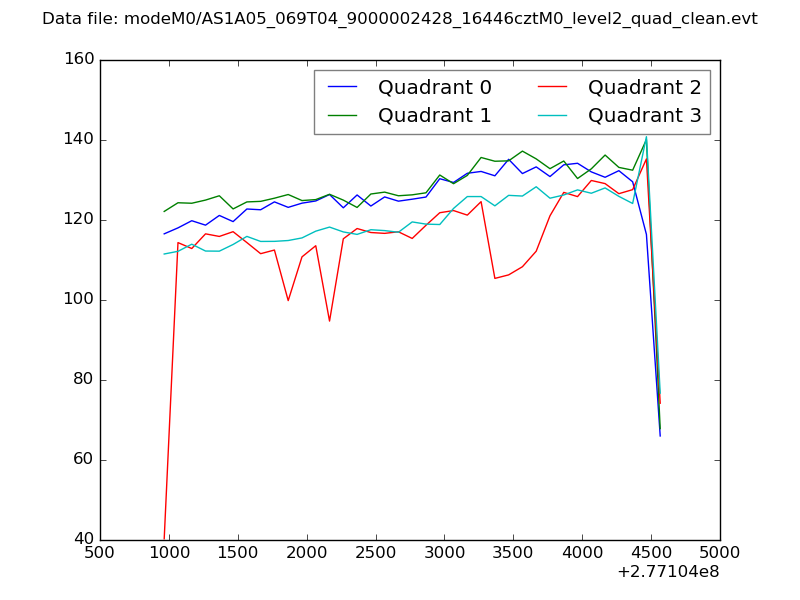 |
|
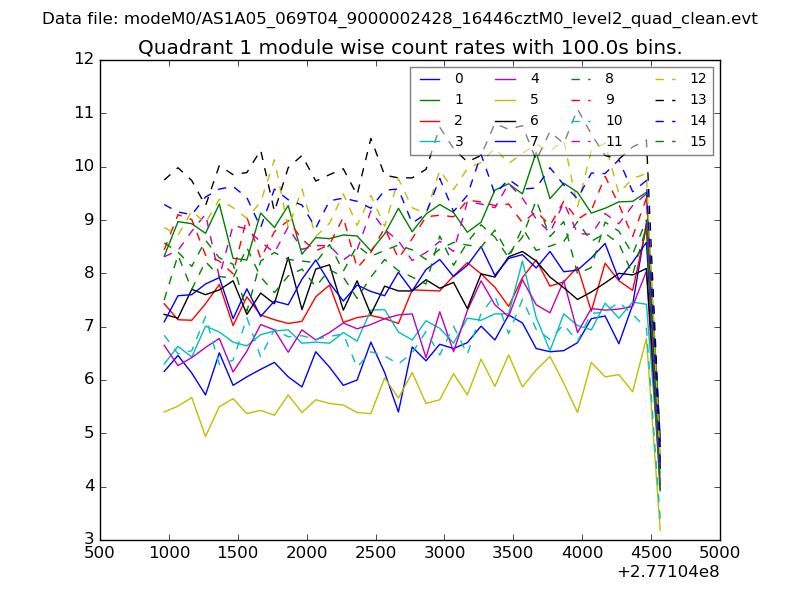
| Module-wise count rates for Quadrant A Data is divided into 100 sec bins |
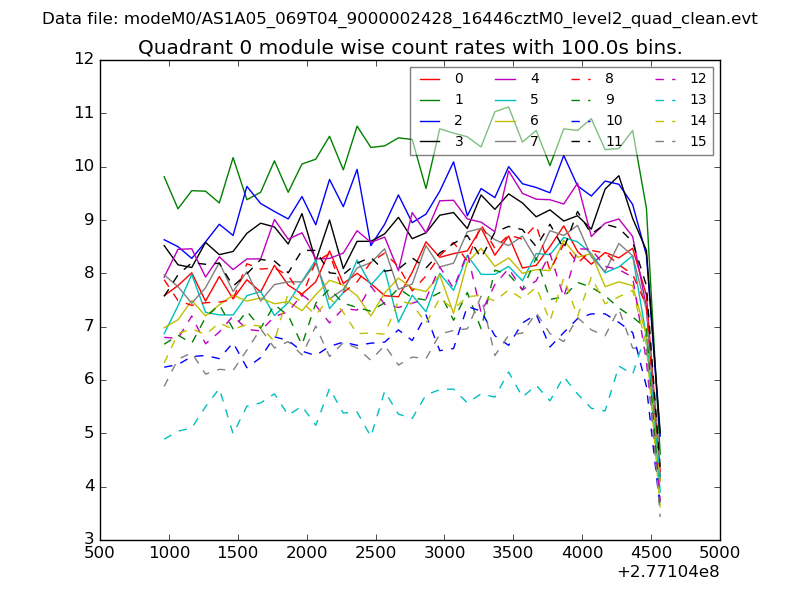 |
 |
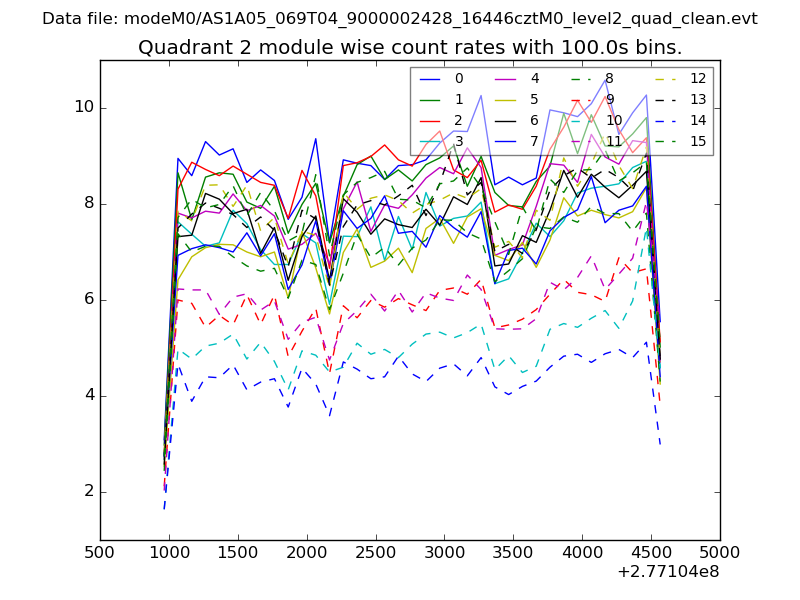
| Module-wise count rates for Quadrant B Data is divided into 100 sec bins |
 |
 |
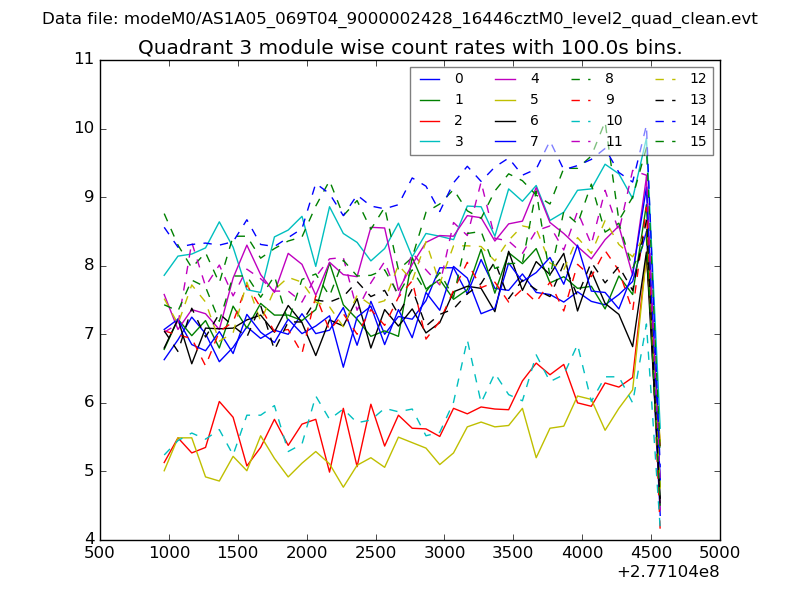
| Module-wise count rates for Quadrant C Data is divided into 100 sec bins |
 |
 |
| Module-wise count rates for Quadrant D Data is divided into 100 sec bins |
 |
 |
| Parameter | Plot |
|---|---|
| CZT HV Monitor | 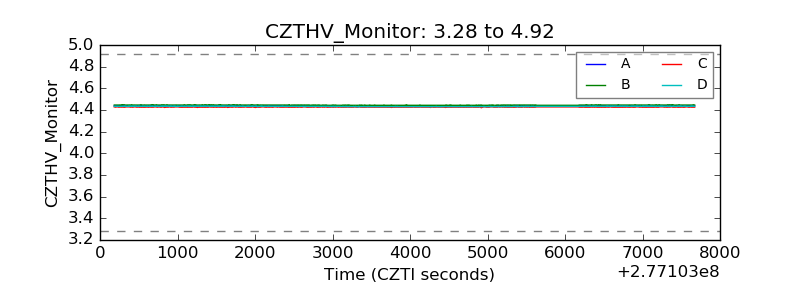 |
| D_VDD | 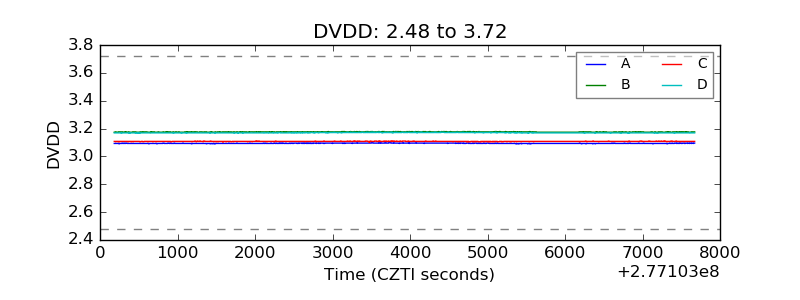 |
| Temperature 1 | 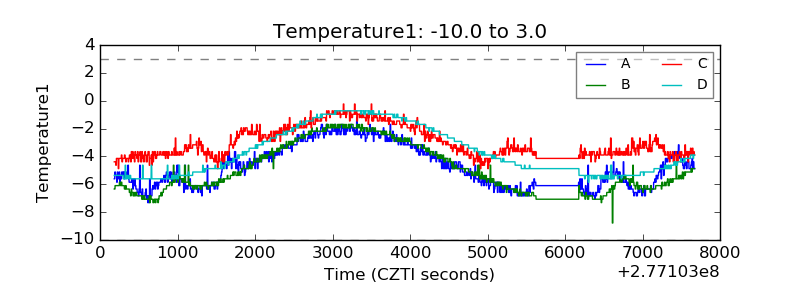 |
| Veto HV Monitor |  |
| Veto LLD | 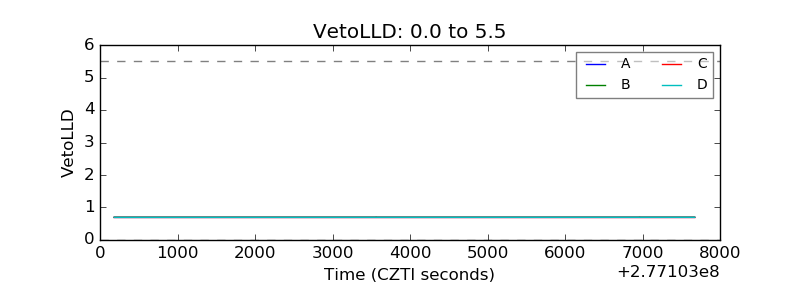 |
| Alpha Counter | 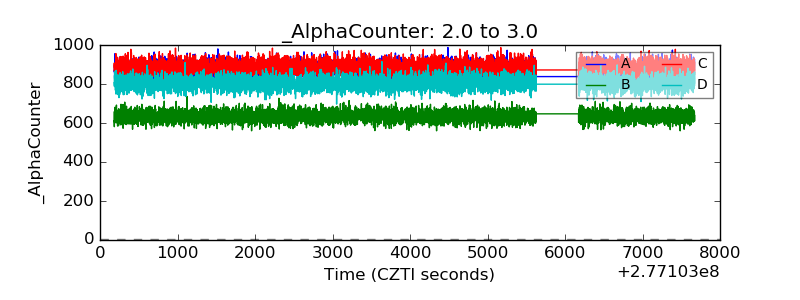 |
| _CPM_Rate | 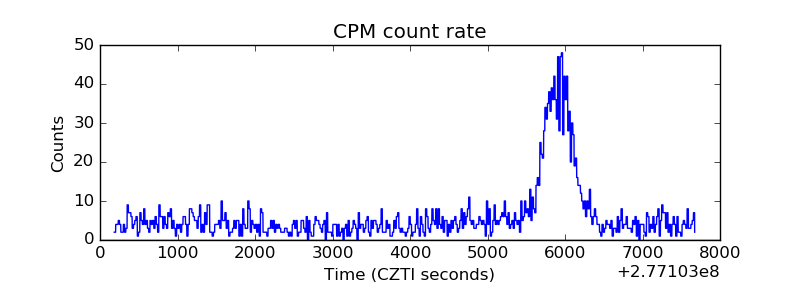 |
| CZT Counter | 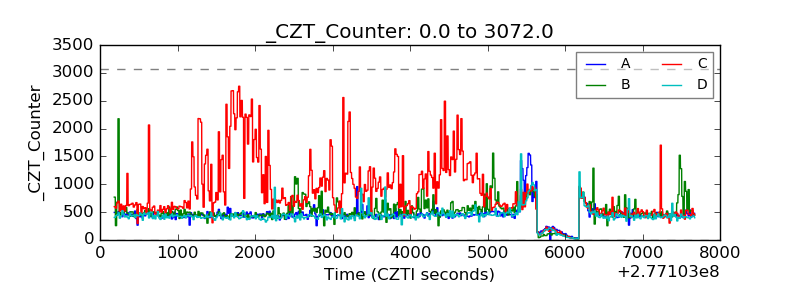 |
| +2.5 Volts monitor |  |
| +5 Volts monitor |  |
| _ROLL_ROT | 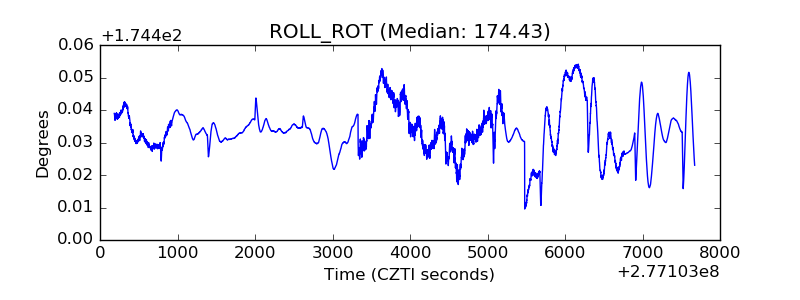 |
| _Roll_DEC |  |
| _Roll_RA | 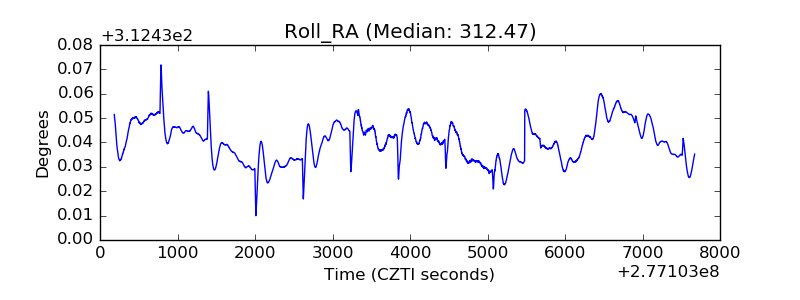 |
| Veto Counter | 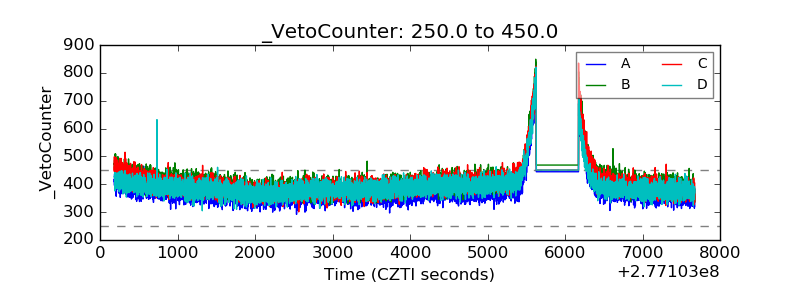 |