| Param | Original file | Final file |
|---|---|---|
| Filename | modeM0/AS1A05_069T04_9000002428_16447cztM0_level2.evt | modeM0/AS1A05_069T04_9000002428_16447cztM0_level2_quad_clean.evt |
| Size (bytes) | 458,337,600 | 84,127,680 |
| Size | 437.1 MB | 80.2 MB |
| Events in quadrant A | 2,903,712 | 543,974 |
| Events in quadrant B | 3,359,075 | 557,278 |
| Events in quadrant C | 4,458,624 | 500,597 |
| Events in quadrant D | 2,748,504 | 523,481 |
| Mode M0 | |||
|---|---|---|---|
| Quadrant | BADHDUFLAG | Total packets | Discarded packets |
| A | 0 | 12702 | 1 |
| B | 0 | 13845 | 1 |
| C | 0 | 17221 | 1 |
| D | 0 | 12477 | 1 |
| Mode SS | |||
|---|---|---|---|
| Quadrant | BADHDUFLAG | Total packets | Discarded packets |
| A | 0 | 124 | 0 |
| B | 0 | 124 | 0 |
| C | 0 | 124 | 0 |
| D | 0 | 124 | 0 |
| Mode M9 | |||
|---|---|---|---|
| Quadrant | BADHDUFLAG | Total packets | Discarded packets |
| A | 0 | 5 | 0 |
| B | 0 | 5 | 0 |
| C | 0 | 5 | 0 |
| D | 0 | 5 | 0 |
| Quadrant | Total seconds | Saturated seconds | Saturation percentage |
|---|---|---|---|
| A | 6037 | 170 | 2.815968% |
| B | 6037 | 197 | 3.263210% |
| C | 6037 | 694 | 11.495776% |
| D | 6037 | 96 | 1.590194% |
Noise dominated data is calculated using 1-second bins in cleaned event files. If a bin has >2000 counts, and if more than 50% of those come from <1% of pixels, then it is considered to be noise-dominated and hence unusable.
| Quadrant | # 1 sec bins | Bins with >0 counts | Bins with >2000 counts | High rate bins dominated by noise | Noise dominated (total time) | Noise dominated (detector-on time) | Marked lightcurve |
|---|---|---|---|---|---|---|---|
| A | 6583 | 6038 | 7 | 7 | 0.11% | 0.12% | 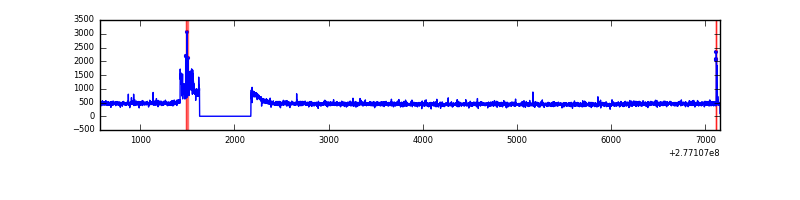 |
| B | 6583 | 6038 | 11 | 11 | 0.17% | 0.18% | 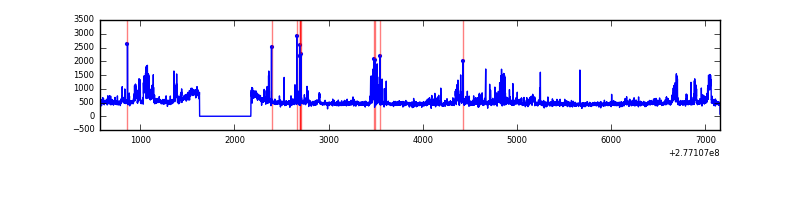 |
| C | 6583 | 6038 | 318 | 318 | 4.83% | 5.27% | 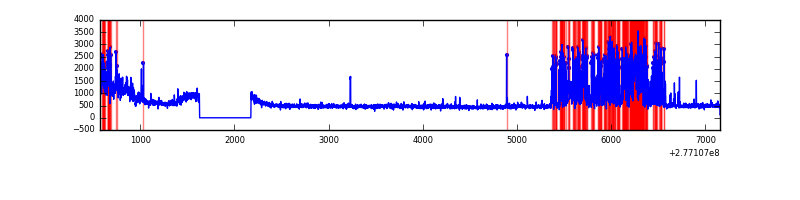 |
| D | 6583 | 6038 | 0 | 0 | 0.00% | 0.00% | 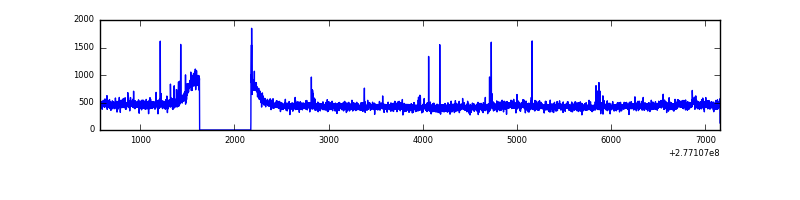 |
Top three noisy pixels from each quadrant. If the there are fewer than three noisy pixels in the level2.evt file, extra rows are filled as -1
| Pixel properties | Quadrant properties | ||||||
|---|---|---|---|---|---|---|---|
| Quadrant | DetID | PixID | Counts | Sigma | Mean | Median | Sigma |
| A | 15 | 174 | 111626 | 752.69 | 724 | 706 | 147.4 |
| A | 0 | 226 | 6391 | 38.58 | 724 | 706 | 147.4 |
| A | 12 | 194 | 5433 | 32.08 | 724 | 706 | 147.4 |
| B | 15 | 35 | 251889 | 1778.82 | 729 | 711 | 141.2 |
| B | 4 | 173 | 98681 | 693.82 | 729 | 711 | 141.2 |
| B | 3 | 209 | 48560 | 338.86 | 729 | 711 | 141.2 |
| C | 4 | 254 | 1261057 | 7801.53 | 678 | 680 | 161.6 |
| C | 3 | 233 | 435296 | 2690.2 | 678 | 680 | 161.6 |
| C | 14 | 238 | 103558 | 636.8 | 678 | 680 | 161.6 |
| D | 2 | 234 | 23299 | 130.69 | 711 | 690 | 173.0 |
| D | 6 | 18 | 20410 | 113.99 | 711 | 690 | 173.0 |
| D | 1 | 52 | 14418 | 79.36 | 711 | 690 | 173.0 |
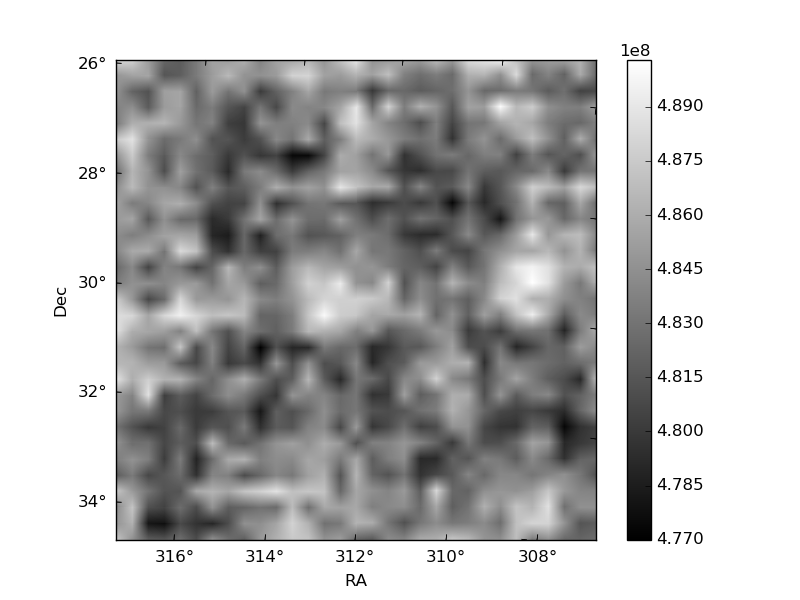
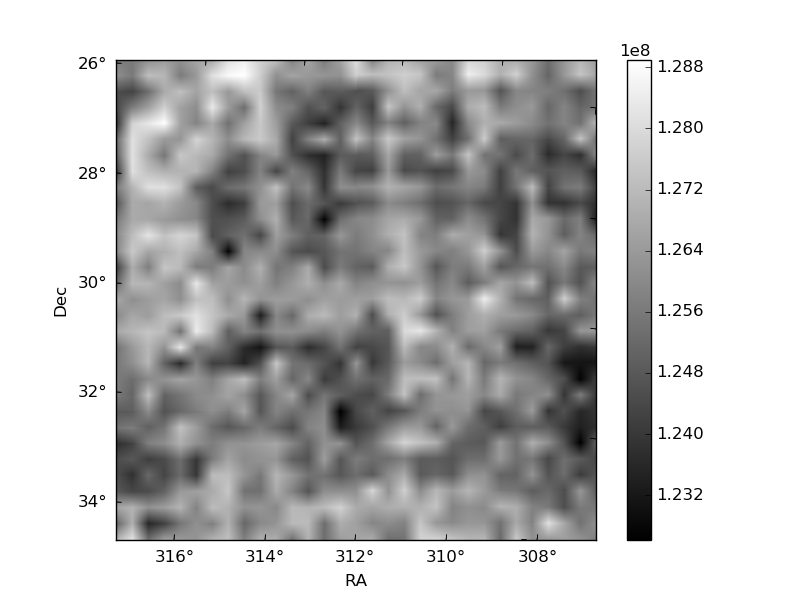
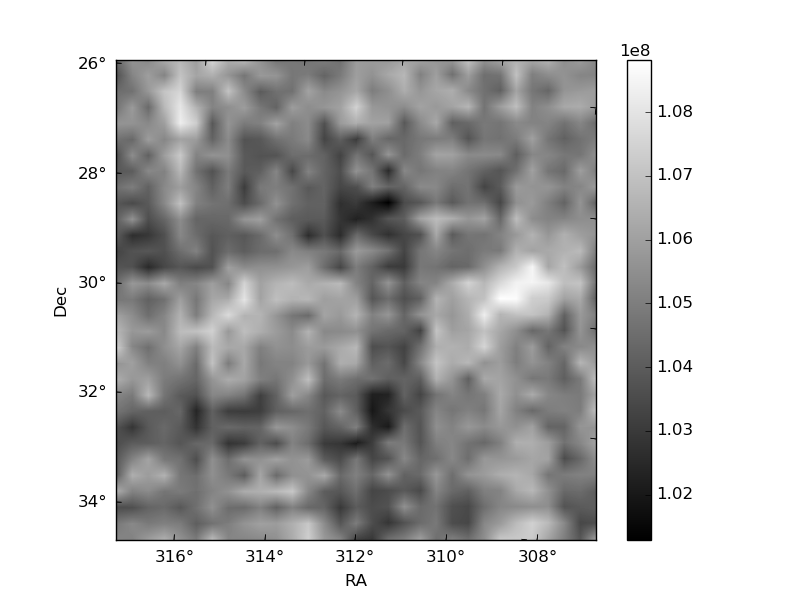
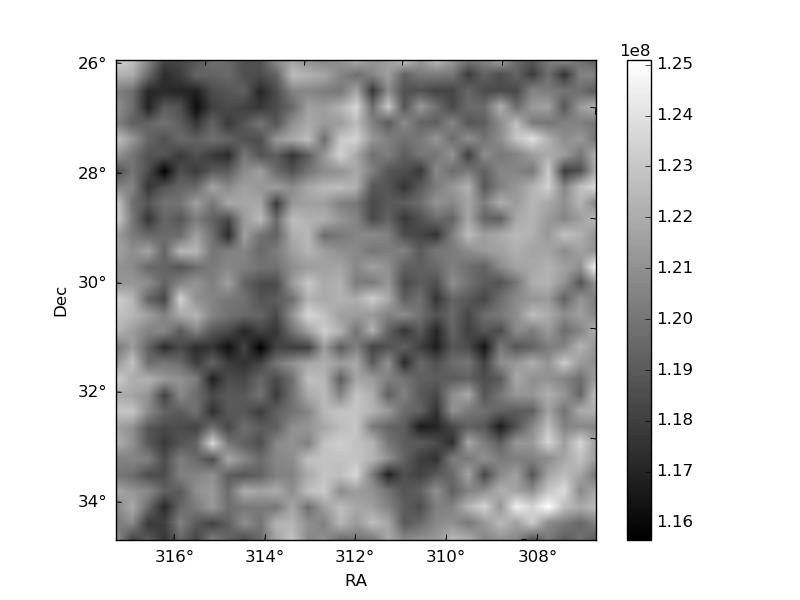
Histogram calculated using DETX and DETY for each event in the final _common_clean file
| Quadrant A | 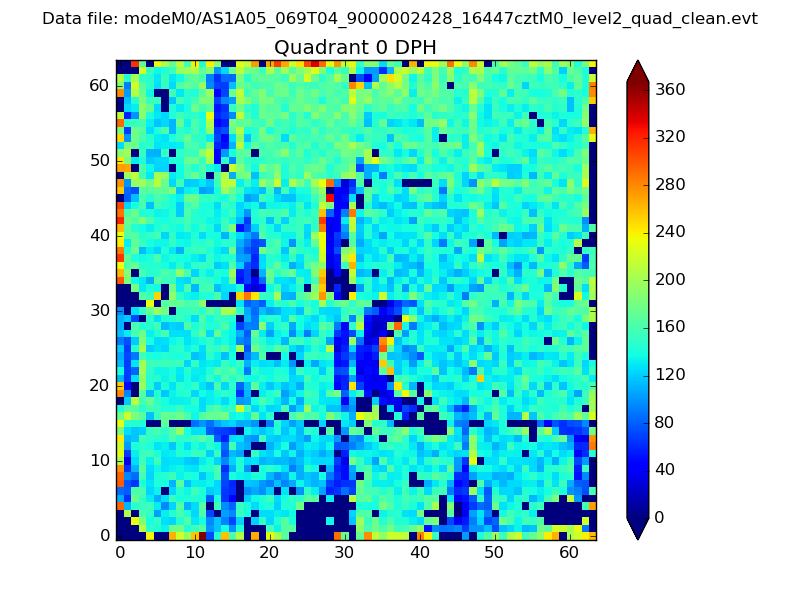 |
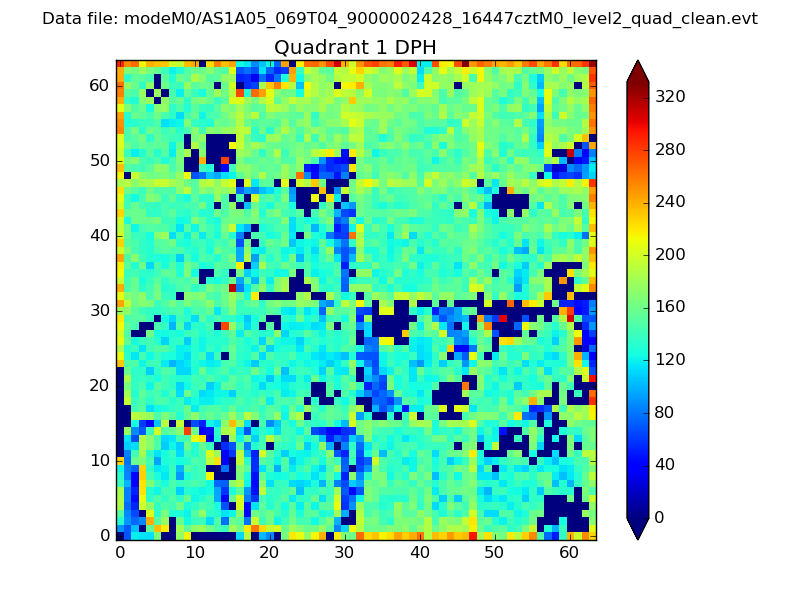 |
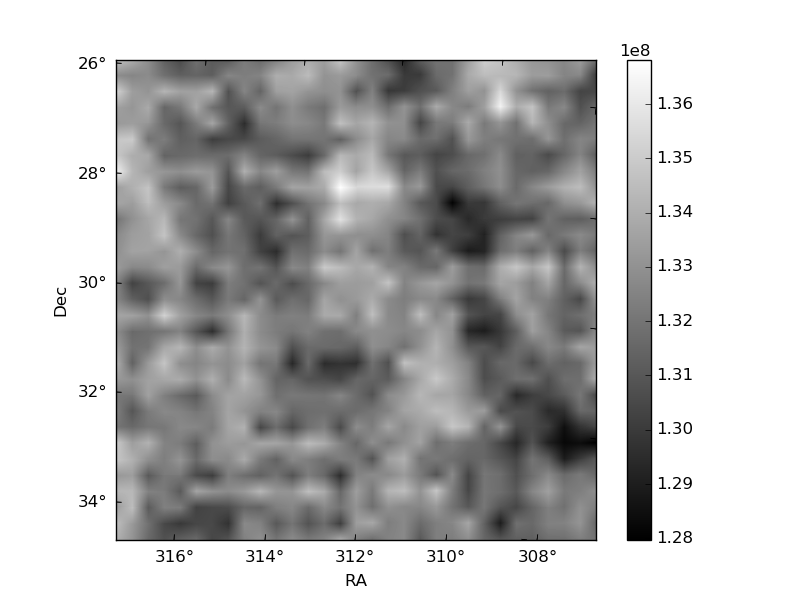
Quadrant B |
|---|---|---|---|
| Quadrant D | 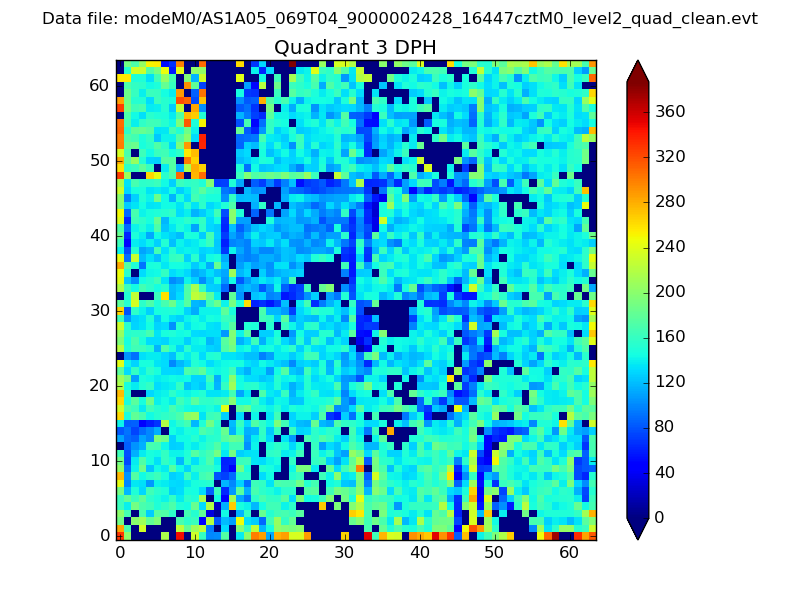 |
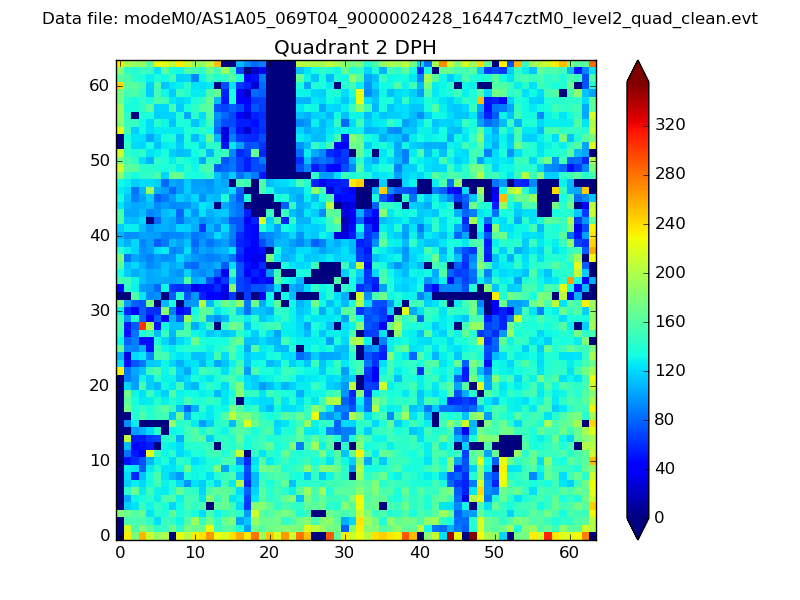 |
Quadrant C |
| Plot type | Count rate plots | Images |
|---|---|---|
| Comparison with Poisson distribution Blue bars denote a histogram of data divided into 1 sec bins. Red curve is a Poisson curve with rate = median count rate of data. |
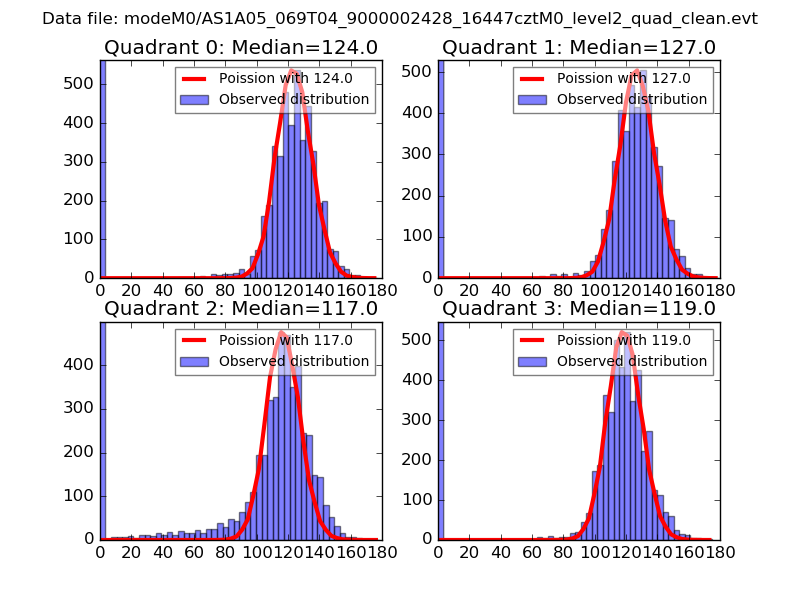 |
 |
| Quadrant-wise count rates Data is divided into 100 sec bins |
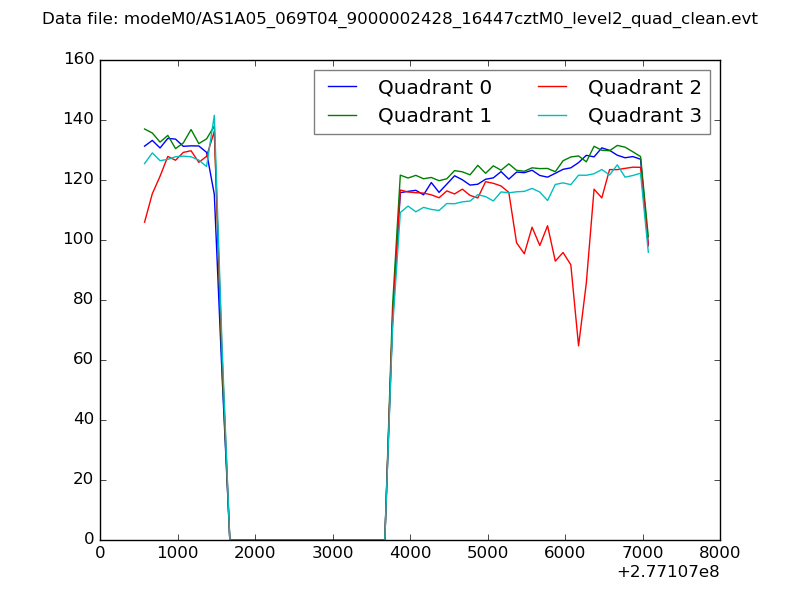 |
|
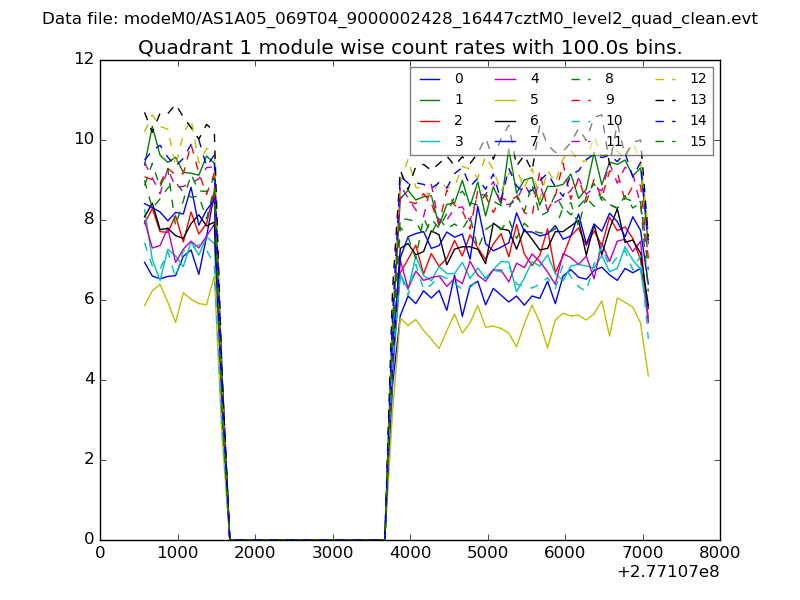
| Module-wise count rates for Quadrant A Data is divided into 100 sec bins |
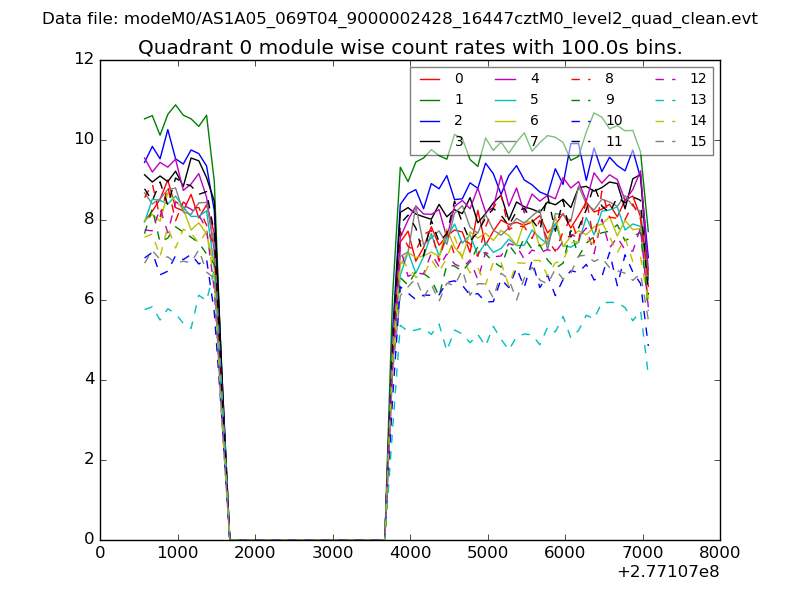 |
 |
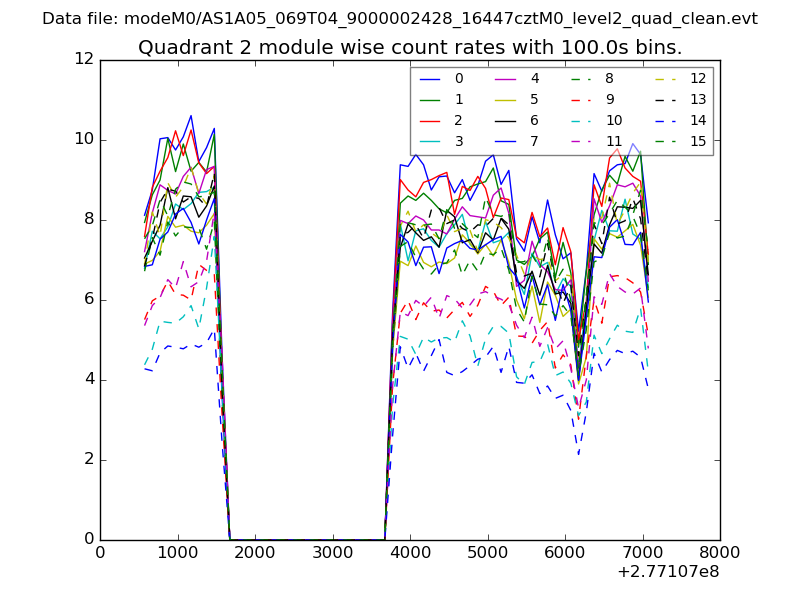
| Module-wise count rates for Quadrant B Data is divided into 100 sec bins |
 |
 |
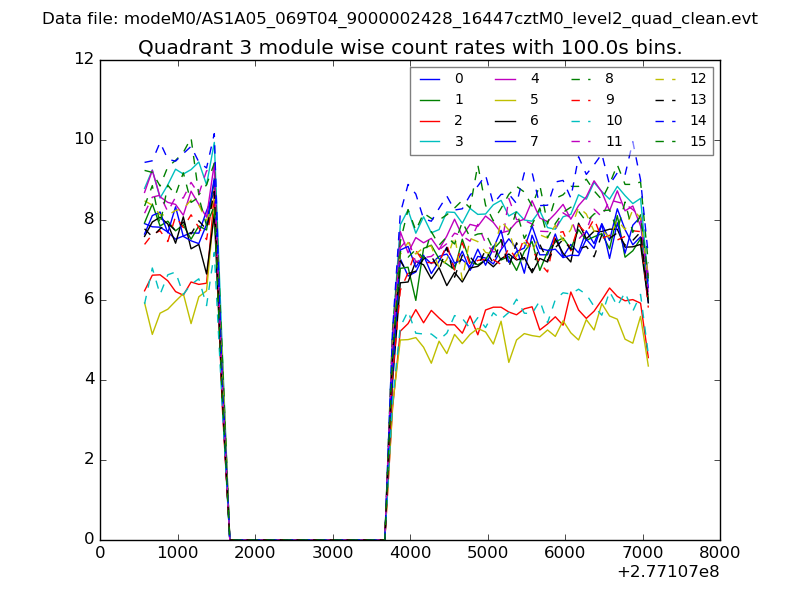
| Module-wise count rates for Quadrant C Data is divided into 100 sec bins |
 |
 |
| Module-wise count rates for Quadrant D Data is divided into 100 sec bins |
 |
 |
| Parameter | Plot |
|---|---|
| CZT HV Monitor | 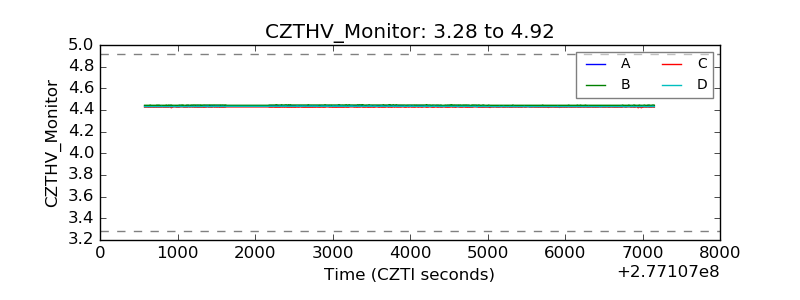 |
| D_VDD | 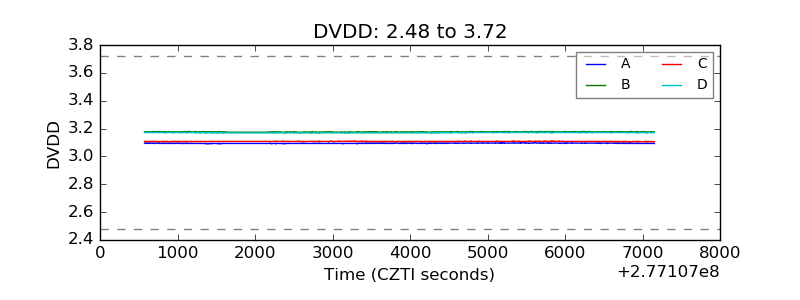 |
| Temperature 1 |  |
| Veto HV Monitor | 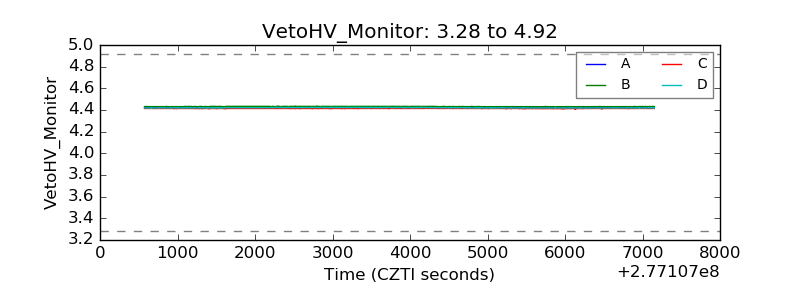 |
| Veto LLD | 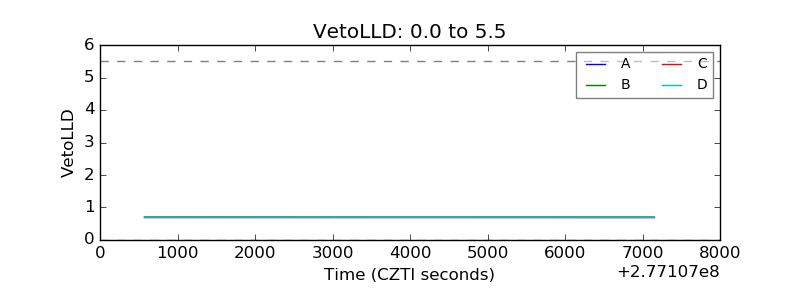 |
| Alpha Counter | 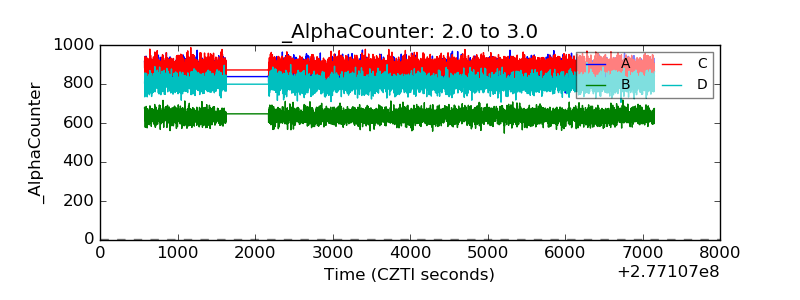 |
| _CPM_Rate | 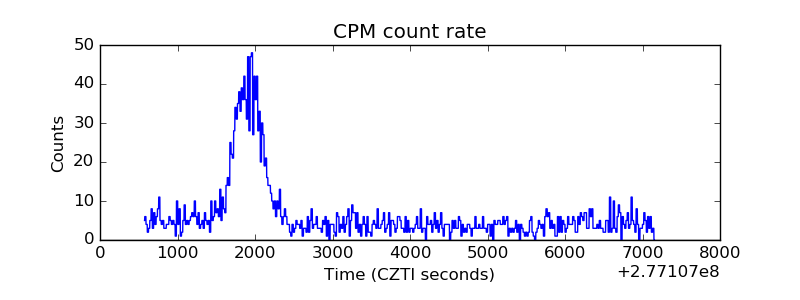 |
| CZT Counter | 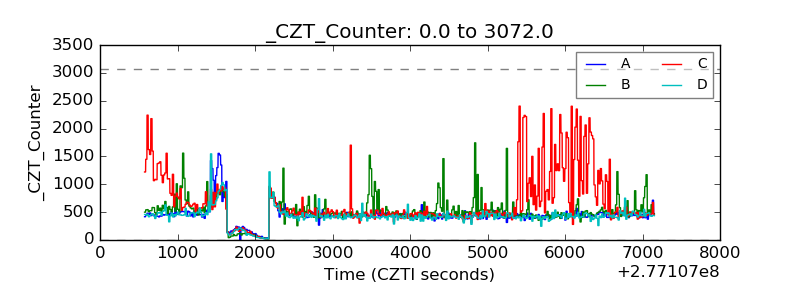 |
| +2.5 Volts monitor |  |
| +5 Volts monitor |  |
| _ROLL_ROT | 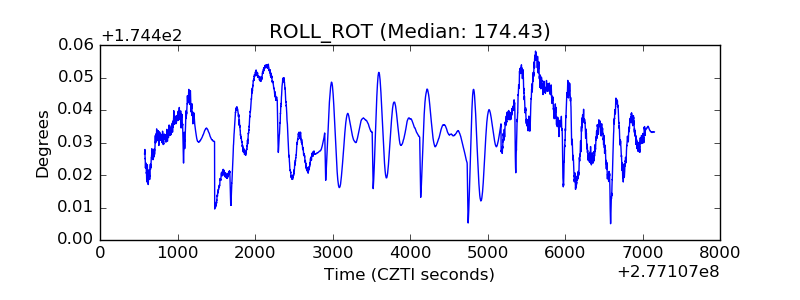 |
| _Roll_DEC |  |
| _Roll_RA | 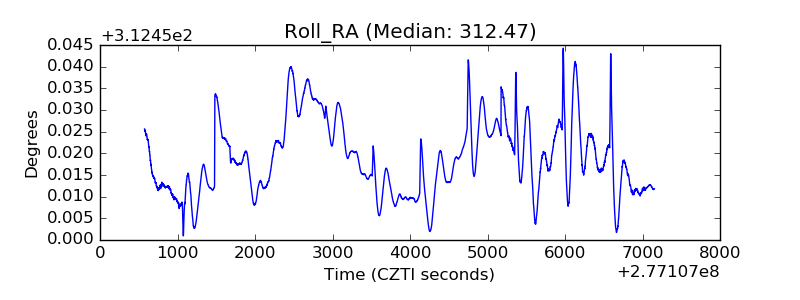 |
| Veto Counter | 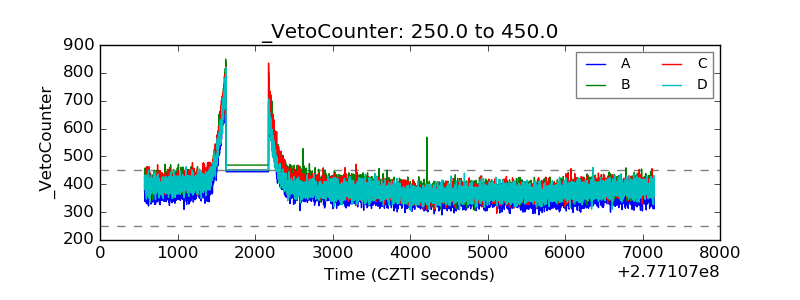 |