| Param | Original file | Final file |
|---|---|---|
| Filename | modeM0/AS1C04_007T04_9000002430cztM0_level2.fits | modeM0/AS1C04_007T04_9000002430cztM0_level2_quad_clean.evt |
| Size (bytes) | 714,306,240 | 668,208,960 |
| Size | 681.2 MB | 637.3 MB |
| Events in quadrant A | 4,375,054 | 3,909,065 |
| Events in quadrant B | 4,189,752 | 3,968,332 |
| Events in quadrant C | 4,304,602 | 3,867,628 |
| Events in quadrant D | 3,649,730 | 3,379,565 |
| Mode M9 | |||
|---|---|---|---|
| Quadrant | BADHDUFLAG | Total packets | Discarded packets |
| A | 0 | 117 | 0 |
| B | 0 | 117 | 0 |
| C | 0 | 117 | 0 |
| D | 0 | 117 | 0 |
| Mode M0 | |||
|---|---|---|---|
| Quadrant | BADHDUFLAG | Total packets | Discarded packets |
| A | 0 | 158177 | 0 |
| B | 0 | 171746 | 0 |
| C | 0 | 156859 | 0 |
| D | 0 | 189741 | 0 |
| Mode SS | |||
|---|---|---|---|
| Quadrant | BADHDUFLAG | Total packets | Discarded packets |
| A | 0 | 1522 | 0 |
| B | 0 | 1522 | 0 |
| C | 0 | 1522 | 0 |
| D | 0 | 1522 | 0 |
| Quadrant | Total seconds | Saturated seconds | Saturation percentage |
|---|---|---|---|
| A | 74556 | 1118 | 1.499544% |
| B | 74556 | 1662 | 2.229197% |
| C | 74556 | 1391 | 1.865712% |
| D | 74556 | 3822 | 5.126348% |
Noise dominated data is calculated using 1-second bins in cleaned event files. If a bin has >2000 counts, and if more than 50% of those come from <1% of pixels, then it is considered to be noise-dominated and hence unusable.
| Quadrant | # 1 sec bins | Bins with >0 counts | Bins with >2000 counts | High rate bins dominated by noise | Noise dominated (total time) | Noise dominated (detector-on time) | Marked lightcurve |
|---|---|---|---|---|---|---|---|
| A | 86256 | 74540 | 0 | 0 | 0.00% | 0.00% |  |
| B | 86256 | 74543 | 0 | 0 | 0.00% | 0.00% | 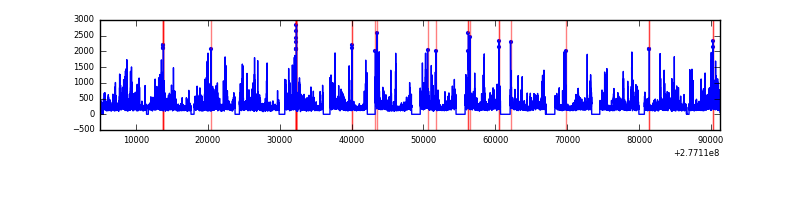 |
| C | 86256 | 74547 | 0 | 0 | 0.00% | 0.00% |  |
| D | 86256 | 74469 | 0 | 0 | 0.00% | 0.00% |  |
Top three noisy pixels from each quadrant. If the there are fewer than three noisy pixels in the level2.evt file, extra rows are filled as -1
| Pixel properties | Quadrant properties | ||||||
|---|---|---|---|---|---|---|---|
| Quadrant | DetID | PixID | Counts | Sigma | Mean | Median | Sigma |
| A | 0 | 29 | 4113 | 10.73 | 1137 | 1066 | 283.9 |
| A | 7 | 110 | 3596 | 8.91 | 1137 | 1066 | 283.9 |
| A | 0 | 30 | 3293 | 7.84 | 1137 | 1066 | 283.9 |
| B | 2 | 9 | 3477 | 11.11 | 1109 | 1058 | 217.7 |
| B | 2 | 8 | 2998 | 8.91 | 1109 | 1058 | 217.7 |
| B | 5 | 128 | 2776 | 7.89 | 1109 | 1058 | 217.7 |
| C | 12 | 241 | 3023 | 6.71 | 1135 | 1057 | 293.1 |
| C | 3 | 126 | 2964 | 6.51 | 1135 | 1057 | 293.1 |
| C | 2 | 191 | 2892 | 6.26 | 1135 | 1057 | 293.1 |
| D | 3 | 14 | 2655 | 6.11 | 1041 | 947 | 279.7 |
| D | 6 | 231 | 2640 | 6.05 | 1041 | 947 | 279.7 |
| D | 1 | 3 | 2557 | 5.76 | 1041 | 947 | 279.7 |
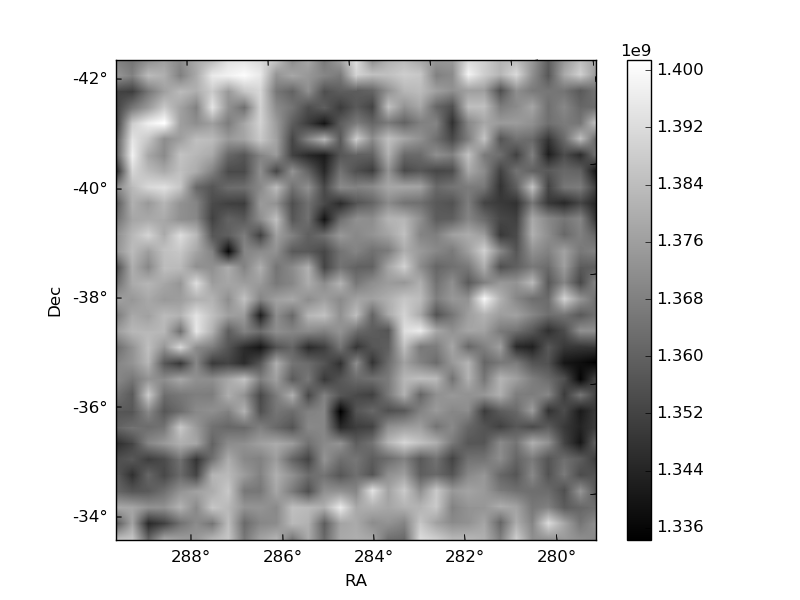
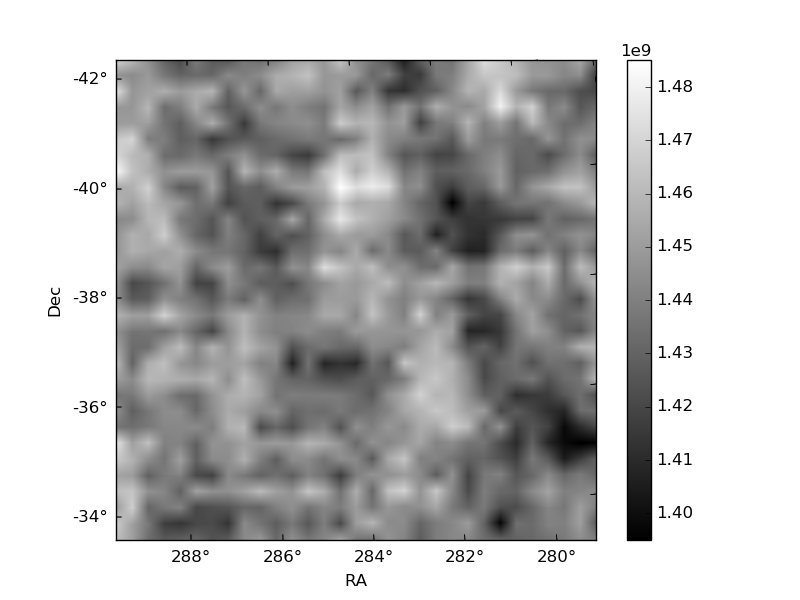
Histogram calculated using DETX and DETY for each event in the final _common_clean file
| Quadrant A | 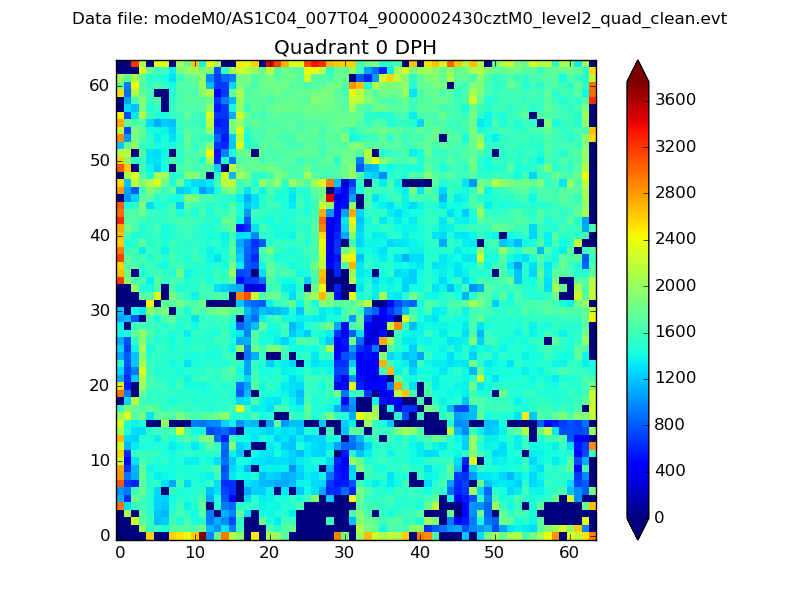 |
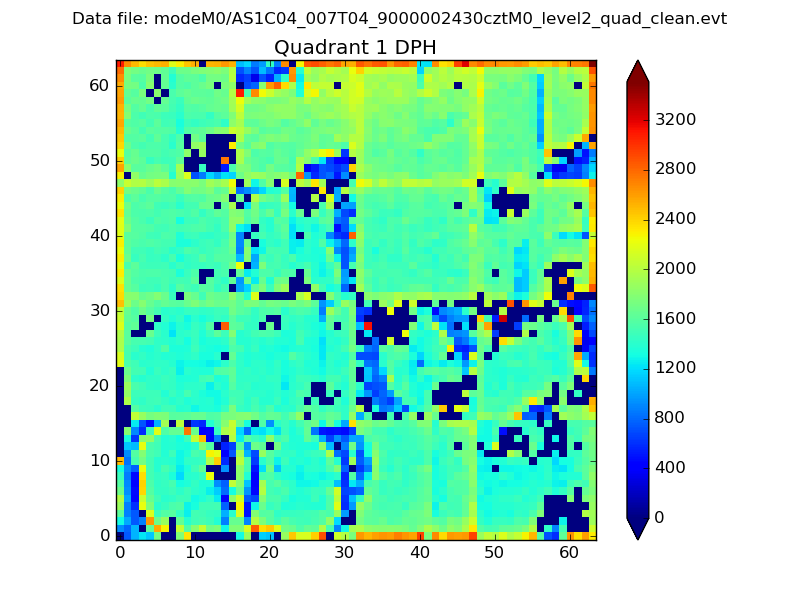 |
Quadrant B |
|---|---|---|---|
| Quadrant D | 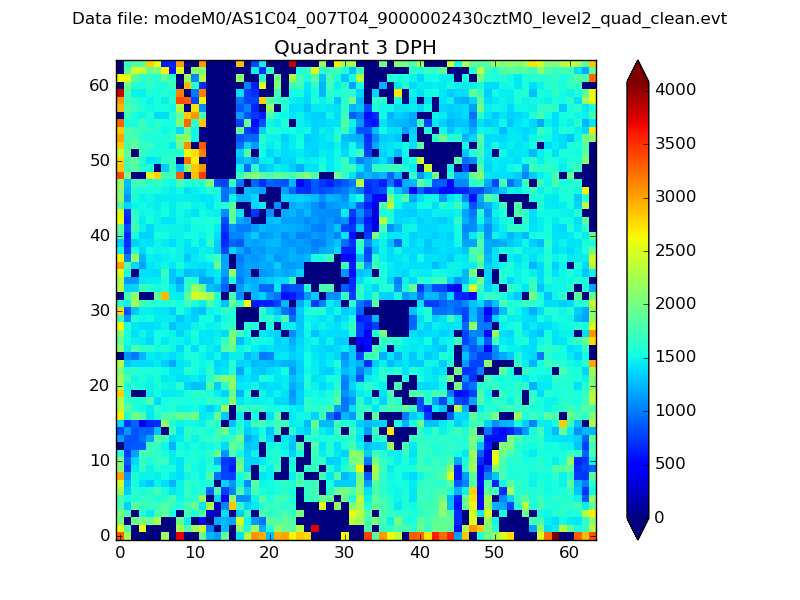 |
 |
Quadrant C |
| Plot type | Count rate plots | Images |
|---|---|---|
| Comparison with Poisson distribution Blue bars denote a histogram of data divided into 1 sec bins. Red curve is a Poisson curve with rate = median count rate of data. |
 |
 |
| Quadrant-wise count rates Data is divided into 100 sec bins |
 |
|
| Module-wise count rates for Quadrant A Data is divided into 100 sec bins |
 |
 |
| Module-wise count rates for Quadrant B Data is divided into 100 sec bins |
 |
 |
| Module-wise count rates for Quadrant C Data is divided into 100 sec bins |
 |
 |
| Module-wise count rates for Quadrant D Data is divided into 100 sec bins |
 |
 |
| Parameter | Plot |
|---|---|
| CZT HV Monitor | 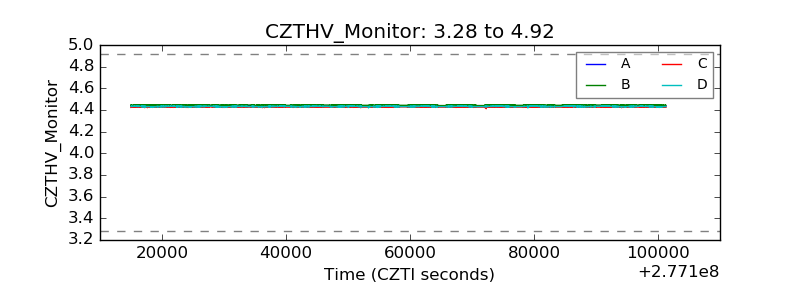 |
| D_VDD |  |
| Temperature 1 |  |
| Veto HV Monitor |  |
| Veto LLD |  |
| Alpha Counter |  |
| _CPM_Rate |  |
| CZT Counter |  |
| +2.5 Volts monitor | 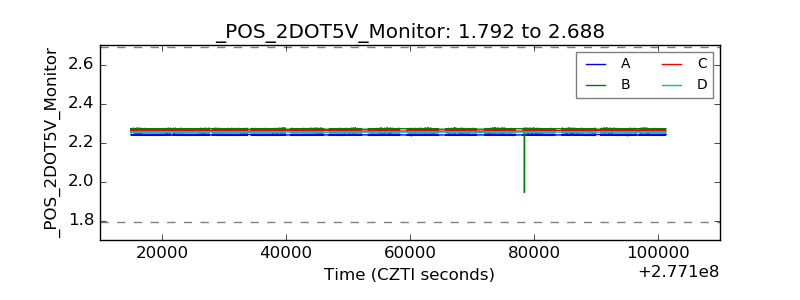 |
| +5 Volts monitor |  |
| _ROLL_ROT |  |
| _Roll_DEC |  |
| _Roll_RA | 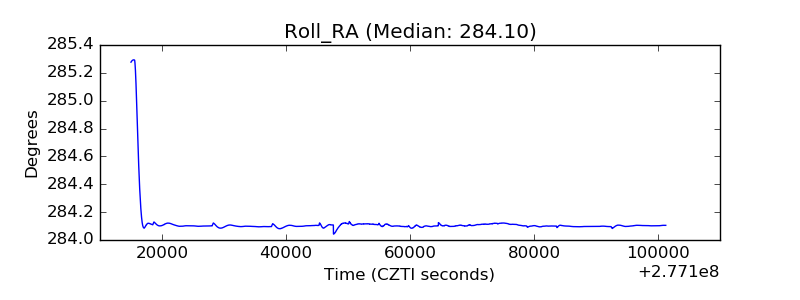 |
| Veto Counter |  |