| Param | Original file | Final file |
|---|---|---|
| Filename | modeM0/AS1C04_007T04_9000002430_16447cztM0_level2.evt | modeM0/AS1C04_007T04_9000002430_16447cztM0_level2_quad_clean.evt |
| Size (bytes) | 131,500,800 | 17,118,720 |
| Size | 125.4 MB | 16.3 MB |
| Events in quadrant A | 935,503 | 95,845 |
| Events in quadrant B | 1,028,389 | 100,326 |
| Events in quadrant C | 973,962 | 96,753 |
| Events in quadrant D | 919,934 | 93,620 |
| Mode M9 | |||
|---|---|---|---|
| Quadrant | BADHDUFLAG | Total packets | Discarded packets |
| A | 0 | 2 | 0 |
| B | 0 | 2 | 0 |
| C | 0 | 2 | 0 |
| D | 0 | 2 | 0 |
| Mode M0 | |||
|---|---|---|---|
| Quadrant | BADHDUFLAG | Total packets | Discarded packets |
| A | 0 | 3915 | 3 |
| B | 0 | 4247 | 2 |
| C | 0 | 3975 | 2 |
| D | 0 | 3905 | 2 |
| Mode SS | |||
|---|---|---|---|
| Quadrant | BADHDUFLAG | Total packets | Discarded packets |
| A | 0 | 38 | 0 |
| B | 0 | 38 | 0 |
| C | 0 | 38 | 0 |
| D | 0 | 38 | 0 |
| Quadrant | Total seconds | Saturated seconds | Saturation percentage |
|---|---|---|---|
| A | 1790 | 172 | 9.608939% |
| B | 1790 | 185 | 10.335196% |
| C | 1790 | 192 | 10.726257% |
| D | 1790 | 141 | 7.877095% |
Noise dominated data is calculated using 1-second bins in cleaned event files. If a bin has >2000 counts, and if more than 50% of those come from <1% of pixels, then it is considered to be noise-dominated and hence unusable.
| Quadrant | # 1 sec bins | Bins with >0 counts | Bins with >2000 counts | High rate bins dominated by noise | Noise dominated (total time) | Noise dominated (detector-on time) | Marked lightcurve |
|---|---|---|---|---|---|---|---|
| A | 2011 | 1792 | 0 | 0 | 0.00% | 0.00% | 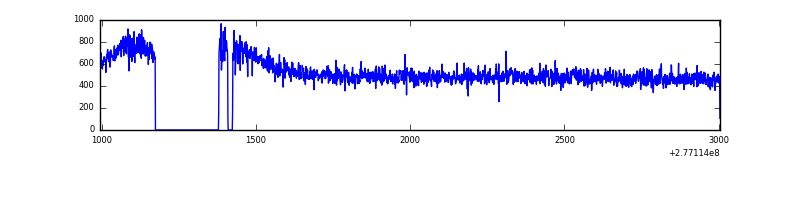 |
| B | 2011 | 1792 | 0 | 0 | 0.00% | 0.00% | 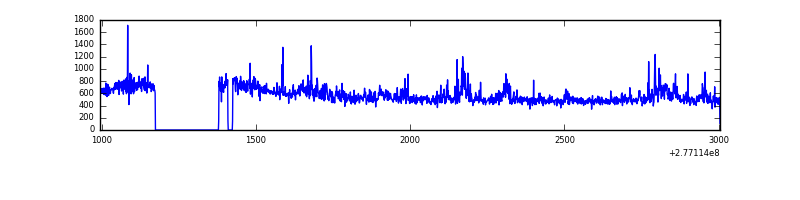 |
| C | 2011 | 1792 | 0 | 0 | 0.00% | 0.00% |  |
| D | 2011 | 1792 | 0 | 0 | 0.00% | 0.00% | 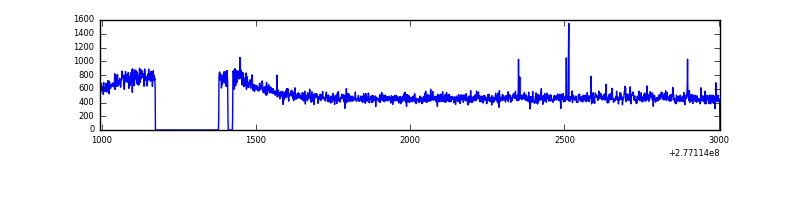 |
Top three noisy pixels from each quadrant. If the there are fewer than three noisy pixels in the level2.evt file, extra rows are filled as -1
| Pixel properties | Quadrant properties | ||||||
|---|---|---|---|---|---|---|---|
| Quadrant | DetID | PixID | Counts | Sigma | Mean | Median | Sigma |
| A | 0 | 226 | 2070 | 35.5 | 242 | 235 | 51.7 |
| A | 3 | 1 | 1957 | 33.32 | 242 | 235 | 51.7 |
| A | 3 | 137 | 1879 | 31.81 | 242 | 235 | 51.7 |
| B | 15 | 35 | 43928 | 885.62 | 240 | 233 | 49.3 |
| B | 4 | 173 | 23900 | 479.69 | 240 | 233 | 49.3 |
| B | 0 | 189 | 9068 | 179.07 | 240 | 233 | 49.3 |
| C | 14 | 238 | 34666 | 611.09 | 234 | 233 | 56.3 |
| C | 3 | 233 | 24158 | 424.6 | 234 | 233 | 56.3 |
| C | 13 | 61 | 1638 | 24.93 | 234 | 233 | 56.3 |
| D | 1 | 52 | 5870 | 92.15 | 240 | 230 | 61.2 |
| D | 2 | 234 | 5776 | 90.61 | 240 | 230 | 61.2 |
| D | 13 | 104 | 5237 | 81.81 | 240 | 230 | 61.2 |
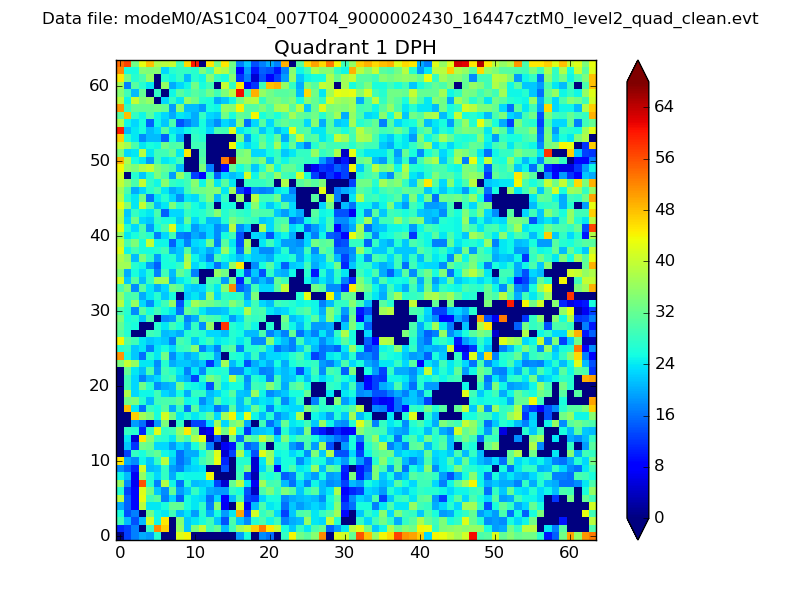
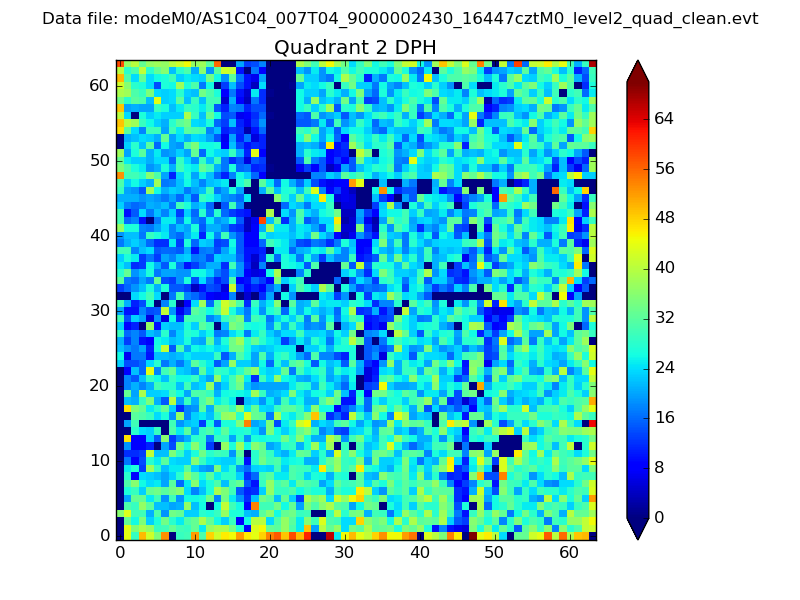
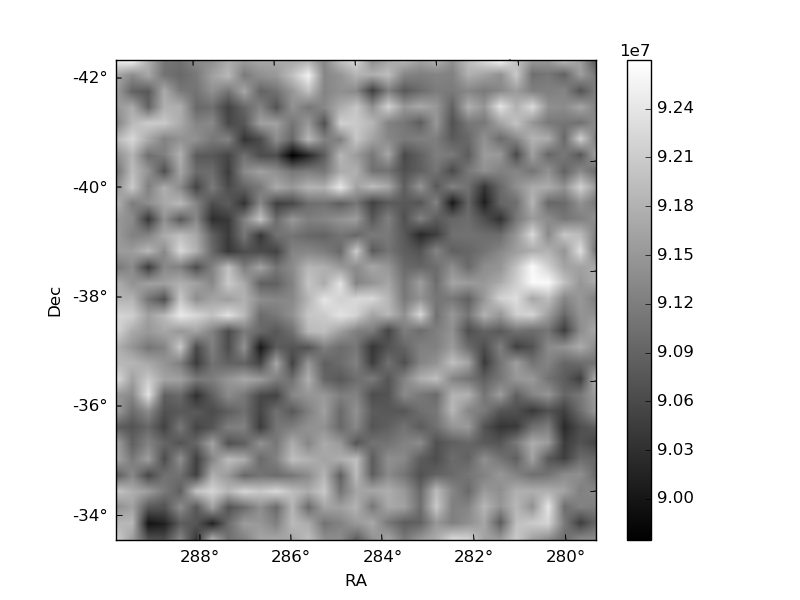
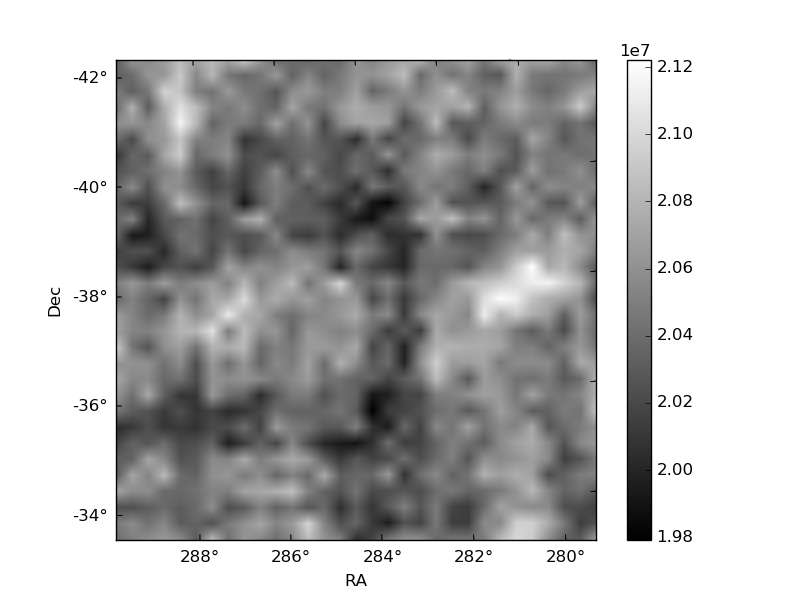
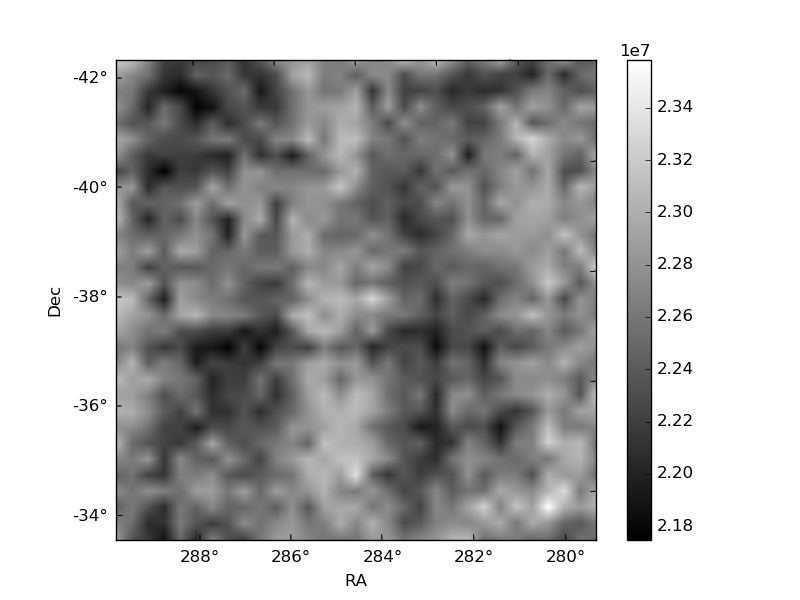
Histogram calculated using DETX and DETY for each event in the final _common_clean file
| Quadrant A | 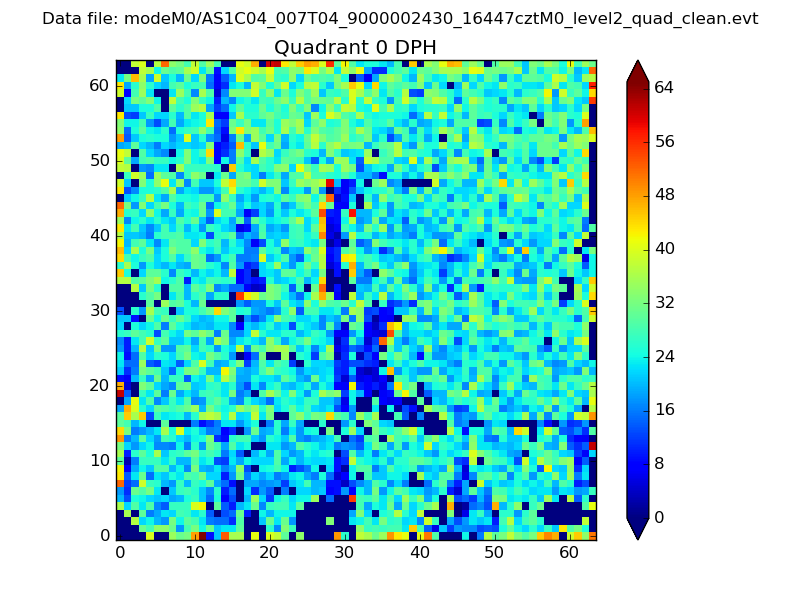 |
 |
Quadrant B |
|---|---|---|---|
| Quadrant D | 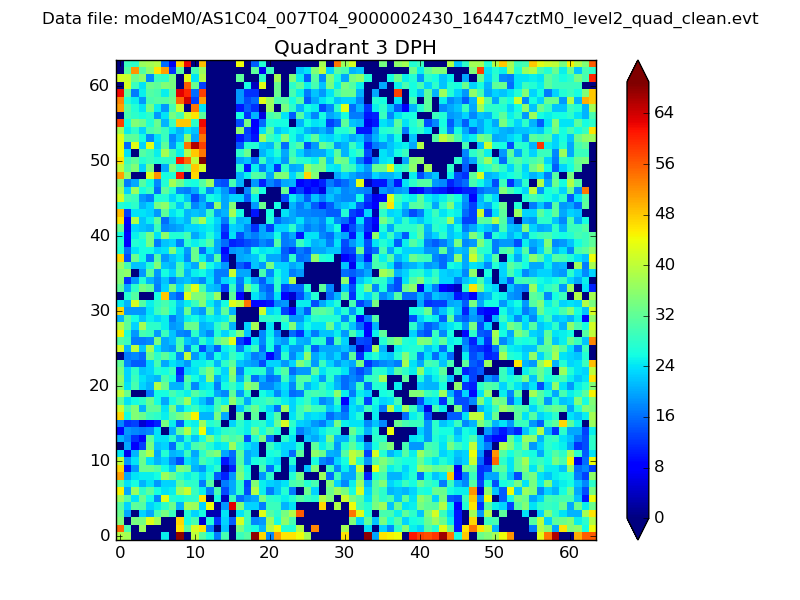 |
 |
Quadrant C |
| Plot type | Count rate plots | Images |
|---|---|---|
| Comparison with Poisson distribution Blue bars denote a histogram of data divided into 1 sec bins. Red curve is a Poisson curve with rate = median count rate of data. |
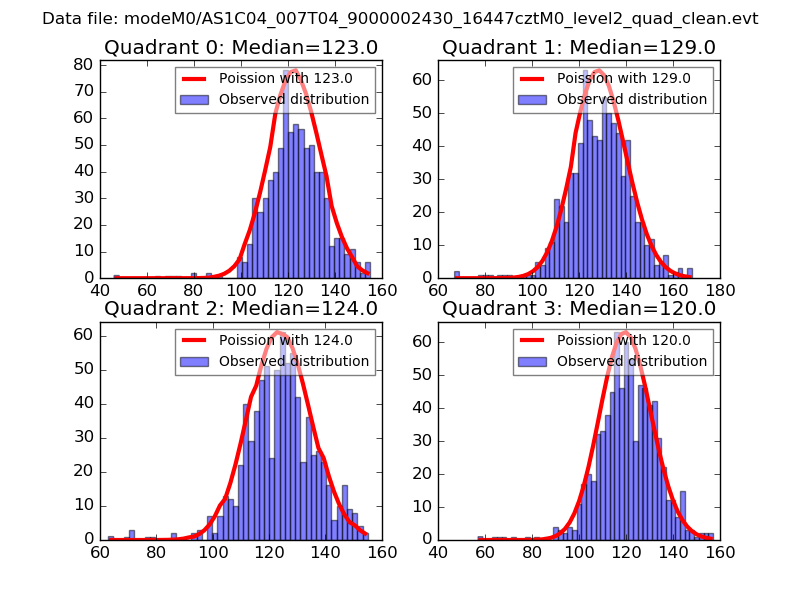 |
 |
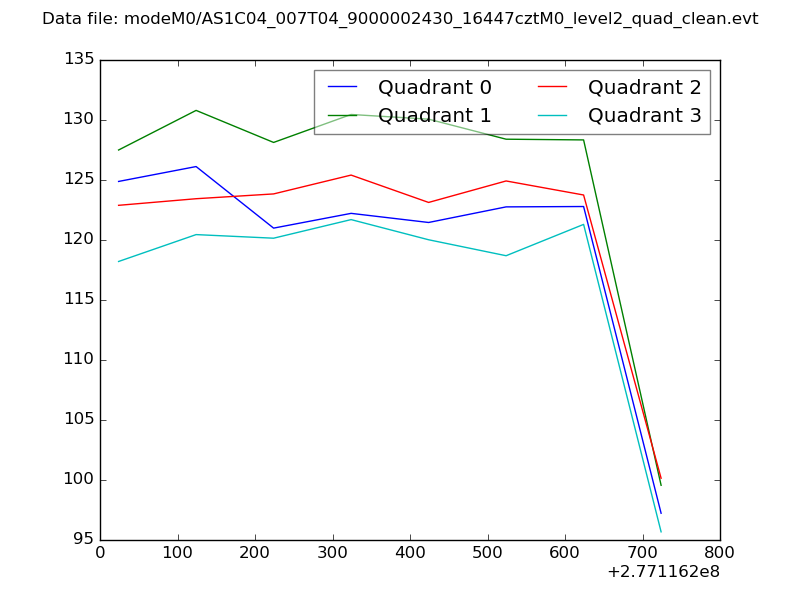
| Quadrant-wise count rates Data is divided into 100 sec bins |
 |
|
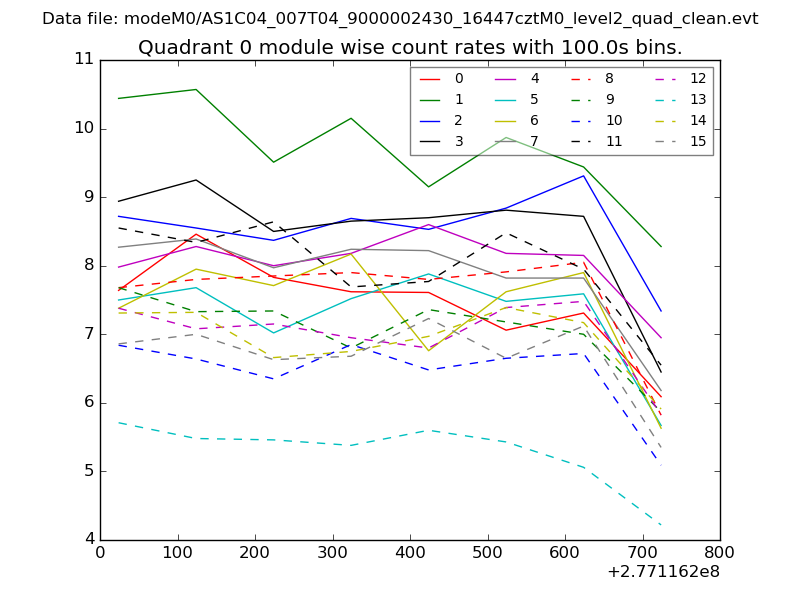
| Module-wise count rates for Quadrant A Data is divided into 100 sec bins |
 |
 |
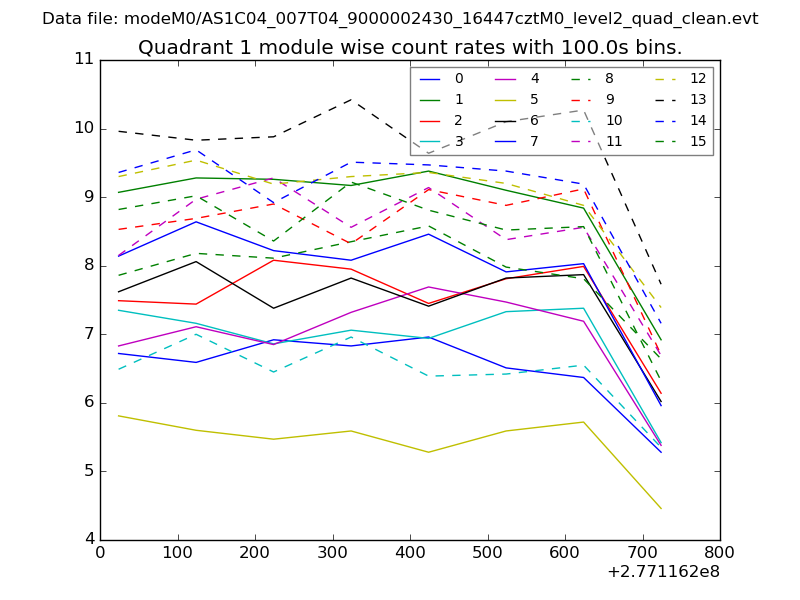
| Module-wise count rates for Quadrant B Data is divided into 100 sec bins |
 |
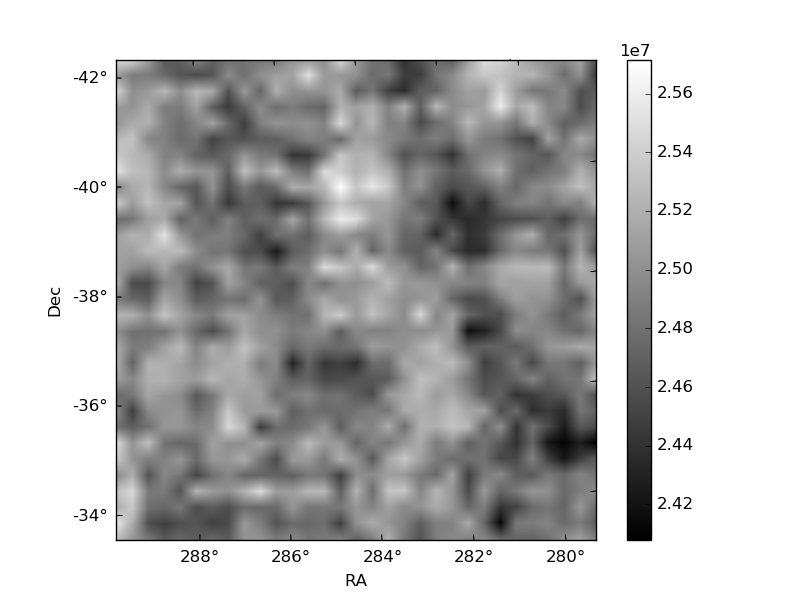 |
| Module-wise count rates for Quadrant C Data is divided into 100 sec bins |
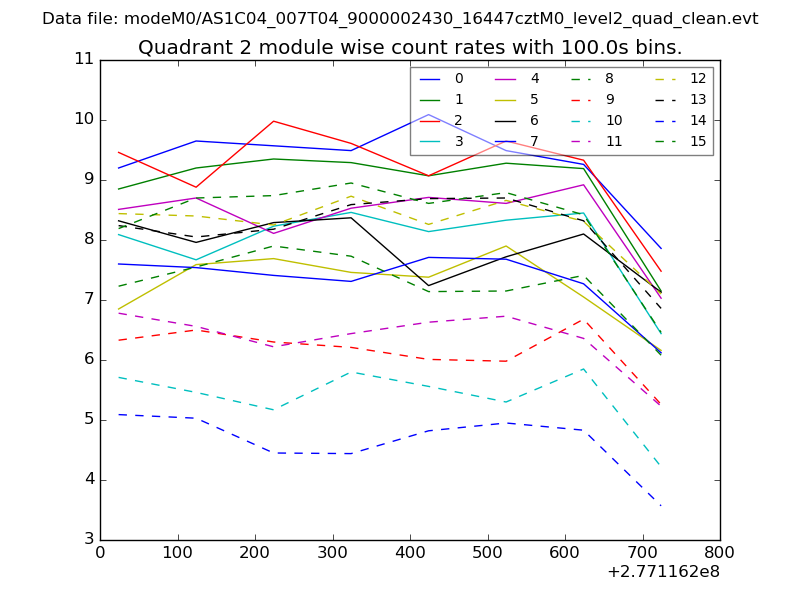 |
 |
| Module-wise count rates for Quadrant D Data is divided into 100 sec bins |
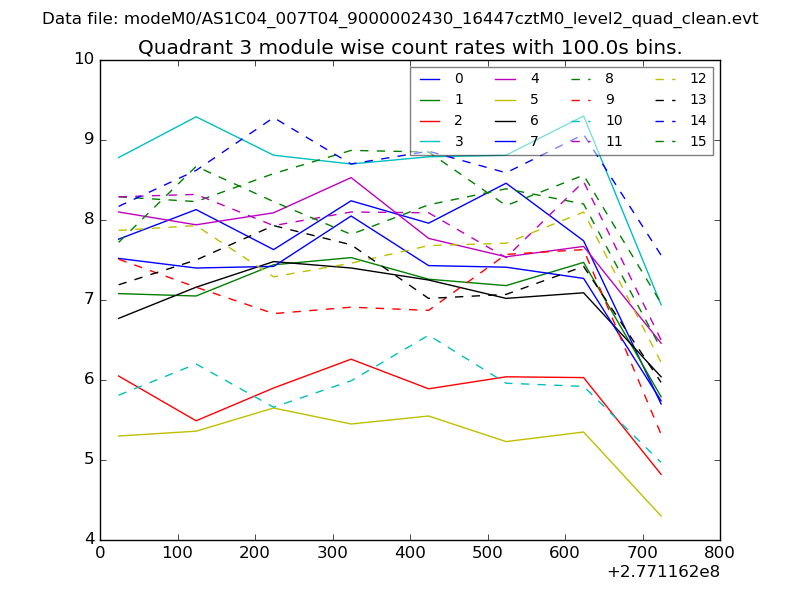 |
 |
| Parameter | Plot |
|---|---|
| CZT HV Monitor | 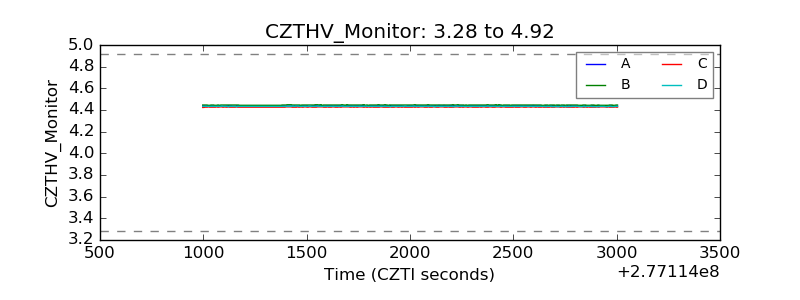 |
| D_VDD | 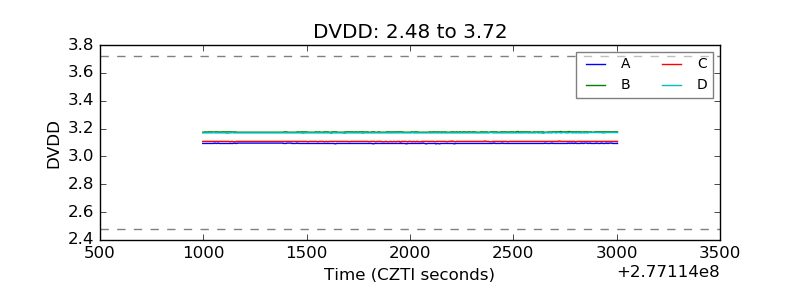 |
| Temperature 1 |  |
| Veto HV Monitor |  |
| Veto LLD | 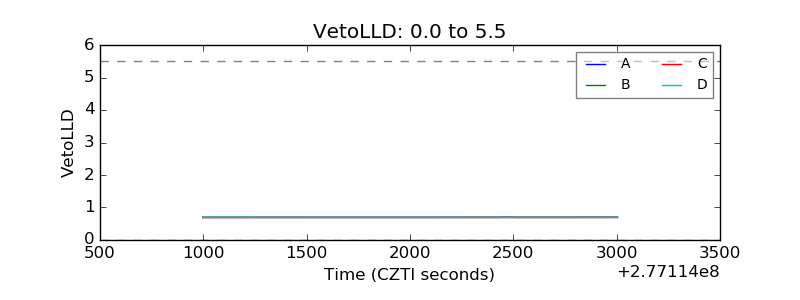 |
| Alpha Counter | 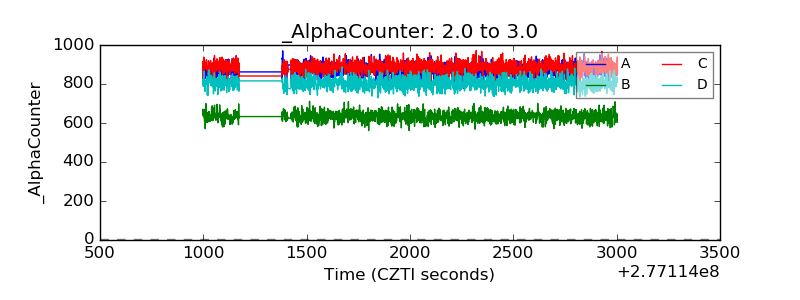 |
| _CPM_Rate | 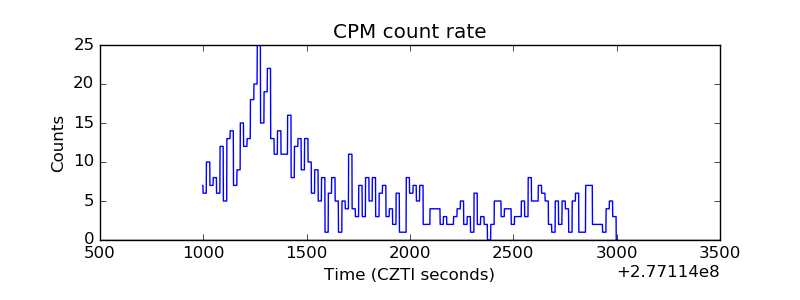 |
| CZT Counter | 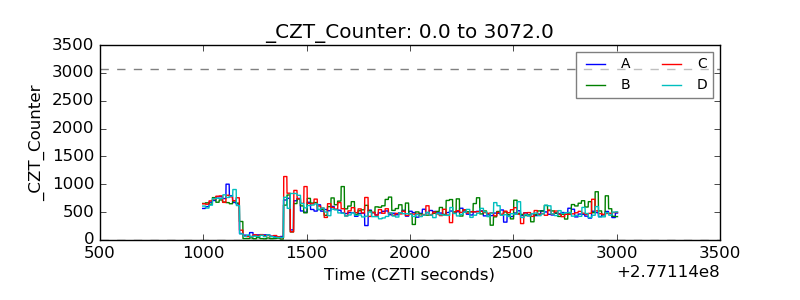 |
| +2.5 Volts monitor |  |
| +5 Volts monitor |  |
| _ROLL_ROT | 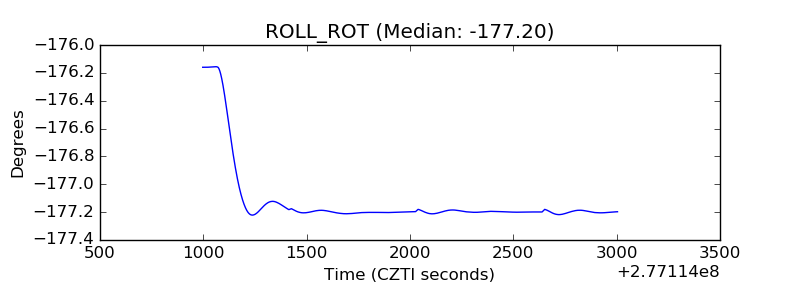 |
| _Roll_DEC | 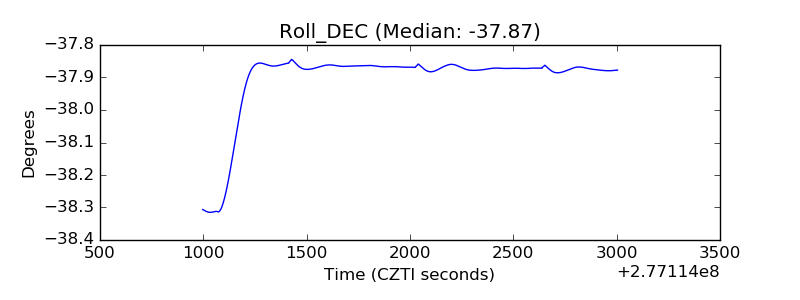 |
| _Roll_RA | 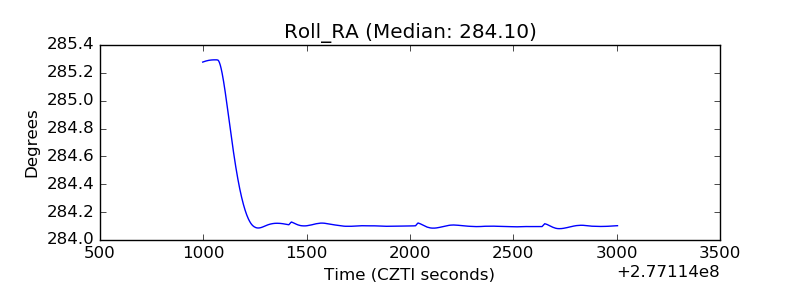 |
| Veto Counter |  |