| Param | Original file | Final file |
|---|---|---|
| Filename | modeM0/AS1C04_007T04_9000002430_16451cztM0_level2.evt | modeM0/AS1C04_007T04_9000002430_16451cztM0_level2_quad_clean.evt |
| Size (bytes) | 1,234,635,840 | 228,142,080 |
| Size | 1.1 GB | 217.6 MB |
| Events in quadrant A | 8,494,259 | 1,421,325 |
| Events in quadrant B | 9,870,941 | 1,456,614 |
| Events in quadrant C | 8,907,582 | 1,418,418 |
| Events in quadrant D | 8,903,243 | 1,375,236 |
| Mode M9 | |||
|---|---|---|---|
| Quadrant | BADHDUFLAG | Total packets | Discarded packets |
| A | 0 | 19 | 0 |
| B | 0 | 19 | 0 |
| C | 0 | 19 | 0 |
| D | 0 | 19 | 0 |
| Mode M0 | |||
|---|---|---|---|
| Quadrant | BADHDUFLAG | Total packets | Discarded packets |
| A | 0 | 37449 | 4 |
| B | 0 | 40742 | 3 |
| C | 0 | 37914 | 3 |
| D | 0 | 39230 | 3 |
| Mode SS | |||
|---|---|---|---|
| Quadrant | BADHDUFLAG | Total packets | Discarded packets |
| A | 0 | 364 | 0 |
| B | 0 | 364 | 0 |
| C | 0 | 364 | 0 |
| D | 0 | 364 | 0 |
| Quadrant | Total seconds | Saturated seconds | Saturation percentage |
|---|---|---|---|
| A | 17969 | 225 | 1.252156% |
| B | 17969 | 288 | 1.602760% |
| C | 17969 | 257 | 1.430241% |
| D | 17969 | 282 | 1.569369% |
Noise dominated data is calculated using 1-second bins in cleaned event files. If a bin has >2000 counts, and if more than 50% of those come from <1% of pixels, then it is considered to be noise-dominated and hence unusable.
| Quadrant | # 1 sec bins | Bins with >0 counts | Bins with >2000 counts | High rate bins dominated by noise | Noise dominated (total time) | Noise dominated (detector-on time) | Marked lightcurve |
|---|---|---|---|---|---|---|---|
| A | 19810 | 17971 | 67 | 67 | 0.34% | 0.37% | 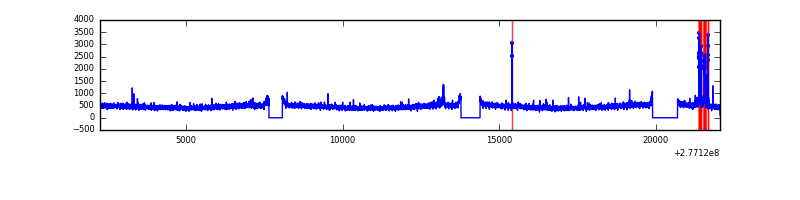 |
| B | 19810 | 17970 | 73 | 73 | 0.37% | 0.41% | 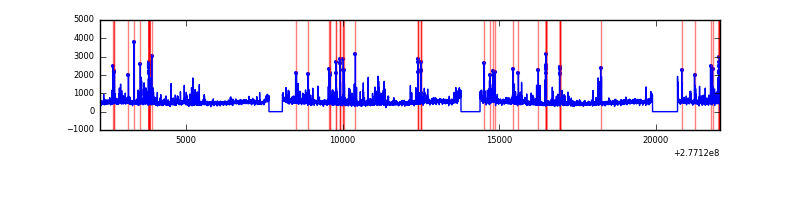 |
| C | 19810 | 17972 | 5 | 5 | 0.03% | 0.03% | 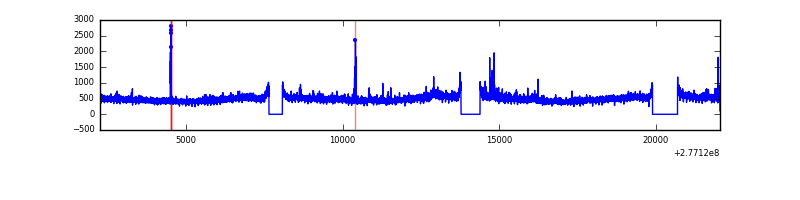 |
| D | 19810 | 17971 | 139 | 139 | 0.70% | 0.77% | 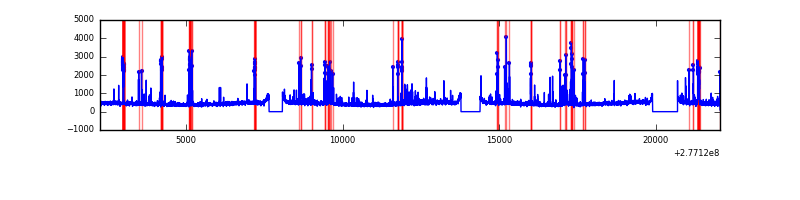 |
Top three noisy pixels from each quadrant. If the there are fewer than three noisy pixels in the level2.evt file, extra rows are filled as -1
| Pixel properties | Quadrant properties | ||||||
|---|---|---|---|---|---|---|---|
| Quadrant | DetID | PixID | Counts | Sigma | Mean | Median | Sigma |
| A | 15 | 174 | 280140 | 643.88 | 2130 | 2082 | 431.8 |
| A | 13 | 248 | 22728 | 47.81 | 2130 | 2082 | 431.8 |
| A | 0 | 226 | 18884 | 38.91 | 2130 | 2082 | 431.8 |
| B | 15 | 35 | 447522 | 1099.6 | 2139 | 2084 | 405.1 |
| B | 7 | 220 | 307624 | 754.25 | 2139 | 2084 | 405.1 |
| B | 0 | 198 | 143460 | 349.0 | 2139 | 2084 | 405.1 |
| C | 3 | 233 | 545408 | 1137.46 | 2044 | 2051 | 477.7 |
| C | 14 | 238 | 313172 | 651.3 | 2044 | 2051 | 477.7 |
| C | 0 | 207 | 83956 | 171.46 | 2044 | 2051 | 477.7 |
| D | 1 | 52 | 431696 | 848.98 | 2064 | 1998 | 506.1 |
| D | 10 | 70 | 204907 | 400.9 | 2064 | 1998 | 506.1 |
| D | 5 | 222 | 197577 | 386.42 | 2064 | 1998 | 506.1 |
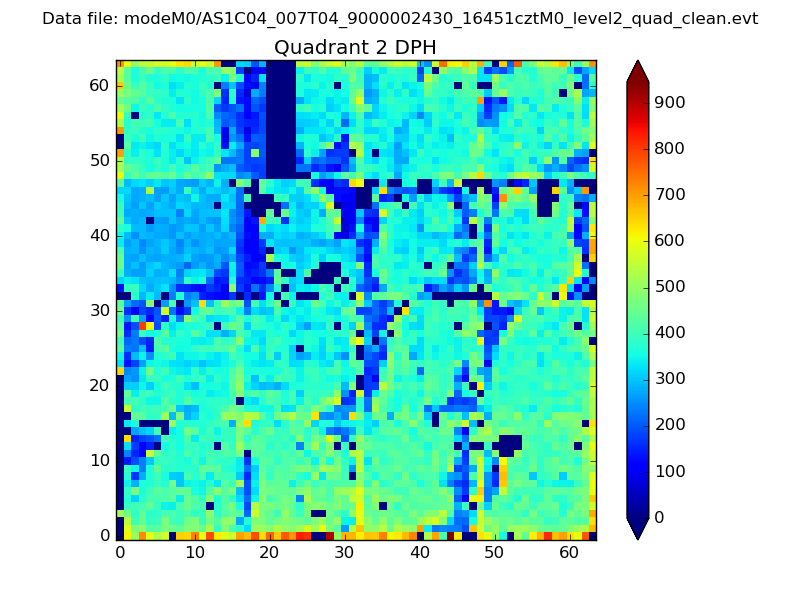
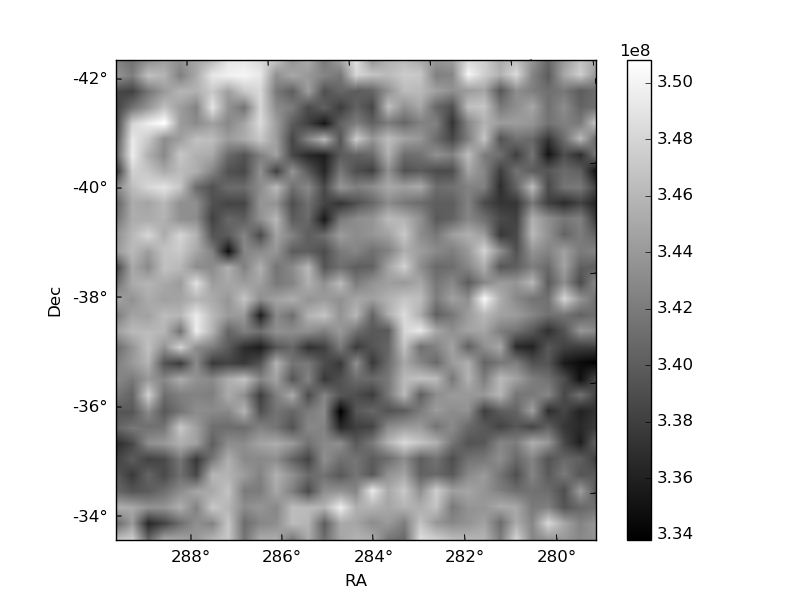
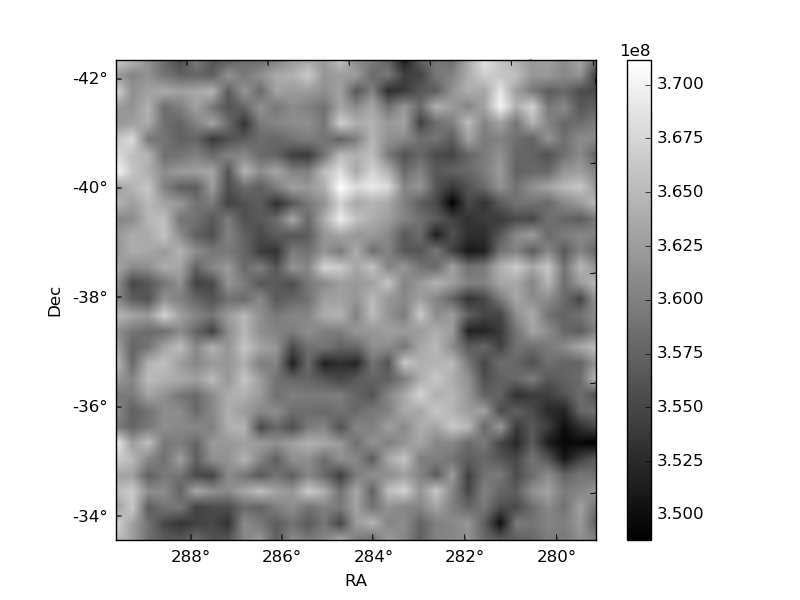
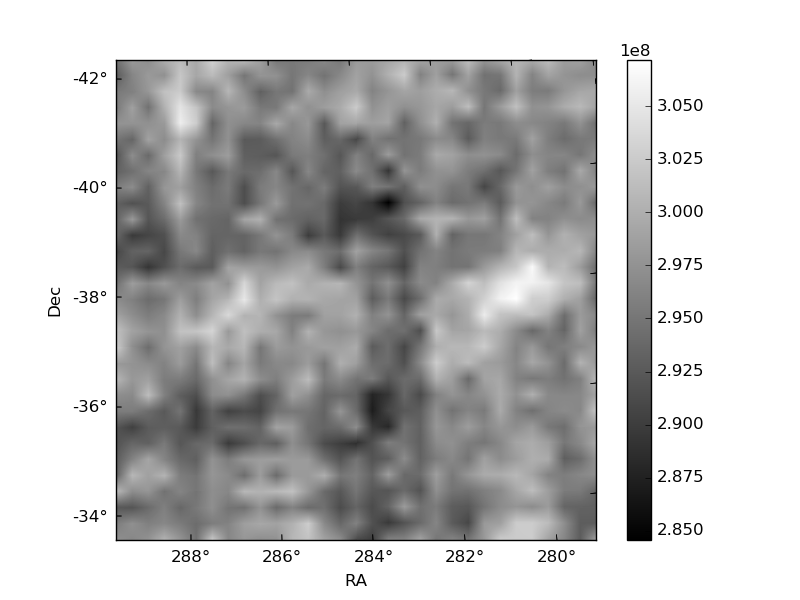
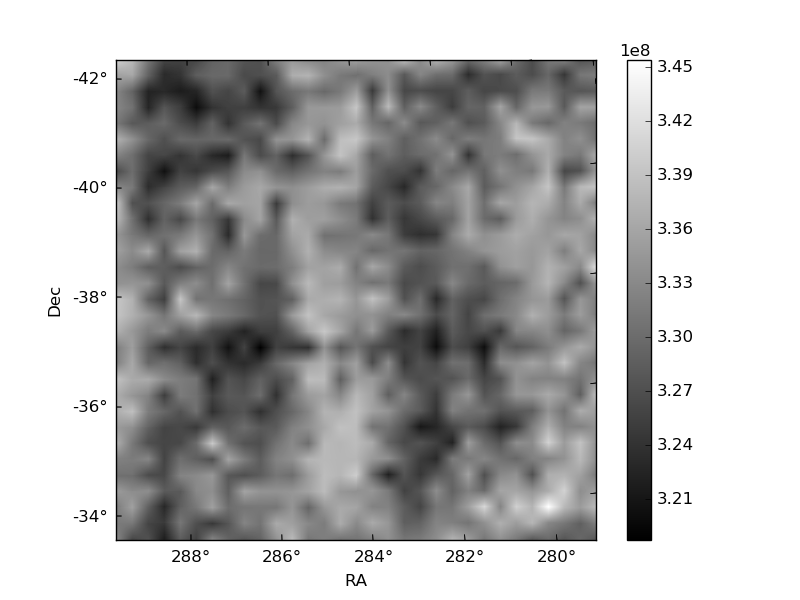
Histogram calculated using DETX and DETY for each event in the final _common_clean file
| Quadrant A | 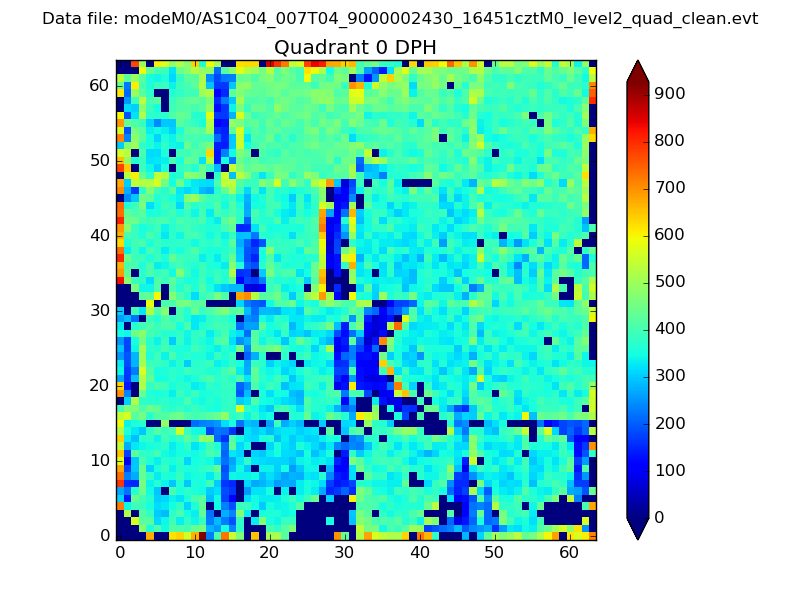 |
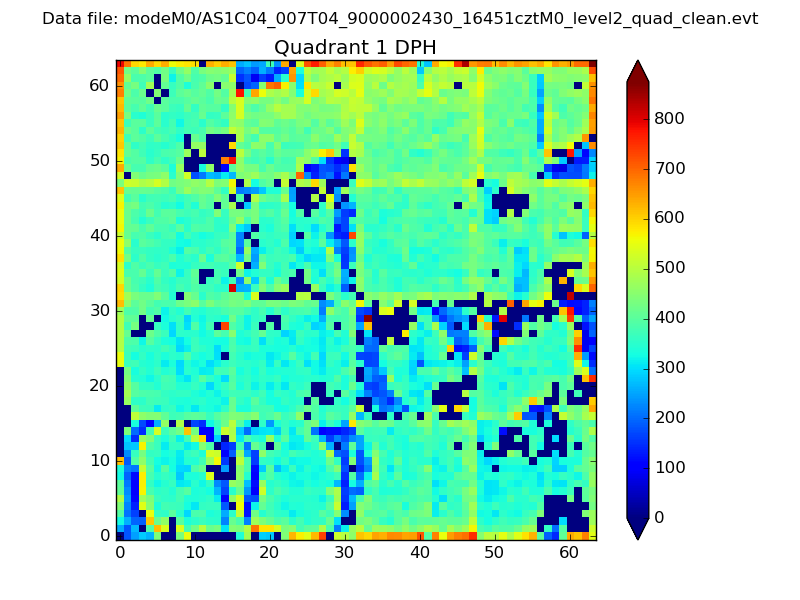 |
Quadrant B |
|---|---|---|---|
| Quadrant D | 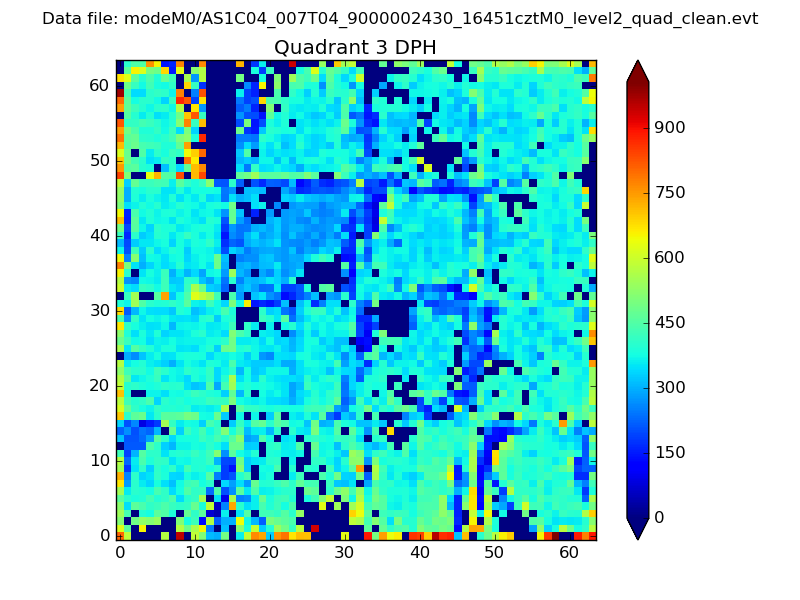 |
 |
Quadrant C |
| Plot type | Count rate plots | Images |
|---|---|---|
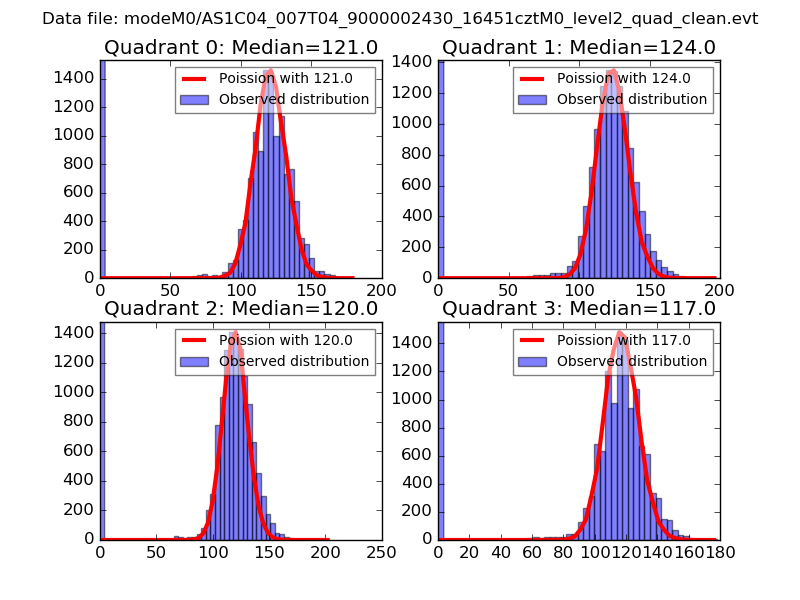
| Comparison with Poisson distribution Blue bars denote a histogram of data divided into 1 sec bins. Red curve is a Poisson curve with rate = median count rate of data. |
 |
 |
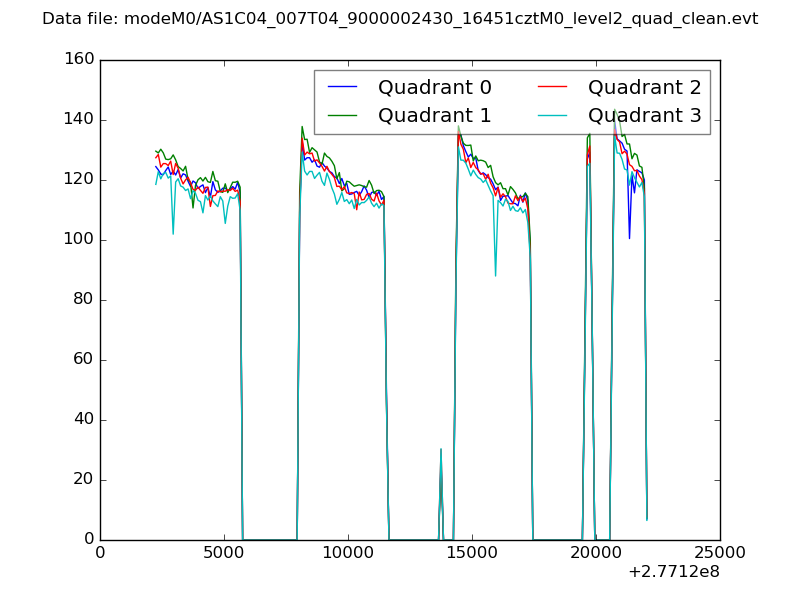
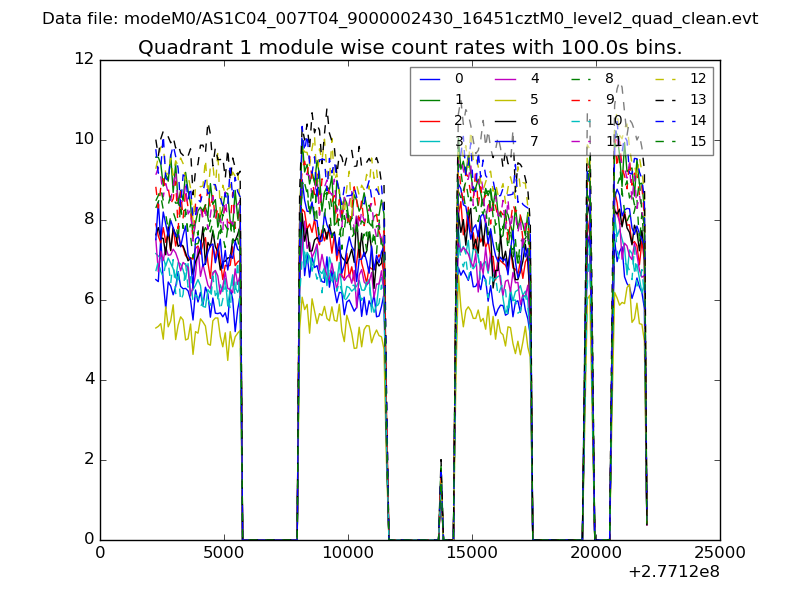
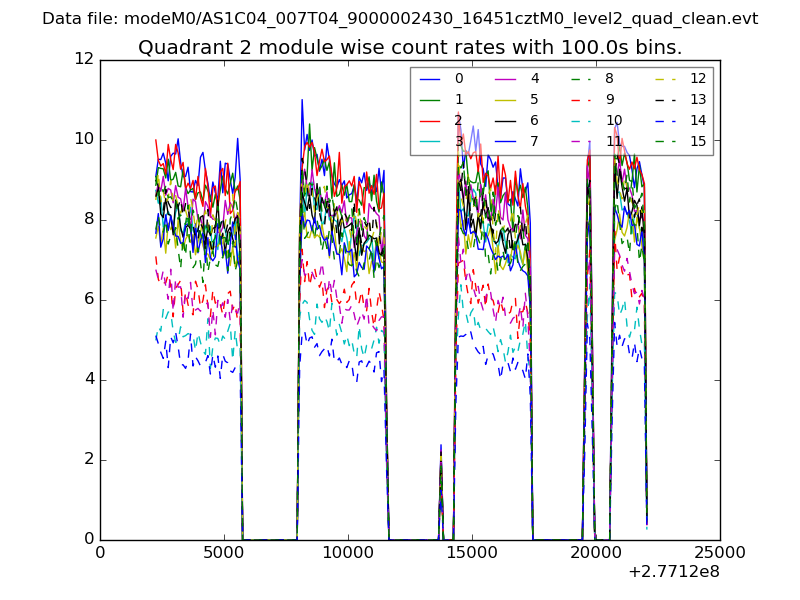
| Quadrant-wise count rates Data is divided into 100 sec bins |
 |
|
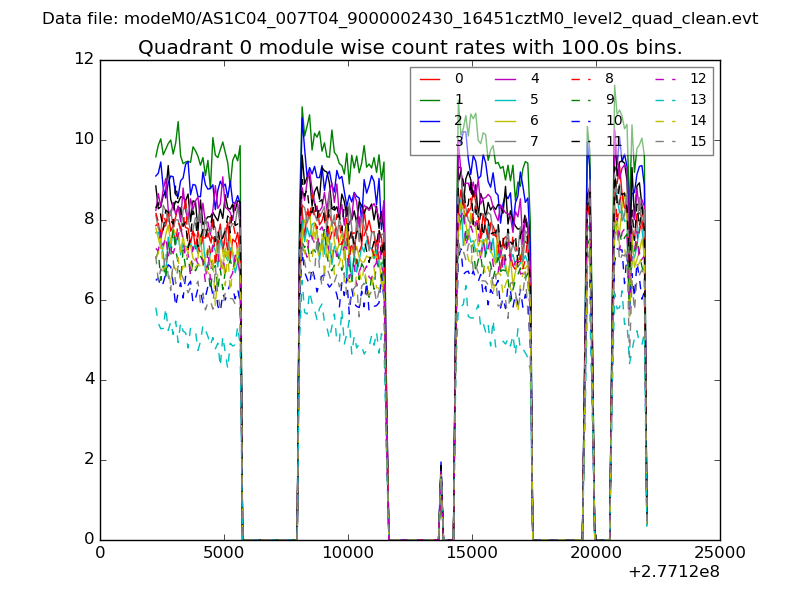
| Module-wise count rates for Quadrant A Data is divided into 100 sec bins |
 |
 |
| Module-wise count rates for Quadrant B Data is divided into 100 sec bins |
 |
 |
| Module-wise count rates for Quadrant C Data is divided into 100 sec bins |
 |
 |
| Module-wise count rates for Quadrant D Data is divided into 100 sec bins |
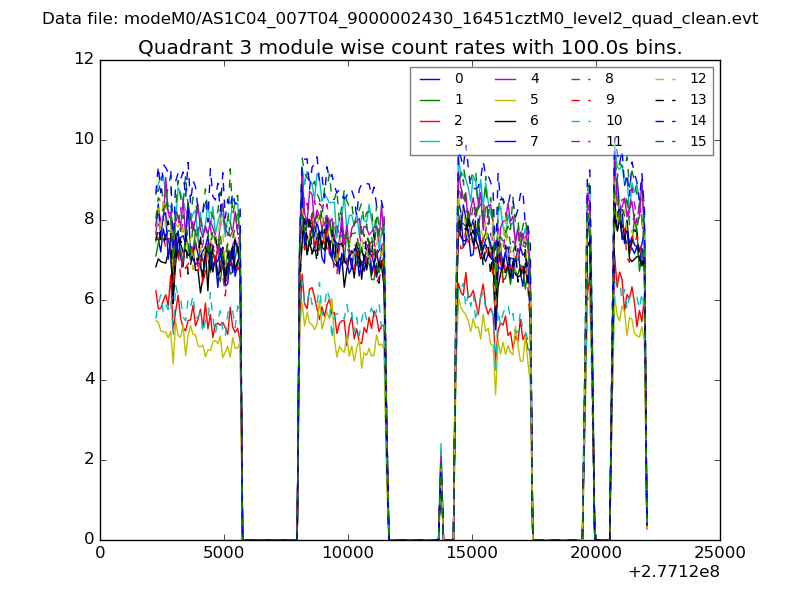 |
 |
| Parameter | Plot |
|---|---|
| CZT HV Monitor | 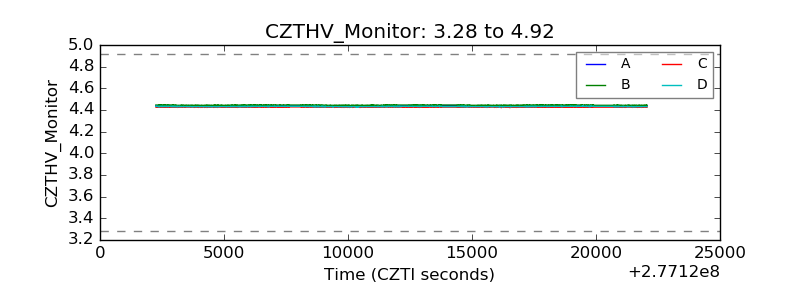 |
| D_VDD | 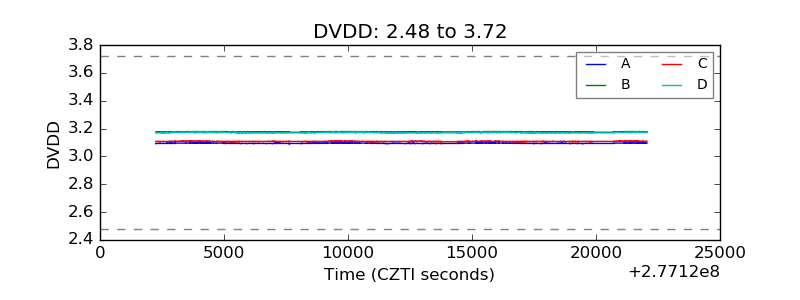 |
| Temperature 1 |  |
| Veto HV Monitor | 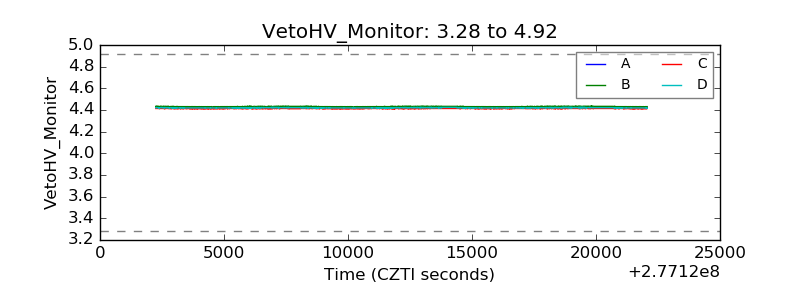 |
| Veto LLD | 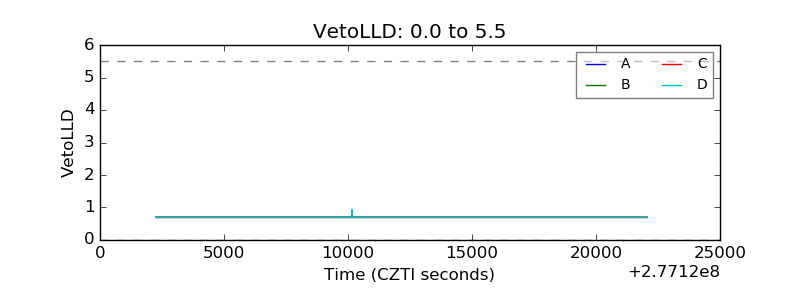 |
| Alpha Counter | 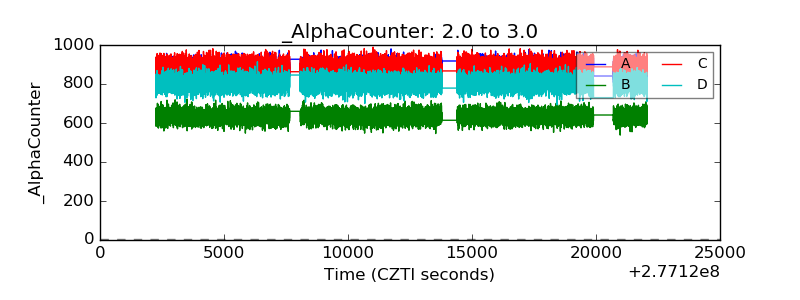 |
| _CPM_Rate | 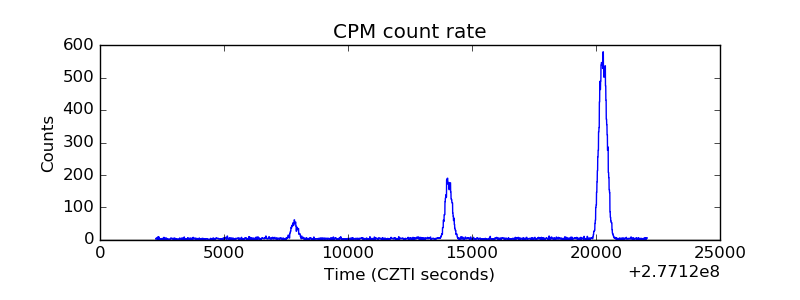 |
| CZT Counter | 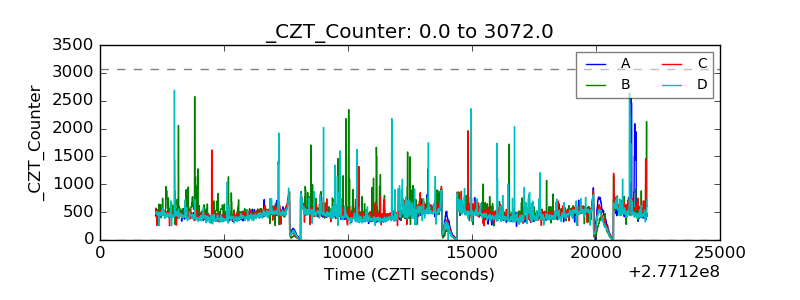 |
| +2.5 Volts monitor |  |
| +5 Volts monitor |  |
| _ROLL_ROT |  |
| _Roll_DEC | 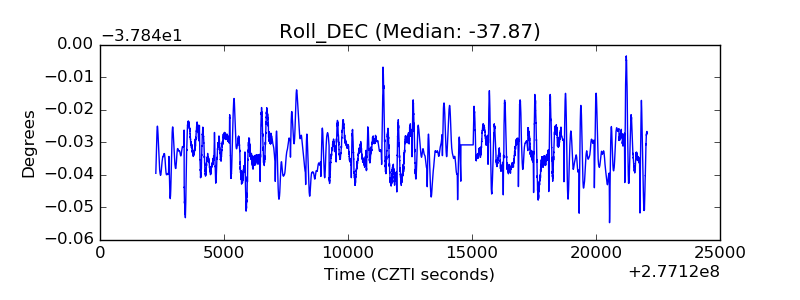 |
| _Roll_RA | 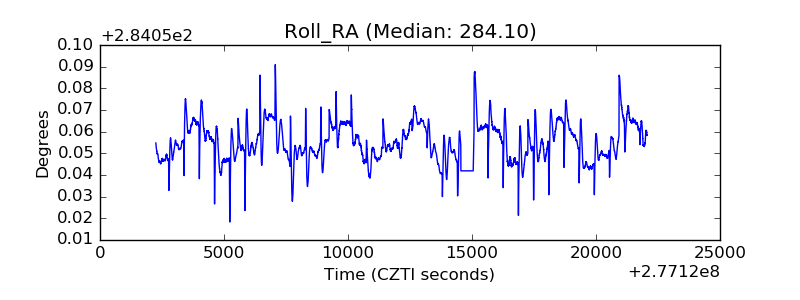 |
| Veto Counter | 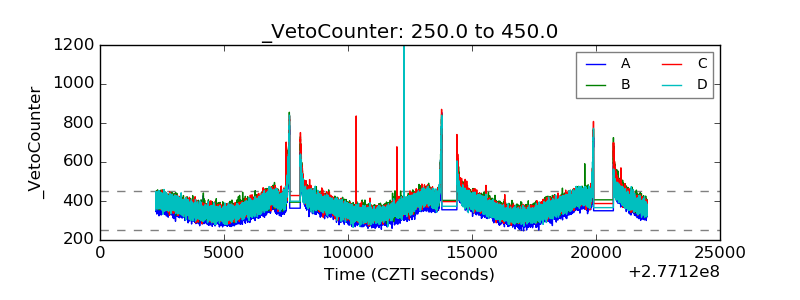 |