| Param | Original file | Final file |
|---|---|---|
| Filename | modeM0/AS1C04_007T04_9000002430_16452cztM0_level2.evt | modeM0/AS1C04_007T04_9000002430_16452cztM0_level2_quad_clean.evt |
| Size (bytes) | 445,472,640 | 83,367,360 |
| Size | 424.8 MB | 79.5 MB |
| Events in quadrant A | 3,209,394 | 521,826 |
| Events in quadrant B | 3,558,002 | 536,077 |
| Events in quadrant C | 3,224,978 | 518,957 |
| Events in quadrant D | 3,068,995 | 506,227 |
| Mode M9 | |||
|---|---|---|---|
| Quadrant | BADHDUFLAG | Total packets | Discarded packets |
| A | 0 | 9 | 0 |
| B | 0 | 9 | 0 |
| C | 0 | 9 | 0 |
| D | 0 | 9 | 0 |
| Mode M0 | |||
|---|---|---|---|
| Quadrant | BADHDUFLAG | Total packets | Discarded packets |
| A | 0 | 13743 | 2 |
| B | 0 | 14573 | 1 |
| C | 0 | 13511 | 1 |
| D | 0 | 13735 | 1 |
| Mode SS | |||
|---|---|---|---|
| Quadrant | BADHDUFLAG | Total packets | Discarded packets |
| A | 0 | 130 | 0 |
| B | 0 | 130 | 0 |
| C | 0 | 130 | 0 |
| D | 0 | 130 | 0 |
| Quadrant | Total seconds | Saturated seconds | Saturation percentage |
|---|---|---|---|
| A | 6320 | 112 | 1.772152% |
| B | 6320 | 102 | 1.613924% |
| C | 6320 | 59 | 0.933544% |
| D | 6320 | 78 | 1.234177% |
Noise dominated data is calculated using 1-second bins in cleaned event files. If a bin has >2000 counts, and if more than 50% of those come from <1% of pixels, then it is considered to be noise-dominated and hence unusable.
| Quadrant | # 1 sec bins | Bins with >0 counts | Bins with >2000 counts | High rate bins dominated by noise | Noise dominated (total time) | Noise dominated (detector-on time) | Marked lightcurve |
|---|---|---|---|---|---|---|---|
| A | 7261 | 6322 | 67 | 67 | 0.92% | 1.06% | 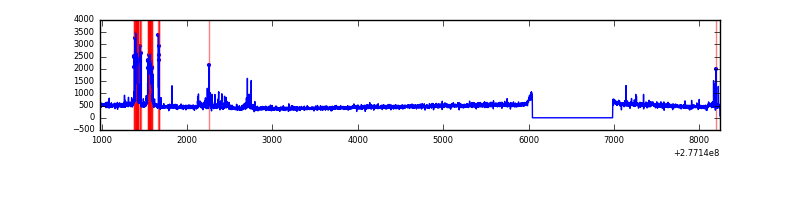 |
| B | 7261 | 6321 | 39 | 39 | 0.54% | 0.62% | 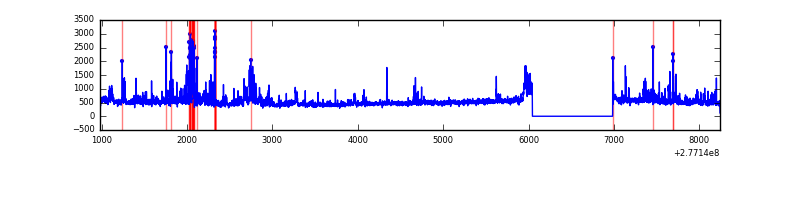 |
| C | 7261 | 6322 | 1 | 1 | 0.01% | 0.02% | 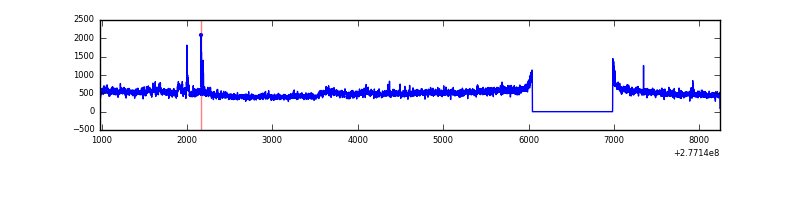 |
| D | 7261 | 6322 | 55 | 55 | 0.76% | 0.87% | 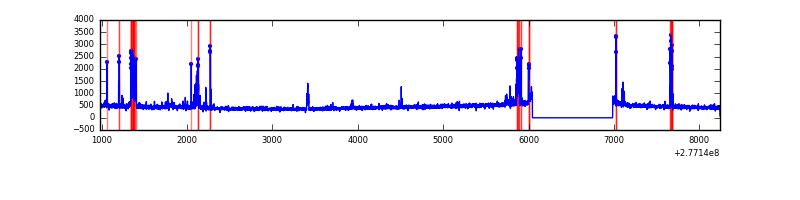 |
Top three noisy pixels from each quadrant. If the there are fewer than three noisy pixels in the level2.evt file, extra rows are filled as -1
| Pixel properties | Quadrant properties | ||||||
|---|---|---|---|---|---|---|---|
| Quadrant | DetID | PixID | Counts | Sigma | Mean | Median | Sigma |
| A | 15 | 174 | 321205 | 2096.71 | 748 | 730 | 152.8 |
| A | 13 | 248 | 10759 | 65.61 | 748 | 730 | 152.8 |
| A | 0 | 226 | 6564 | 38.17 | 748 | 730 | 152.8 |
| B | 15 | 35 | 166736 | 1133.22 | 756 | 735 | 146.5 |
| B | 7 | 220 | 152183 | 1033.87 | 756 | 735 | 146.5 |
| B | 0 | 229 | 68823 | 464.81 | 756 | 735 | 146.5 |
| C | 3 | 233 | 272983 | 1609.67 | 718 | 720 | 169.1 |
| C | 14 | 238 | 111331 | 653.95 | 718 | 720 | 169.1 |
| C | 7 | 247 | 24036 | 137.85 | 718 | 720 | 169.1 |
| D | 5 | 222 | 125961 | 706.1 | 722 | 699 | 177.4 |
| D | 12 | 218 | 61863 | 344.78 | 722 | 699 | 177.4 |
| D | 10 | 70 | 56665 | 315.48 | 722 | 699 | 177.4 |
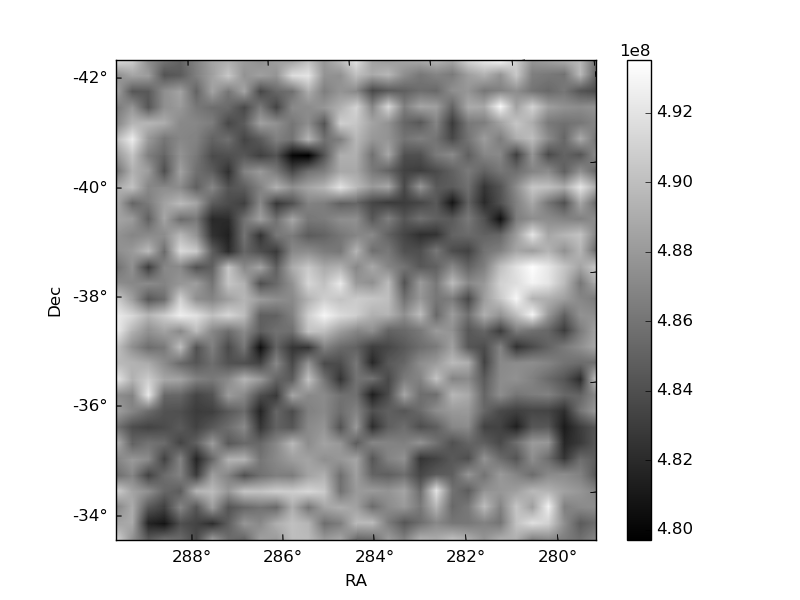
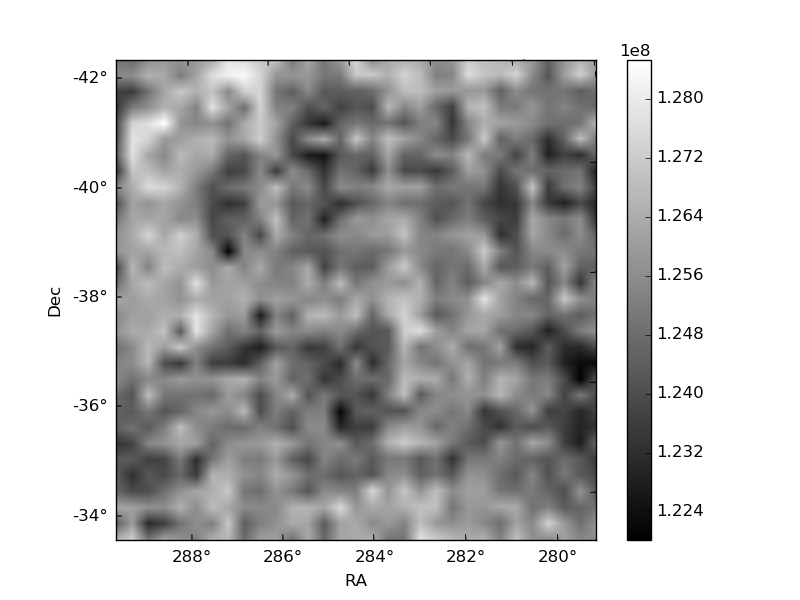
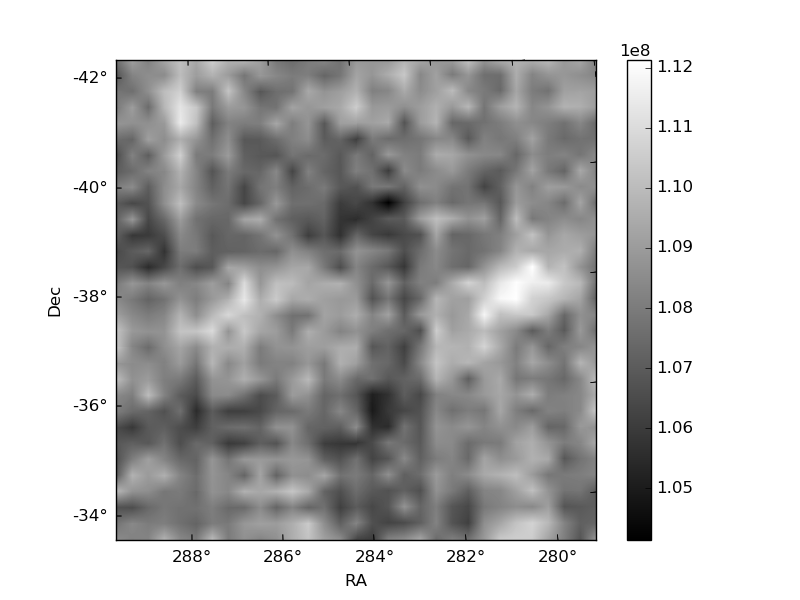
Histogram calculated using DETX and DETY for each event in the final _common_clean file
| Quadrant A | 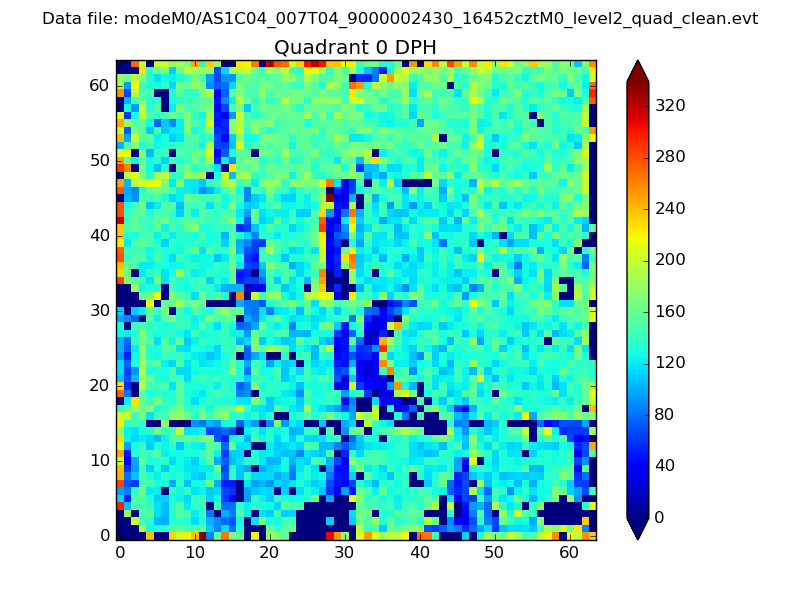 |
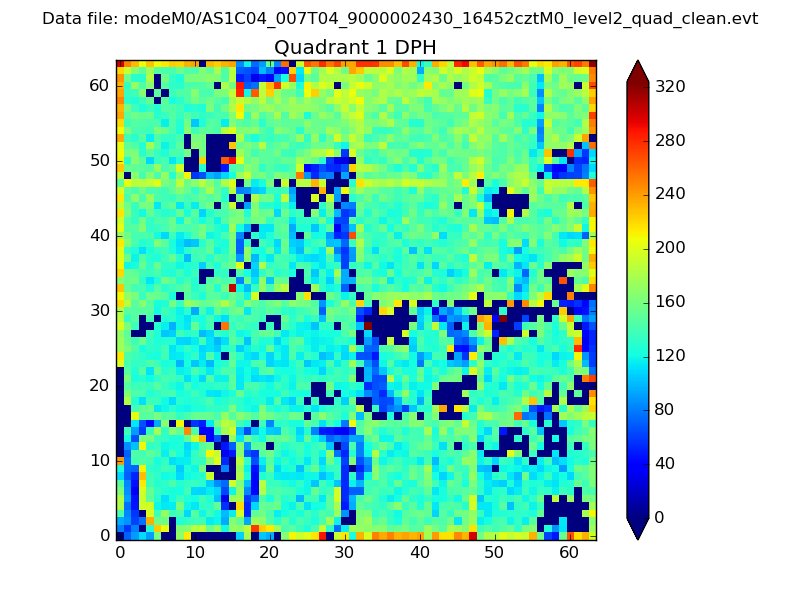 |
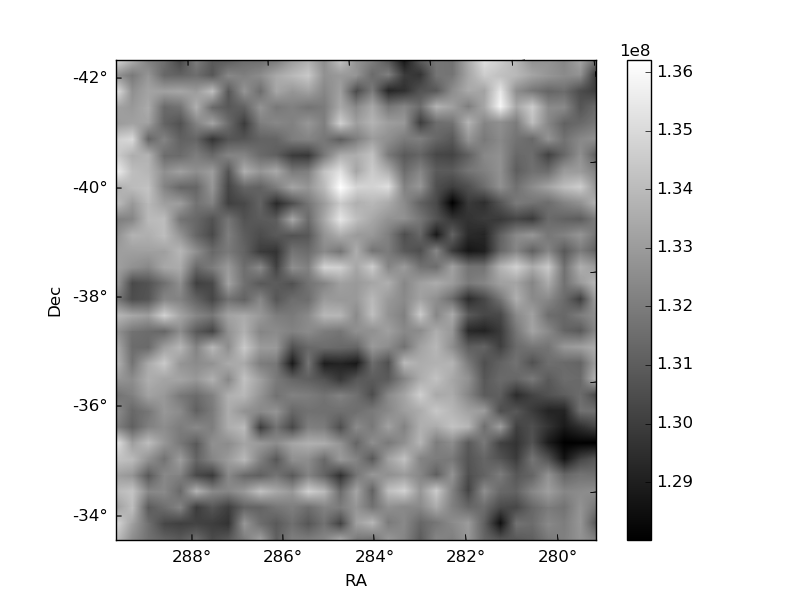
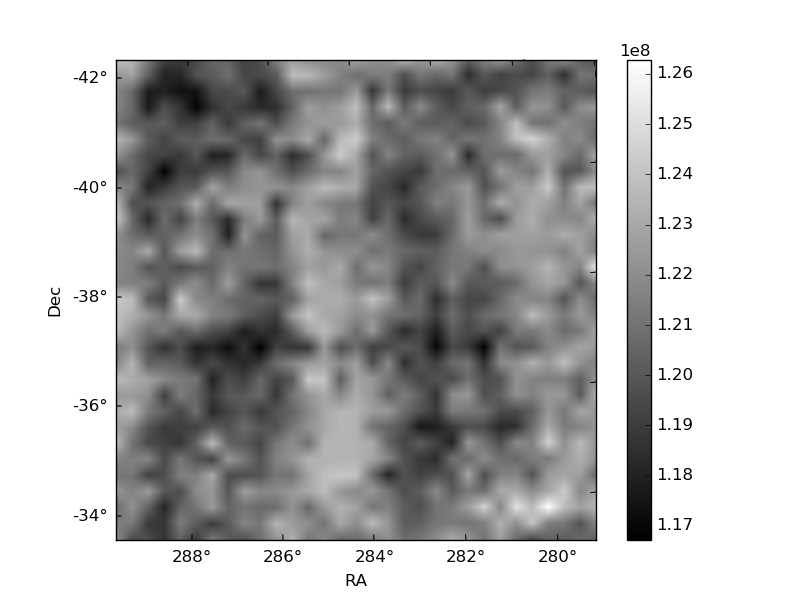
Quadrant B |
|---|---|---|---|
| Quadrant D | 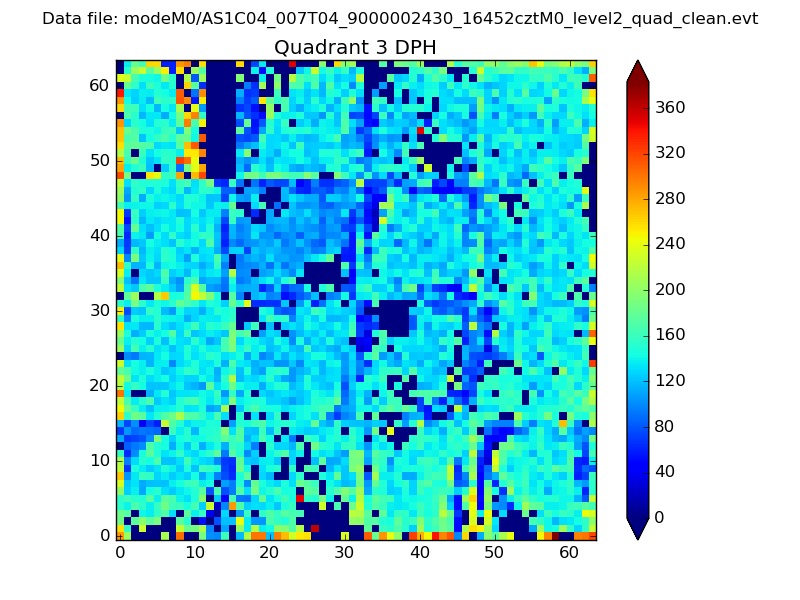 |
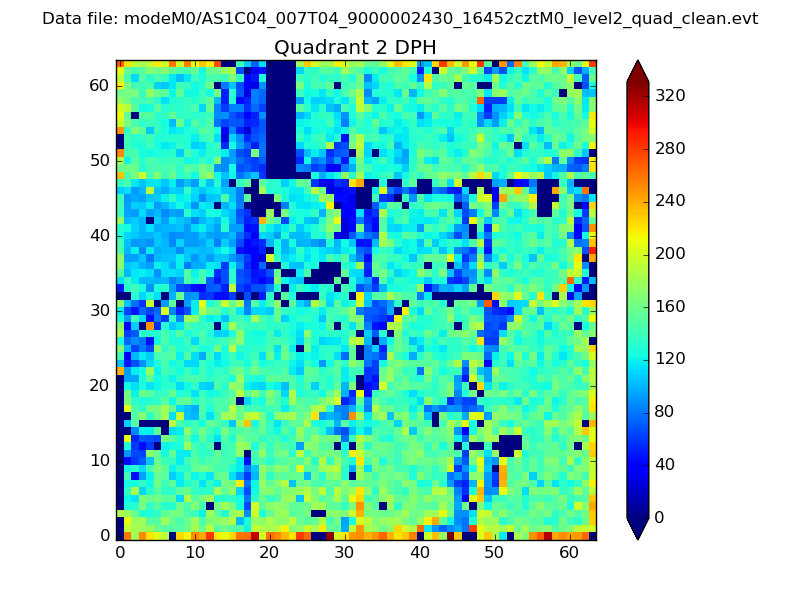 |
Quadrant C |
| Plot type | Count rate plots | Images |
|---|---|---|
| Comparison with Poisson distribution Blue bars denote a histogram of data divided into 1 sec bins. Red curve is a Poisson curve with rate = median count rate of data. |
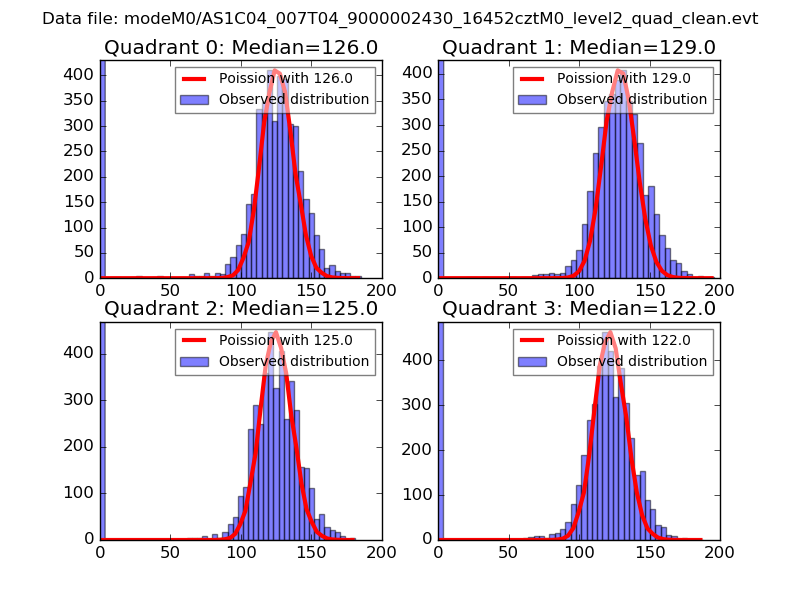 |
 |
| Quadrant-wise count rates Data is divided into 100 sec bins |
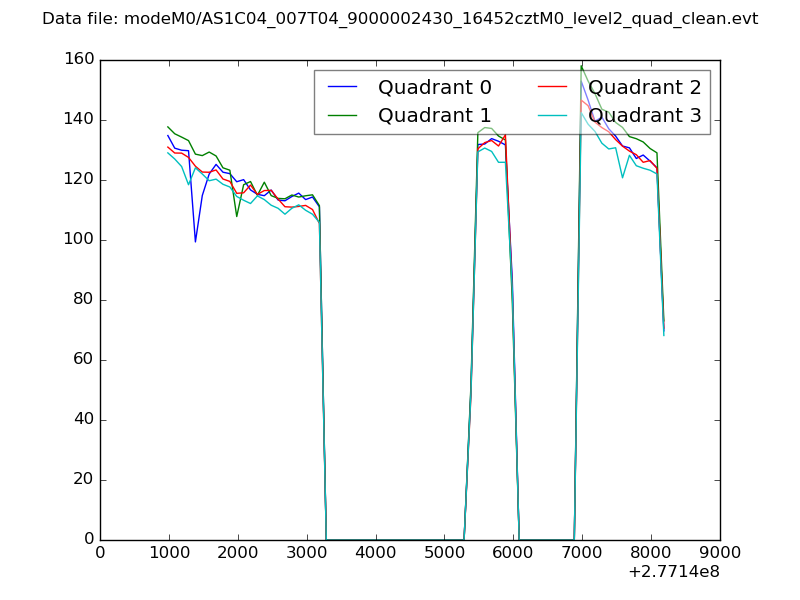 |
|
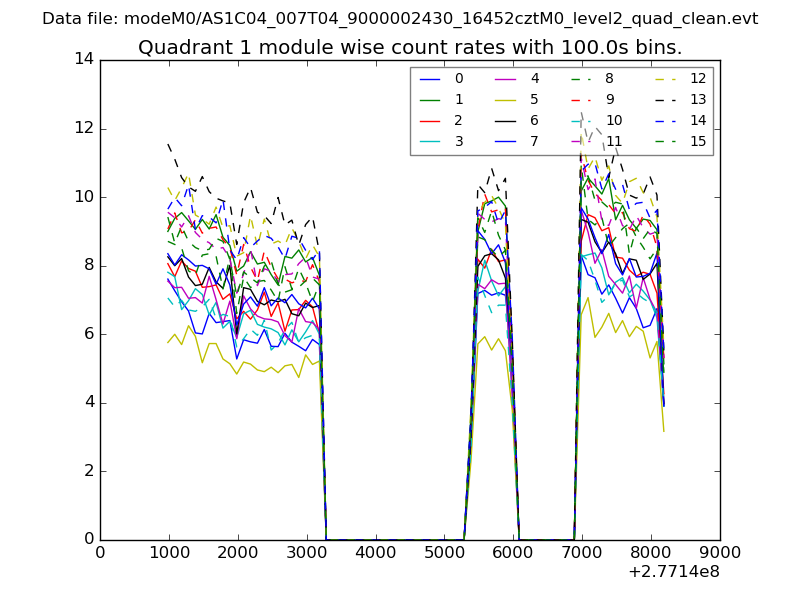
| Module-wise count rates for Quadrant A Data is divided into 100 sec bins |
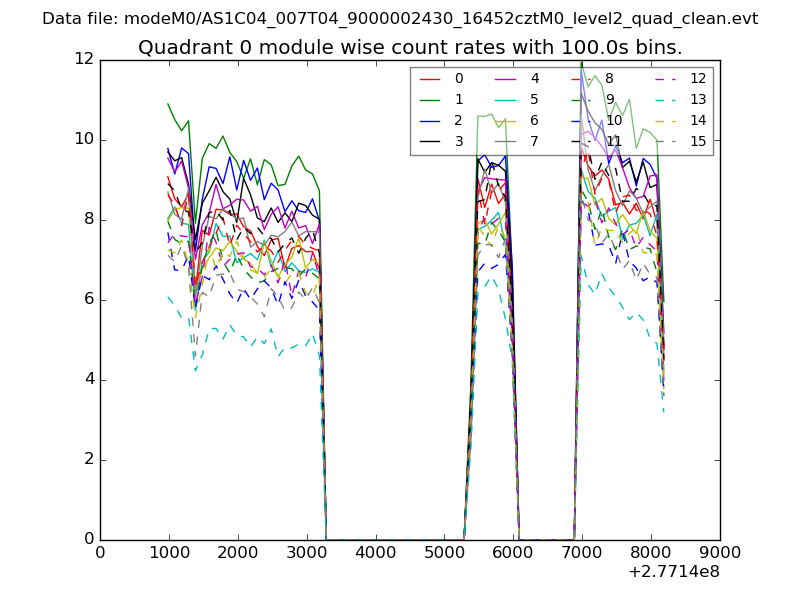 |
 |
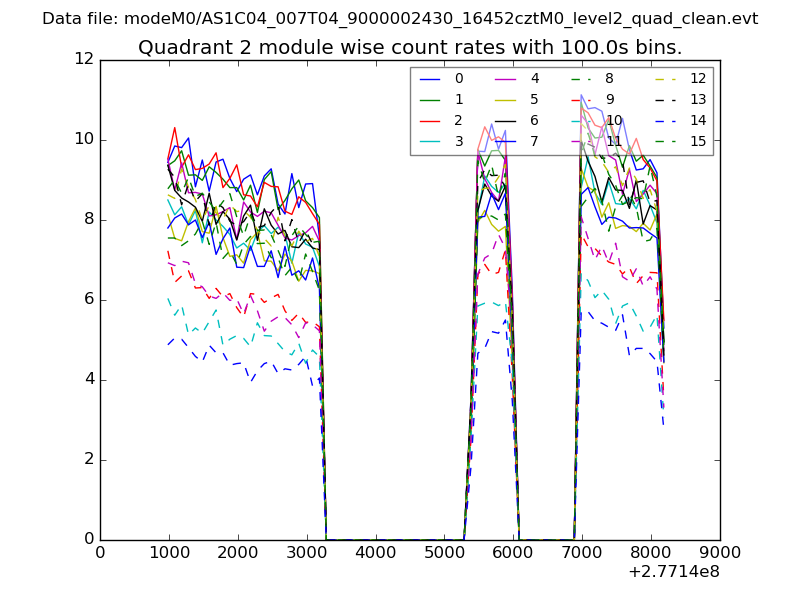
| Module-wise count rates for Quadrant B Data is divided into 100 sec bins |
 |
 |
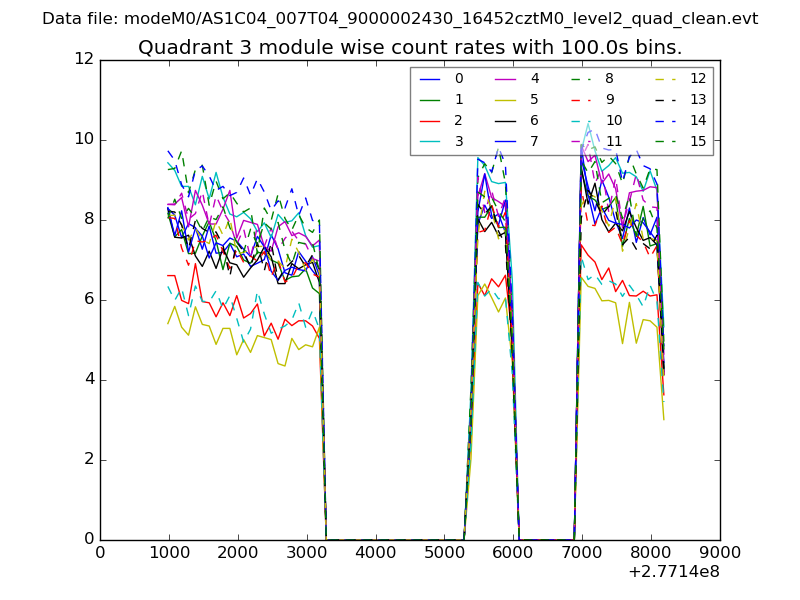
| Module-wise count rates for Quadrant C Data is divided into 100 sec bins |
 |
 |
| Module-wise count rates for Quadrant D Data is divided into 100 sec bins |
 |
 |
| Parameter | Plot |
|---|---|
| CZT HV Monitor | 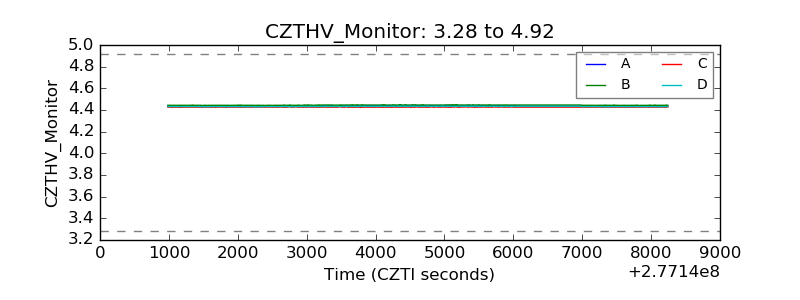 |
| D_VDD | 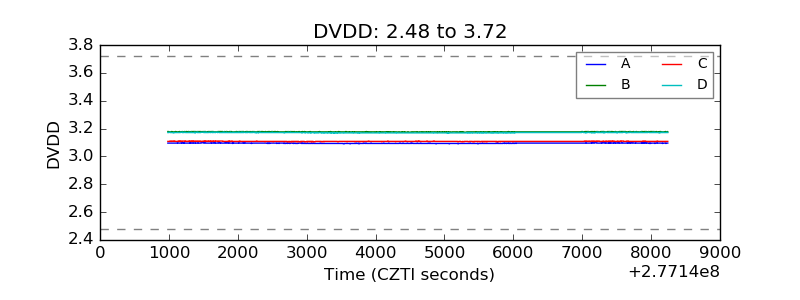 |
| Temperature 1 | 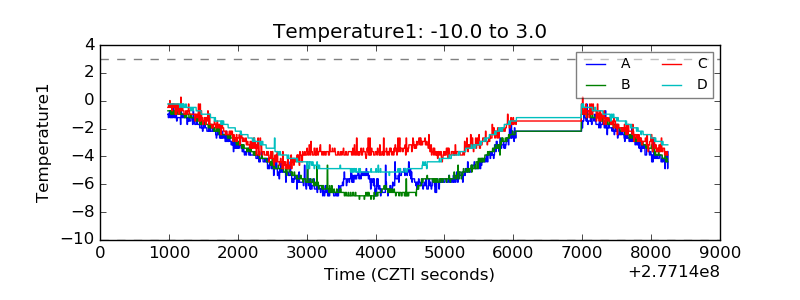 |
| Veto HV Monitor | 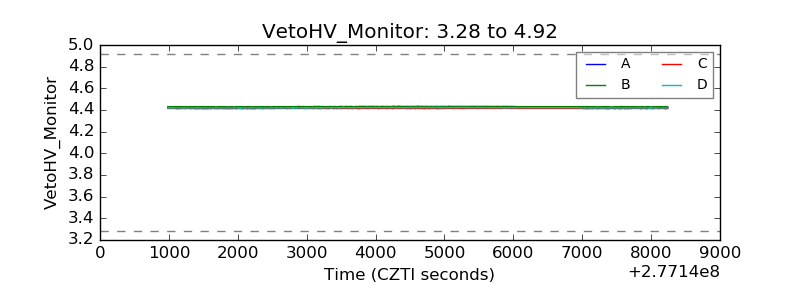 |
| Veto LLD | 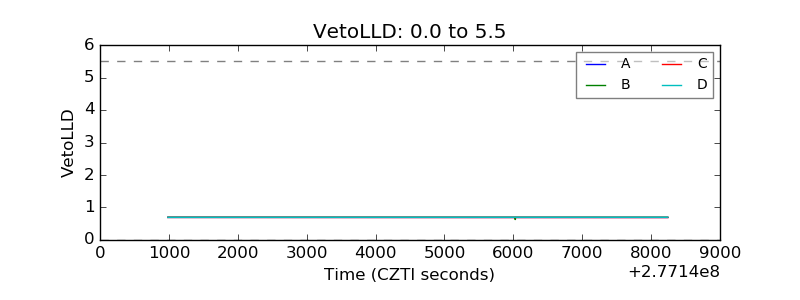 |
| Alpha Counter | 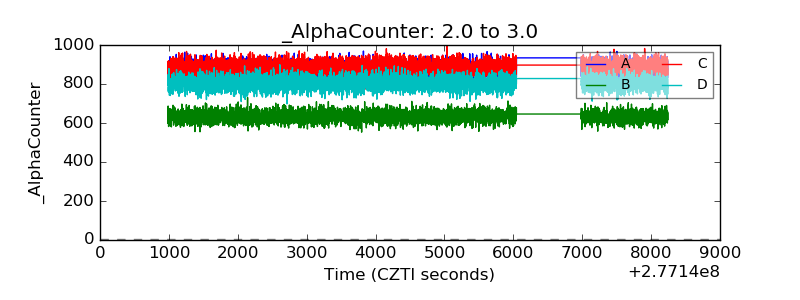 |
| _CPM_Rate | 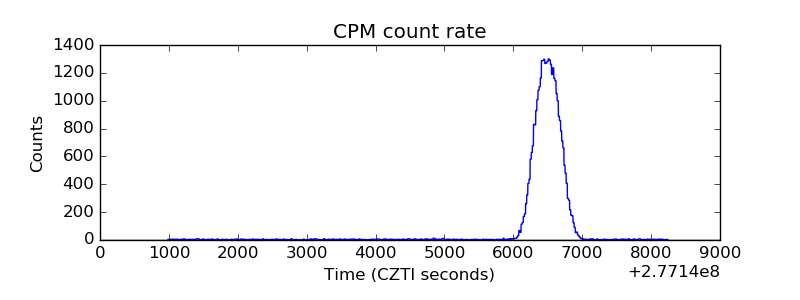 |
| CZT Counter | 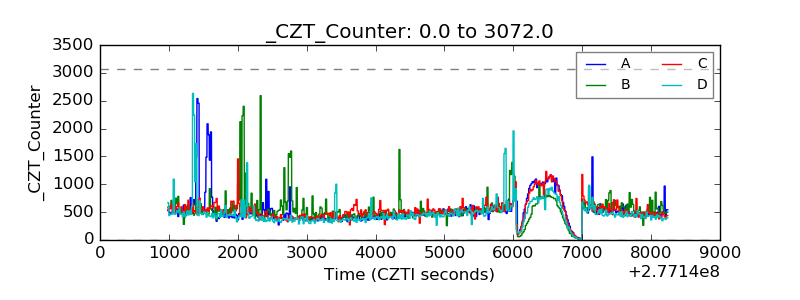 |
| +2.5 Volts monitor |  |
| +5 Volts monitor |  |
| _ROLL_ROT |  |
| _Roll_DEC | 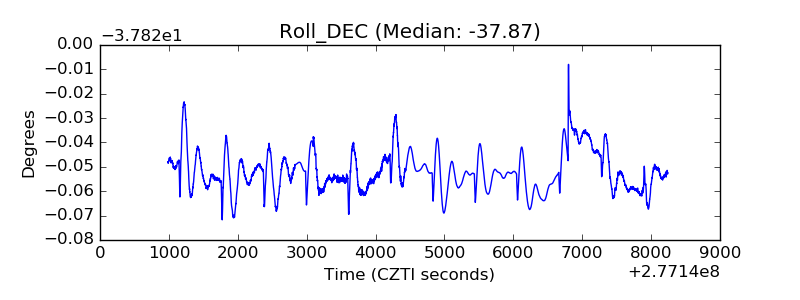 |
| _Roll_RA | 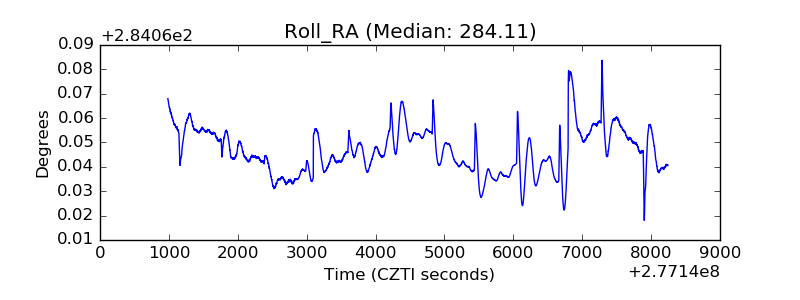 |
| Veto Counter |  |