| Param | Original file | Final file |
|---|---|---|
| Filename | modeM0/AS1C04_007T04_9000002430_16456cztM0_level2.evt | modeM0/AS1C04_007T04_9000002430_16456cztM0_level2_quad_clean.evt |
| Size (bytes) | 463,662,720 | 85,685,760 |
| Size | 442.2 MB | 81.7 MB |
| Events in quadrant A | 3,128,549 | 542,978 |
| Events in quadrant B | 3,871,138 | 557,188 |
| Events in quadrant C | 3,190,317 | 542,124 |
| Events in quadrant D | 3,427,448 | 515,972 |
| Mode M9 | |||
|---|---|---|---|
| Quadrant | BADHDUFLAG | Total packets | Discarded packets |
| A | 0 | 17 | 0 |
| B | 0 | 17 | 0 |
| C | 0 | 17 | 0 |
| D | 0 | 18 | 0 |
| Mode M0 | |||
|---|---|---|---|
| Quadrant | BADHDUFLAG | Total packets | Discarded packets |
| A | 0 | 13154 | 3 |
| B | 0 | 15544 | 2 |
| C | 0 | 13115 | 2 |
| D | 0 | 14374 | 2 |
| Mode SS | |||
|---|---|---|---|
| Quadrant | BADHDUFLAG | Total packets | Discarded packets |
| A | 0 | 128 | 0 |
| B | 0 | 128 | 0 |
| C | 0 | 128 | 0 |
| D | 0 | 128 | 0 |
| Quadrant | Total seconds | Saturated seconds | Saturation percentage |
|---|---|---|---|
| A | 6251 | 44 | 0.703887% |
| B | 6251 | 123 | 1.967685% |
| C | 6251 | 61 | 0.975844% |
| D | 6251 | 82 | 1.311790% |
Noise dominated data is calculated using 1-second bins in cleaned event files. If a bin has >2000 counts, and if more than 50% of those come from <1% of pixels, then it is considered to be noise-dominated and hence unusable.
| Quadrant | # 1 sec bins | Bins with >0 counts | Bins with >2000 counts | High rate bins dominated by noise | Noise dominated (total time) | Noise dominated (detector-on time) | Marked lightcurve |
|---|---|---|---|---|---|---|---|
| A | 7517 | 6252 | 13 | 13 | 0.17% | 0.21% | 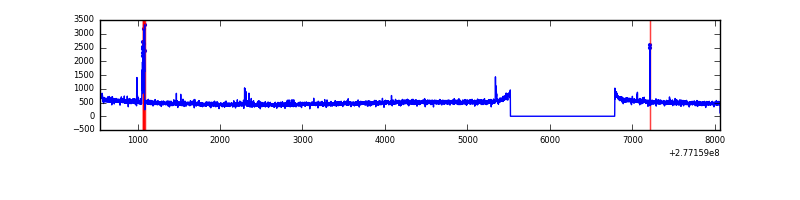 |
| B | 7517 | 6252 | 58 | 58 | 0.77% | 0.93% | 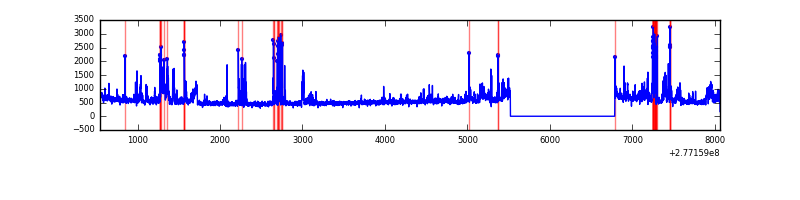 |
| C | 7517 | 6253 | 1 | 1 | 0.01% | 0.02% | 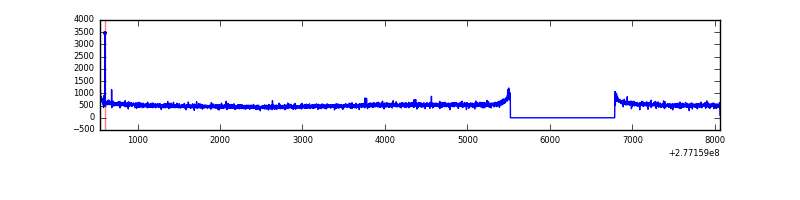 |
| D | 7517 | 6253 | 44 | 44 | 0.59% | 0.70% | 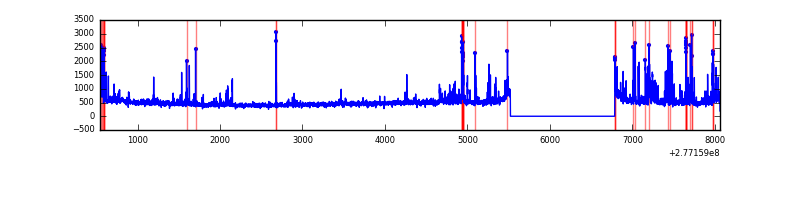 |
Top three noisy pixels from each quadrant. If the there are fewer than three noisy pixels in the level2.evt file, extra rows are filled as -1
| Pixel properties | Quadrant properties | ||||||
|---|---|---|---|---|---|---|---|
| Quadrant | DetID | PixID | Counts | Sigma | Mean | Median | Sigma |
| A | 15 | 174 | 76490 | 475.49 | 792 | 778 | 159.2 |
| A | 0 | 226 | 7088 | 39.63 | 792 | 778 | 159.2 |
| A | 12 | 194 | 5878 | 32.03 | 792 | 778 | 159.2 |
| B | 15 | 35 | 233156 | 1553.64 | 803 | 785 | 149.6 |
| B | 0 | 244 | 207074 | 1379.26 | 803 | 785 | 149.6 |
| B | 4 | 173 | 96715 | 641.39 | 803 | 785 | 149.6 |
| C | 14 | 238 | 121452 | 679.19 | 767 | 772 | 177.7 |
| C | 3 | 233 | 62358 | 346.61 | 767 | 772 | 177.7 |
| C | 0 | 207 | 9099 | 46.86 | 767 | 772 | 177.7 |
| D | 1 | 52 | 372615 | 2006.02 | 763 | 742 | 185.4 |
| D | 2 | 33 | 60157 | 320.5 | 763 | 742 | 185.4 |
| D | 12 | 218 | 36395 | 192.32 | 763 | 742 | 185.4 |
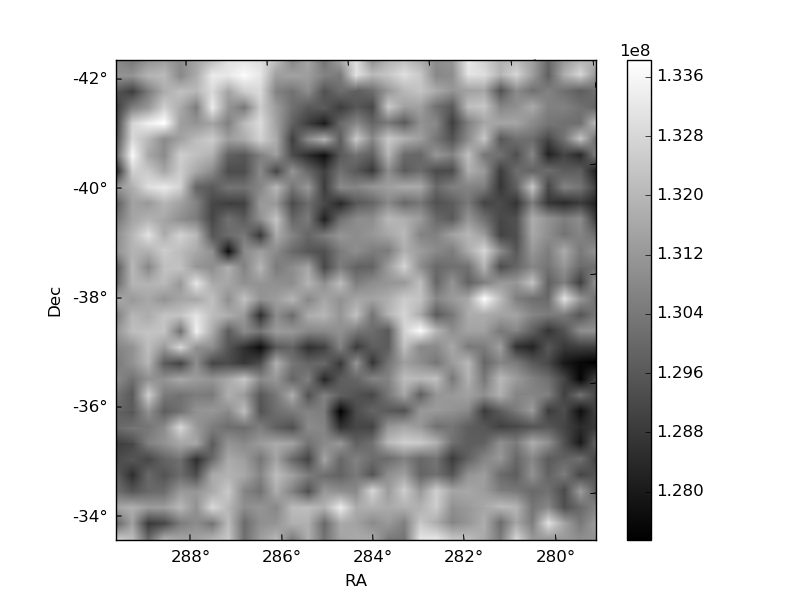
Histogram calculated using DETX and DETY for each event in the final _common_clean file
| Quadrant A |  |
 |
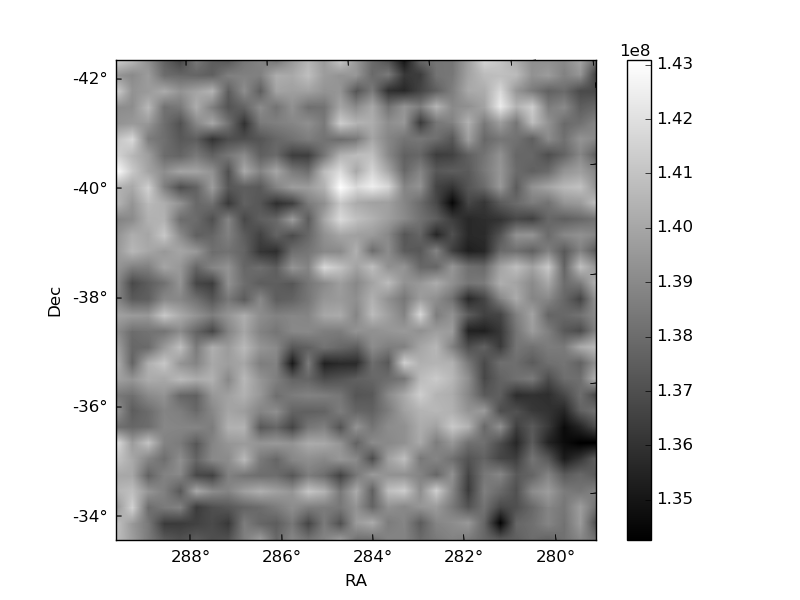
Quadrant B |
|---|---|---|---|
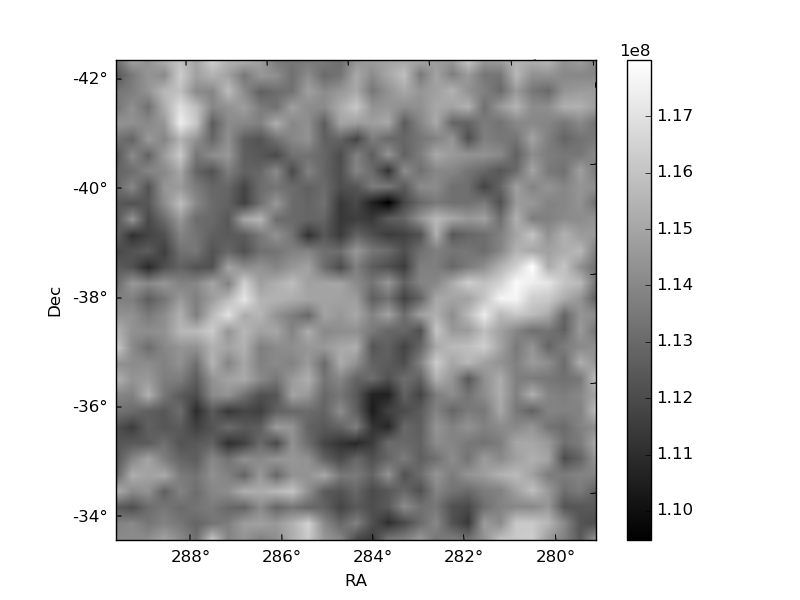
| Quadrant D |  |
 |
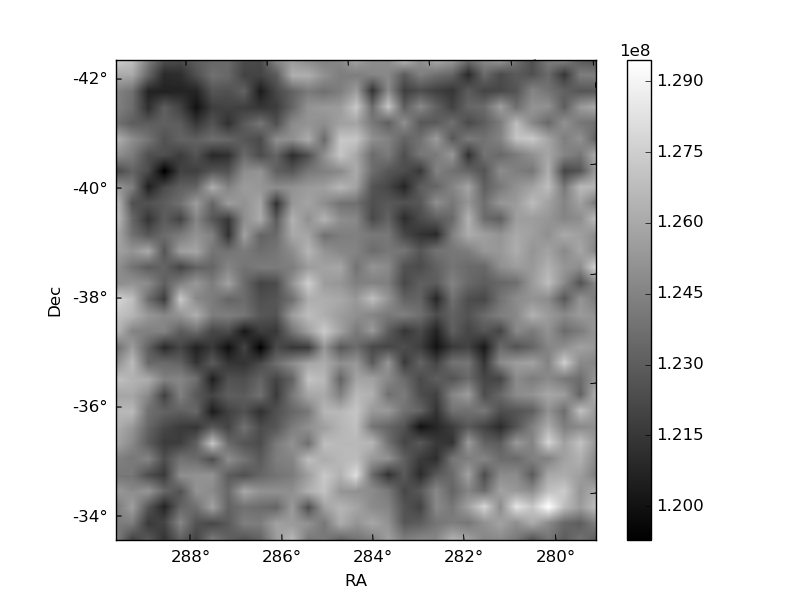
Quadrant C |
| Plot type | Count rate plots | Images |
|---|---|---|
| Comparison with Poisson distribution Blue bars denote a histogram of data divided into 1 sec bins. Red curve is a Poisson curve with rate = median count rate of data. |
 |
 |
| Quadrant-wise count rates Data is divided into 100 sec bins |
 |
|
| Module-wise count rates for Quadrant A Data is divided into 100 sec bins |
 |
 |
| Module-wise count rates for Quadrant B Data is divided into 100 sec bins |
 |
 |
| Module-wise count rates for Quadrant C Data is divided into 100 sec bins |
 |
 |
| Module-wise count rates for Quadrant D Data is divided into 100 sec bins |
 |
 |
| Parameter | Plot |
|---|---|
| CZT HV Monitor |  |
| D_VDD | 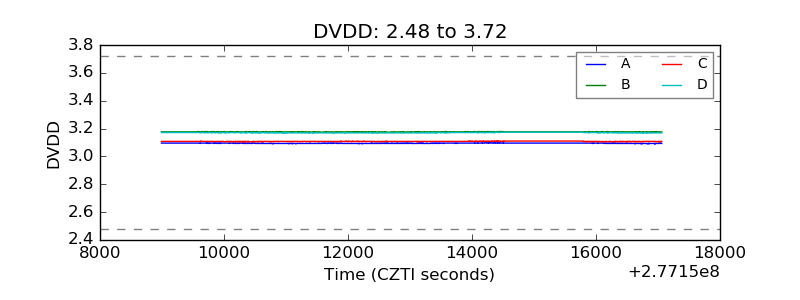 |
| Temperature 1 | 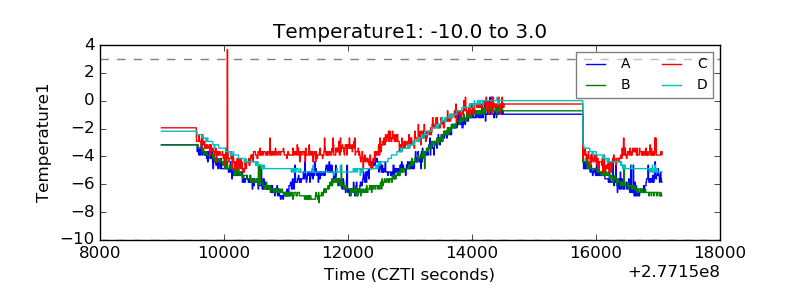 |
| Veto HV Monitor |  |
| Veto LLD |  |
| Alpha Counter |  |
| _CPM_Rate |  |
| CZT Counter |  |
| +2.5 Volts monitor |  |
| +5 Volts monitor |  |
| _ROLL_ROT |  |
| _Roll_DEC |  |
| _Roll_RA |  |
| Veto Counter |  |