| Param | Original file | Final file |
|---|---|---|
| Filename | modeM0/AS1C04_007T04_9000002430_16457cztM0_level2.evt | modeM0/AS1C04_007T04_9000002430_16457cztM0_level2_quad_clean.evt |
| Size (bytes) | 599,359,680 | 75,968,640 |
| Size | 571.6 MB | 72.4 MB |
| Events in quadrant A | 3,218,462 | 479,827 |
| Events in quadrant B | 3,947,933 | 488,119 |
| Events in quadrant C | 3,325,928 | 478,709 |
| Events in quadrant D | 7,222,719 | 403,633 |
| Mode M9 | |||
|---|---|---|---|
| Quadrant | BADHDUFLAG | Total packets | Discarded packets |
| A | 0 | 23 | 0 |
| B | 0 | 23 | 0 |
| C | 0 | 23 | 0 |
| D | 0 | 24 | 0 |
| Mode M0 | |||
|---|---|---|---|
| Quadrant | BADHDUFLAG | Total packets | Discarded packets |
| A | 0 | 13418 | 3 |
| B | 0 | 15846 | 2 |
| C | 0 | 13522 | 2 |
| D | 0 | 25701 | 2 |
| Mode SS | |||
|---|---|---|---|
| Quadrant | BADHDUFLAG | Total packets | Discarded packets |
| A | 0 | 132 | 0 |
| B | 0 | 132 | 0 |
| C | 0 | 132 | 0 |
| D | 0 | 132 | 0 |
| Quadrant | Total seconds | Saturated seconds | Saturation percentage |
|---|---|---|---|
| A | 6441 | 19 | 0.294985% |
| B | 6441 | 133 | 2.064897% |
| C | 6441 | 54 | 0.838379% |
| D | 6441 | 1283 | 19.919267% |
Noise dominated data is calculated using 1-second bins in cleaned event files. If a bin has >2000 counts, and if more than 50% of those come from <1% of pixels, then it is considered to be noise-dominated and hence unusable.
| Quadrant | # 1 sec bins | Bins with >0 counts | Bins with >2000 counts | High rate bins dominated by noise | Noise dominated (total time) | Noise dominated (detector-on time) | Marked lightcurve |
|---|---|---|---|---|---|---|---|
| A | 7787 | 6442 | 2 | 2 | 0.03% | 0.03% | 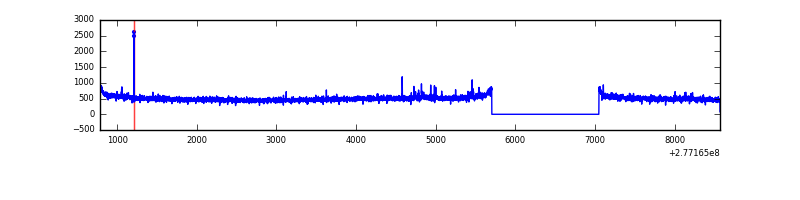 |
| B | 7787 | 6443 | 64 | 64 | 0.82% | 0.99% |  |
| C | 7787 | 6443 | 0 | 0 | 0.00% | 0.00% | 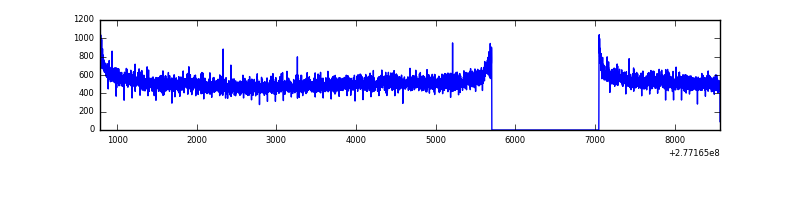 |
| D | 7787 | 6442 | 1188 | 1188 | 15.26% | 18.44% | 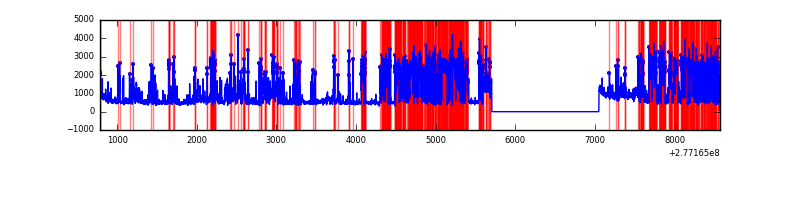 |
Top three noisy pixels from each quadrant. If the there are fewer than three noisy pixels in the level2.evt file, extra rows are filled as -1
| Pixel properties | Quadrant properties | ||||||
|---|---|---|---|---|---|---|---|
| Quadrant | DetID | PixID | Counts | Sigma | Mean | Median | Sigma |
| A | 15 | 174 | 31424 | 184.38 | 829 | 813 | 166.0 |
| A | 0 | 226 | 7381 | 39.56 | 829 | 813 | 166.0 |
| A | 12 | 194 | 6021 | 31.37 | 829 | 813 | 166.0 |
| B | 15 | 35 | 212974 | 1349.6 | 837 | 819 | 157.2 |
| B | 0 | 244 | 135768 | 858.46 | 837 | 819 | 157.2 |
| B | 7 | 220 | 69525 | 437.07 | 837 | 819 | 157.2 |
| C | 14 | 238 | 126508 | 677.2 | 805 | 812 | 185.6 |
| C | 3 | 233 | 54342 | 288.4 | 805 | 812 | 185.6 |
| C | 13 | 61 | 5756 | 26.64 | 805 | 812 | 185.6 |
| D | 1 | 52 | 4323166 | 24621.53 | 731 | 711 | 175.6 |
| D | 12 | 218 | 41737 | 233.69 | 731 | 711 | 175.6 |
| D | 7 | 223 | 29579 | 164.44 | 731 | 711 | 175.6 |
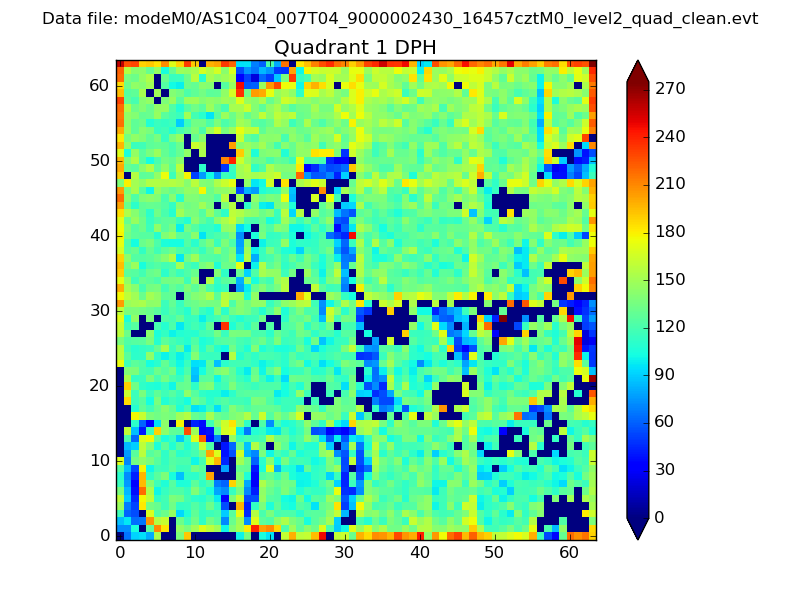
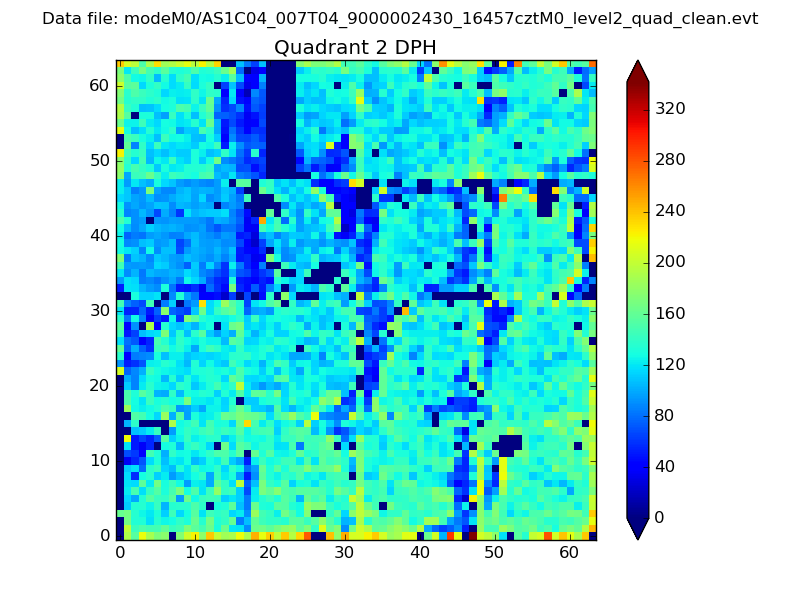
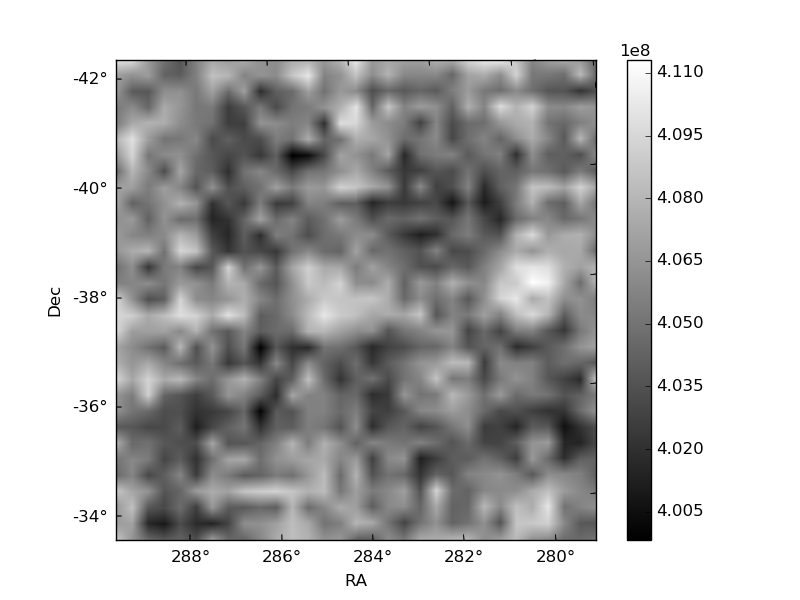
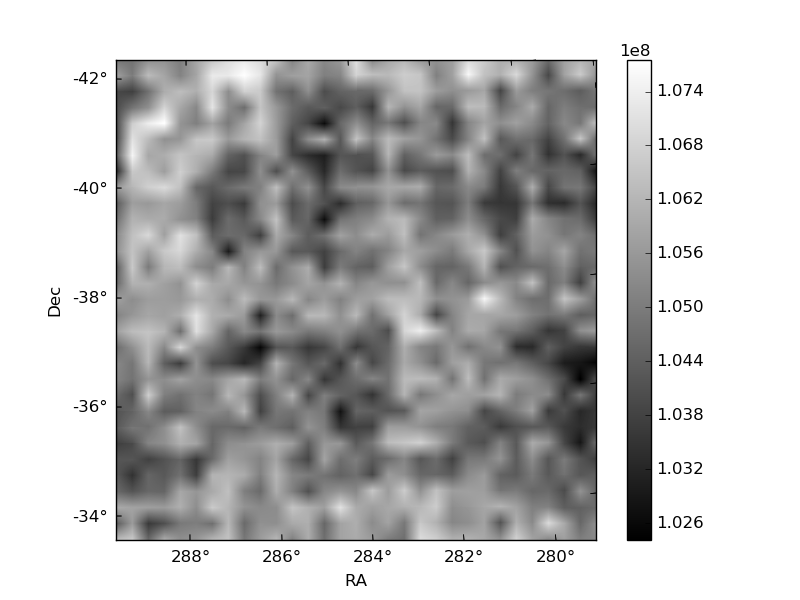
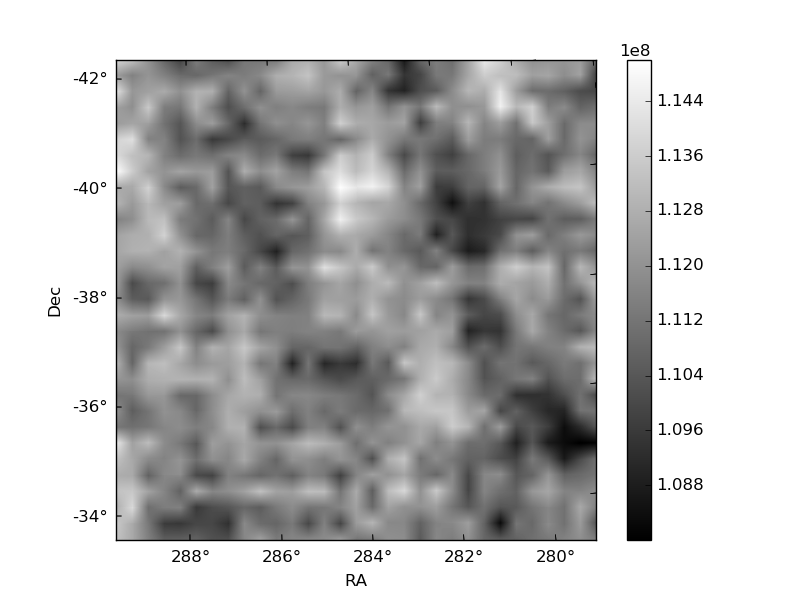
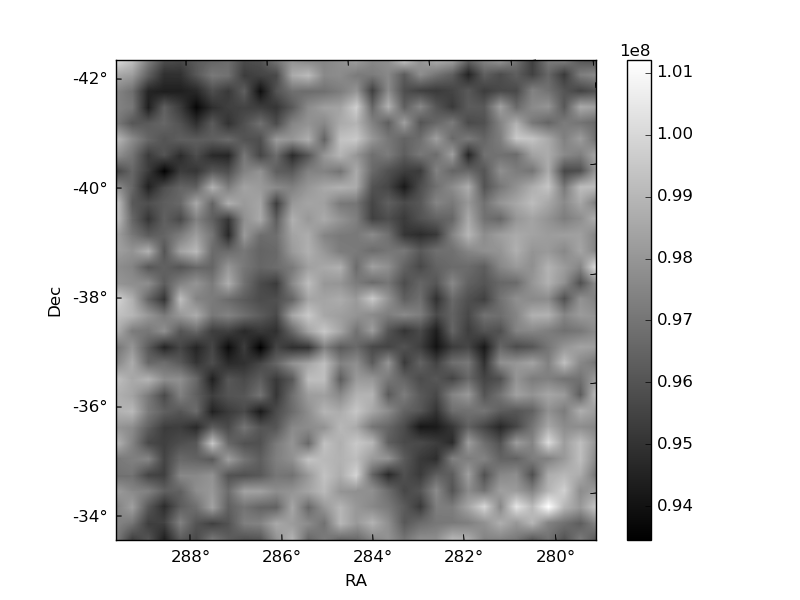
Histogram calculated using DETX and DETY for each event in the final _common_clean file
| Quadrant A | 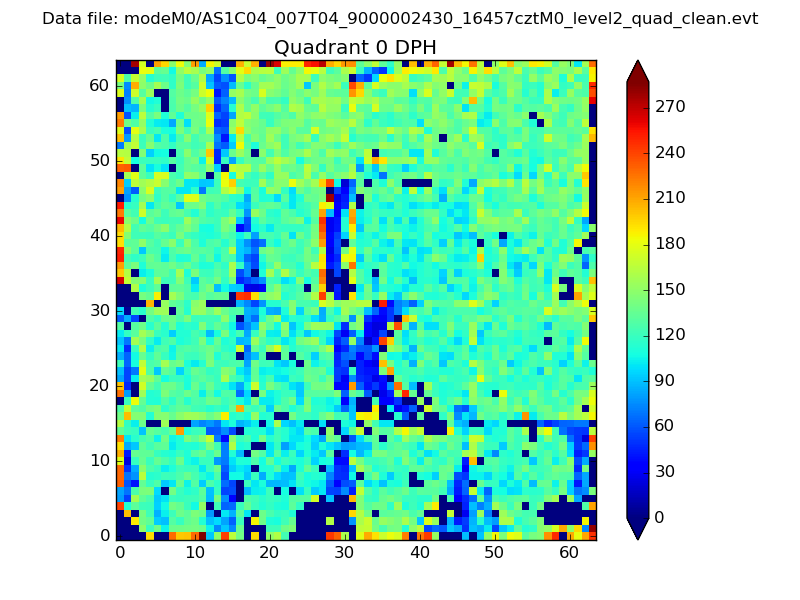 |
 |
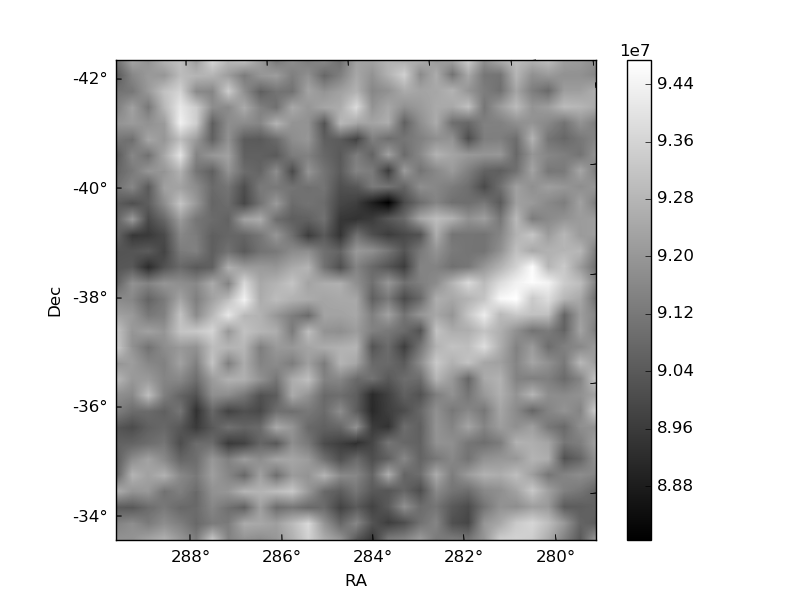
Quadrant B |
|---|---|---|---|
| Quadrant D | 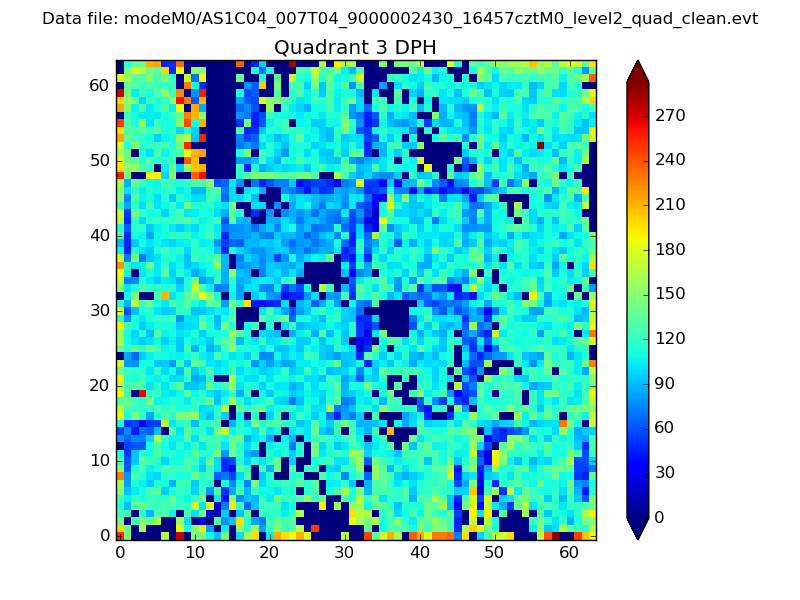 |
 |
Quadrant C |
| Plot type | Count rate plots | Images |
|---|---|---|
| Comparison with Poisson distribution Blue bars denote a histogram of data divided into 1 sec bins. Red curve is a Poisson curve with rate = median count rate of data. |
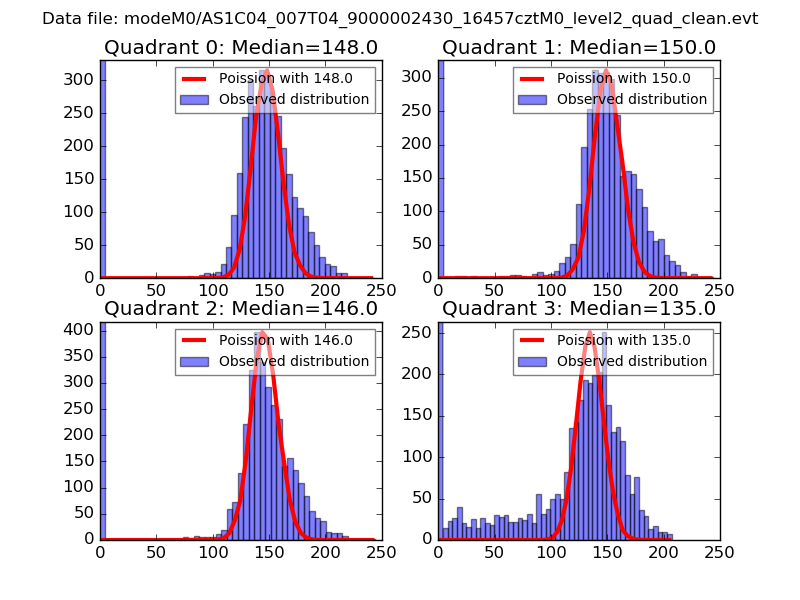 |
 |
| Quadrant-wise count rates Data is divided into 100 sec bins |
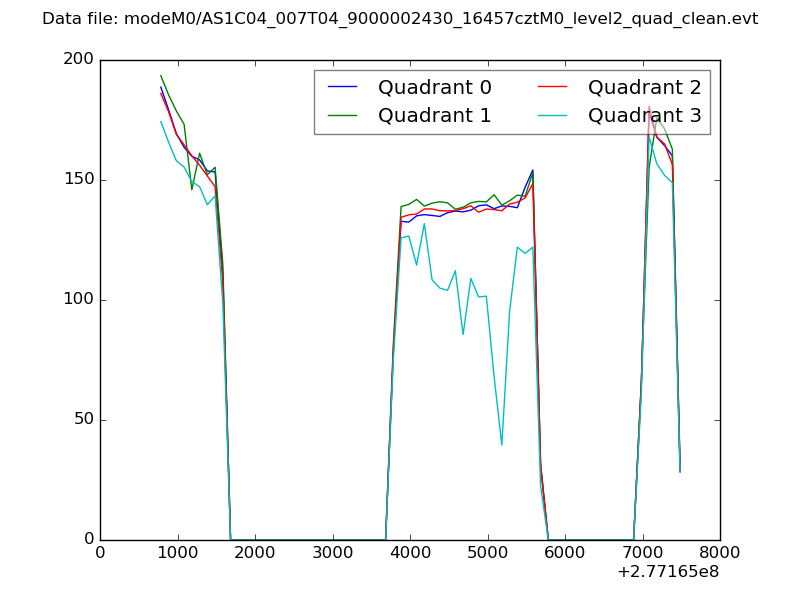 |
|
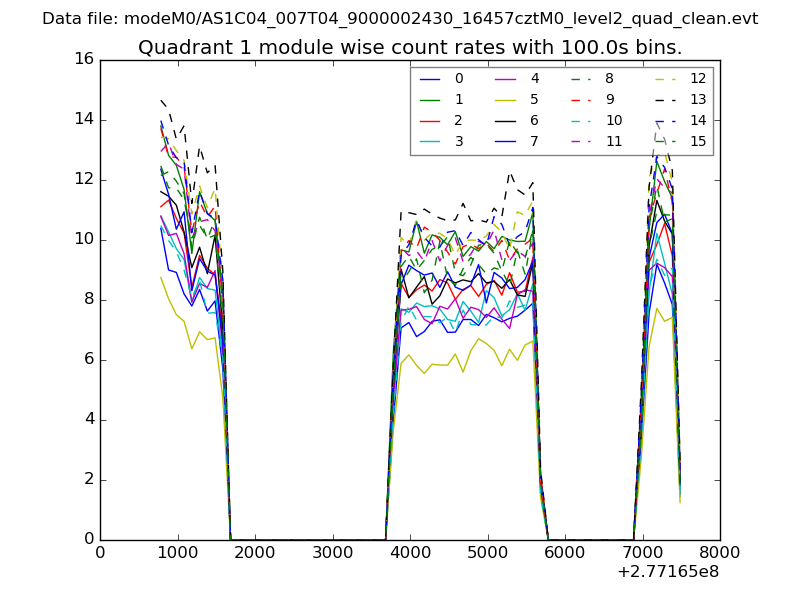
| Module-wise count rates for Quadrant A Data is divided into 100 sec bins |
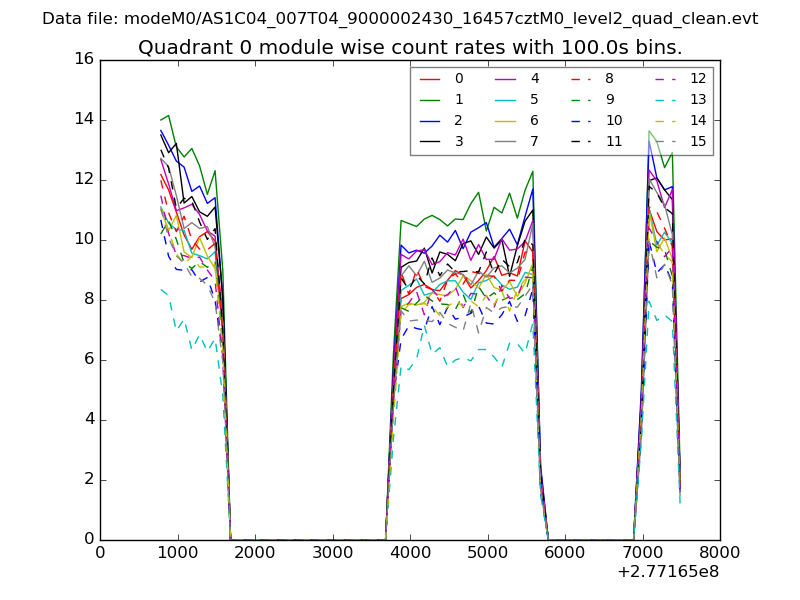 |
 |
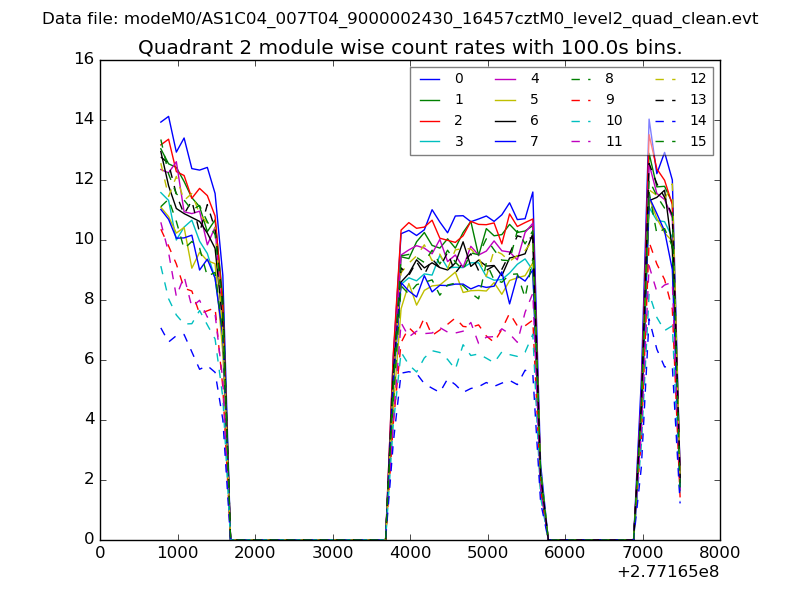
| Module-wise count rates for Quadrant B Data is divided into 100 sec bins |
 |
 |
| Module-wise count rates for Quadrant C Data is divided into 100 sec bins |
 |
 |
| Module-wise count rates for Quadrant D Data is divided into 100 sec bins |
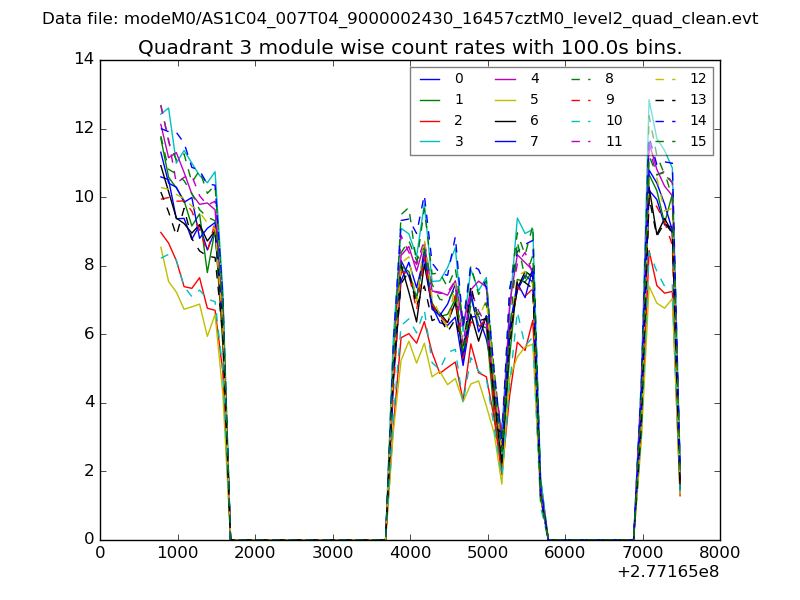 |
 |
| Parameter | Plot |
|---|---|
| CZT HV Monitor | 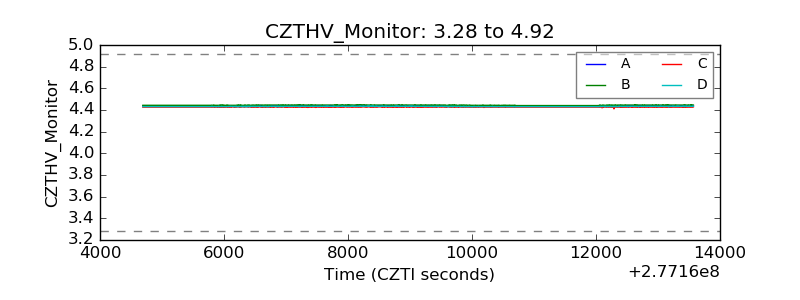 |
| D_VDD | 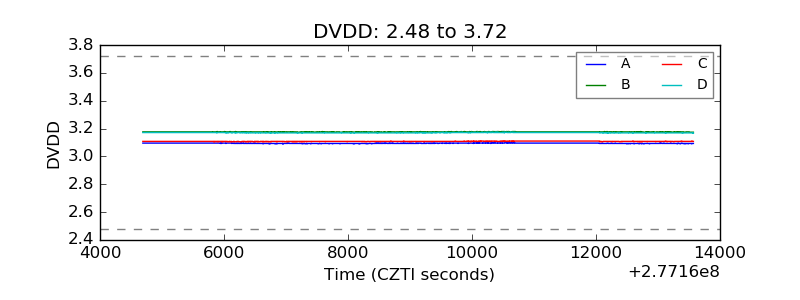 |
| Temperature 1 | 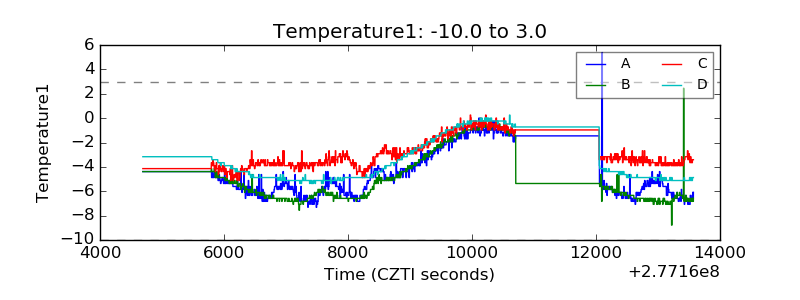 |
| Veto HV Monitor | 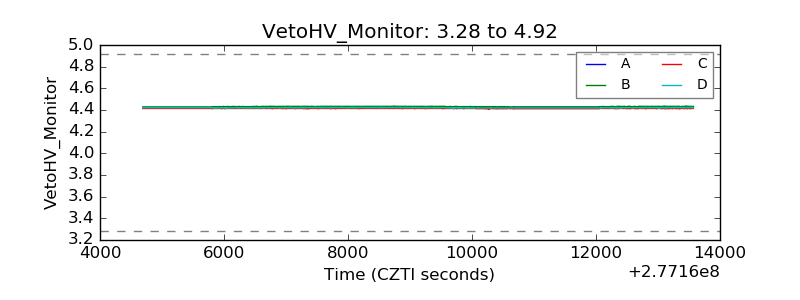 |
| Veto LLD | 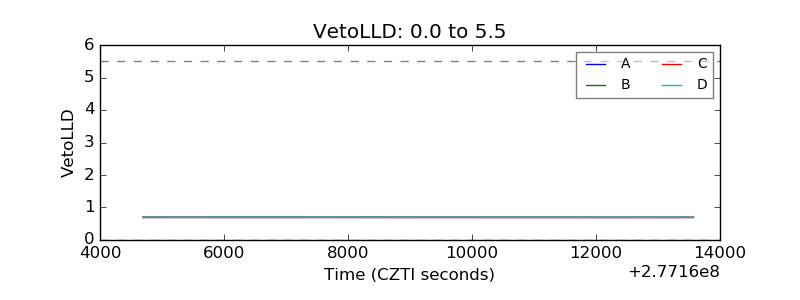 |
| Alpha Counter | 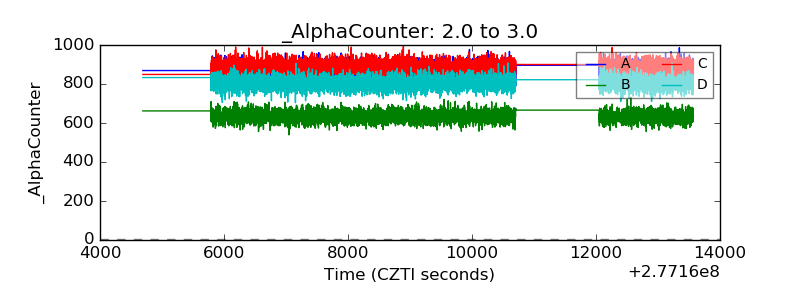 |
| _CPM_Rate | 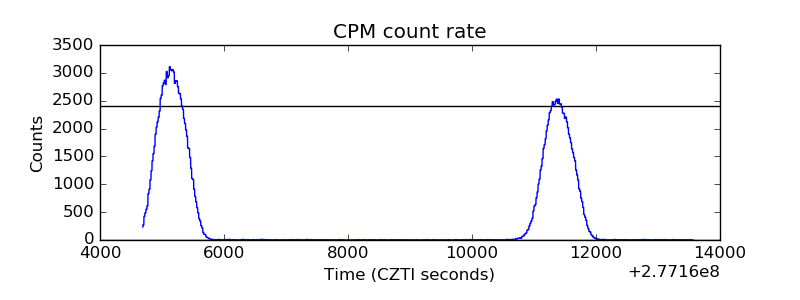 |
| CZT Counter | 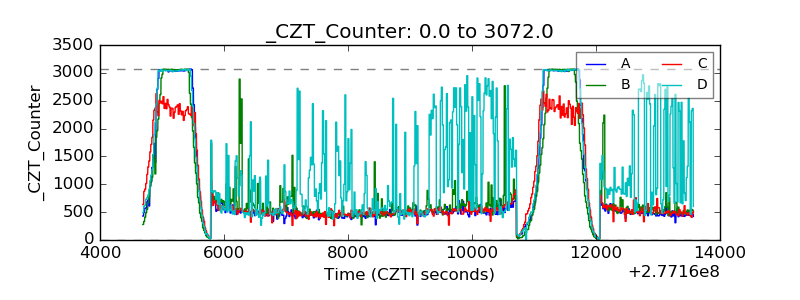 |
| +2.5 Volts monitor |  |
| +5 Volts monitor |  |
| _ROLL_ROT | 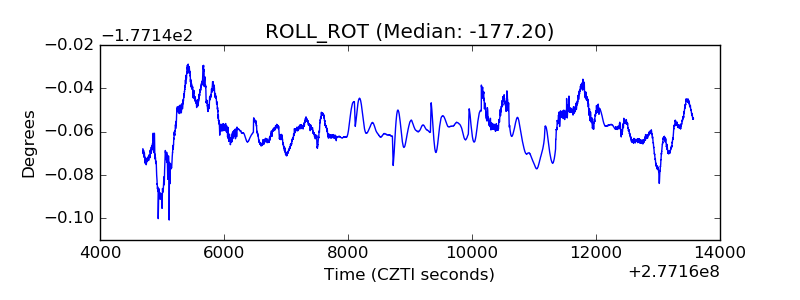 |
| _Roll_DEC |  |
| _Roll_RA | 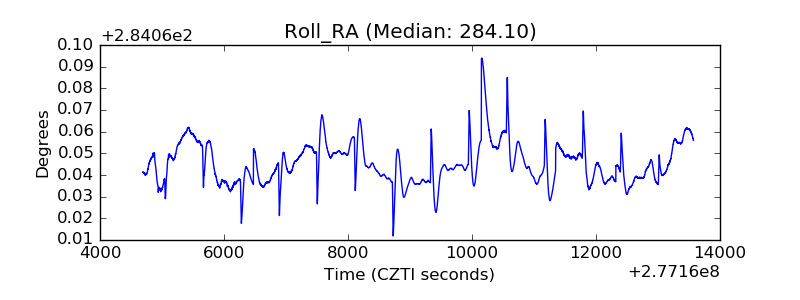 |
| Veto Counter | 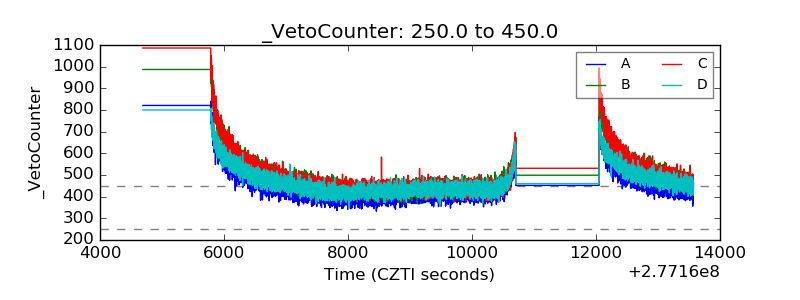 |