| Param | Original file | Final file |
|---|---|---|
| Filename | modeM0/AS1C04_007T04_9000002430_16460cztM0_level2.evt | modeM0/AS1C04_007T04_9000002430_16460cztM0_level2_quad_clean.evt |
| Size (bytes) | 486,797,760 | 76,887,360 |
| Size | 464.2 MB | 73.3 MB |
| Events in quadrant A | 3,328,331 | 463,290 |
| Events in quadrant B | 3,762,990 | 473,168 |
| Events in quadrant C | 3,518,803 | 460,394 |
| Events in quadrant D | 3,664,844 | 451,596 |
| Mode M9 | |||
|---|---|---|---|
| Quadrant | BADHDUFLAG | Total packets | Discarded packets |
| A | 0 | 10 | 0 |
| B | 0 | 10 | 0 |
| C | 0 | 10 | 0 |
| D | 0 | 11 | 0 |
| Mode M0 | |||
|---|---|---|---|
| Quadrant | BADHDUFLAG | Total packets | Discarded packets |
| A | 0 | 14317 | 3 |
| B | 0 | 15330 | 2 |
| C | 0 | 14510 | 2 |
| D | 0 | 15343 | 2 |
| Mode SS | |||
|---|---|---|---|
| Quadrant | BADHDUFLAG | Total packets | Discarded packets |
| A | 0 | 138 | 0 |
| B | 0 | 138 | 0 |
| C | 0 | 138 | 0 |
| D | 0 | 138 | 0 |
| Quadrant | Total seconds | Saturated seconds | Saturation percentage |
|---|---|---|---|
| A | 6891 | 93 | 1.349586% |
| B | 6891 | 141 | 2.046147% |
| C | 6891 | 173 | 2.510521% |
| D | 6891 | 128 | 1.857495% |
Noise dominated data is calculated using 1-second bins in cleaned event files. If a bin has >2000 counts, and if more than 50% of those come from <1% of pixels, then it is considered to be noise-dominated and hence unusable.
| Quadrant | # 1 sec bins | Bins with >0 counts | Bins with >2000 counts | High rate bins dominated by noise | Noise dominated (total time) | Noise dominated (detector-on time) | Marked lightcurve |
|---|---|---|---|---|---|---|---|
| A | 7662 | 6892 | 0 | 0 | 0.00% | 0.00% | 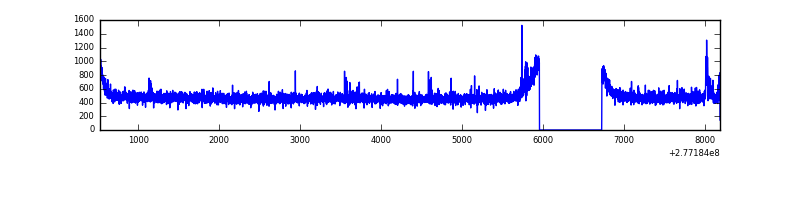 |
| B | 7662 | 6892 | 21 | 21 | 0.27% | 0.30% | 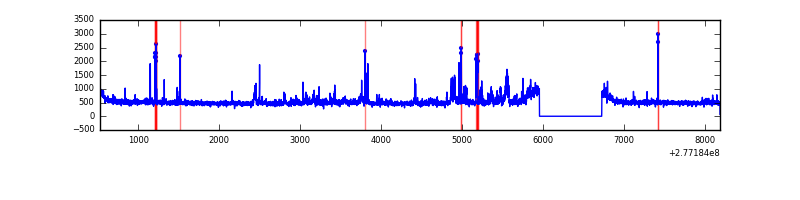 |
| C | 7662 | 6892 | 11 | 11 | 0.14% | 0.16% | 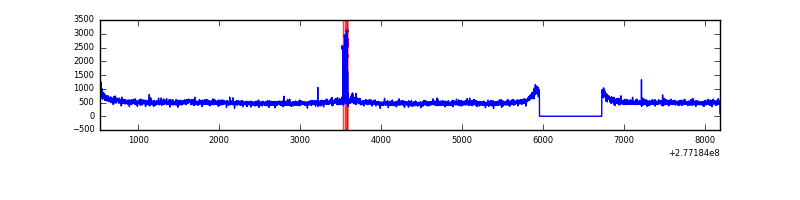 |
| D | 7662 | 6892 | 59 | 59 | 0.77% | 0.86% | 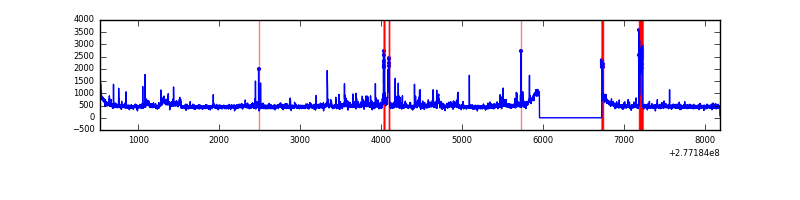 |
Top three noisy pixels from each quadrant. If the there are fewer than three noisy pixels in the level2.evt file, extra rows are filled as -1
| Pixel properties | Quadrant properties | ||||||
|---|---|---|---|---|---|---|---|
| Quadrant | DetID | PixID | Counts | Sigma | Mean | Median | Sigma |
| A | 15 | 174 | 54339 | 311.19 | 850 | 831 | 171.9 |
| A | 0 | 226 | 7416 | 38.3 | 850 | 831 | 171.9 |
| A | 12 | 194 | 6376 | 32.25 | 850 | 831 | 171.9 |
| B | 15 | 35 | 148224 | 900.78 | 854 | 834 | 163.6 |
| B | 0 | 229 | 68375 | 412.78 | 854 | 834 | 163.6 |
| B | 4 | 173 | 64817 | 391.03 | 854 | 834 | 163.6 |
| C | 3 | 233 | 140869 | 730.81 | 821 | 829 | 191.6 |
| C | 14 | 238 | 126318 | 654.88 | 821 | 829 | 191.6 |
| C | 0 | 207 | 37387 | 190.78 | 821 | 829 | 191.6 |
| D | 5 | 222 | 260370 | 1283.57 | 825 | 800 | 202.2 |
| D | 1 | 52 | 115467 | 567.03 | 825 | 800 | 202.2 |
| D | 2 | 33 | 97927 | 480.29 | 825 | 800 | 202.2 |
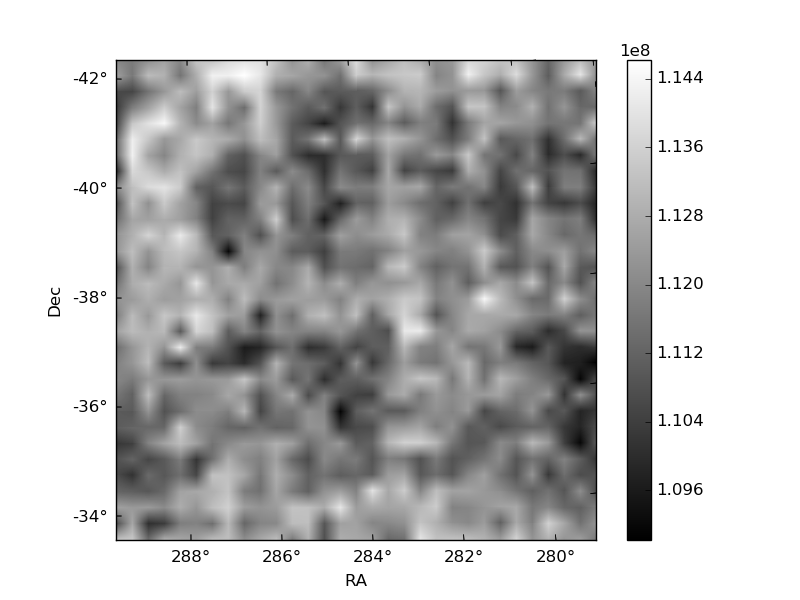
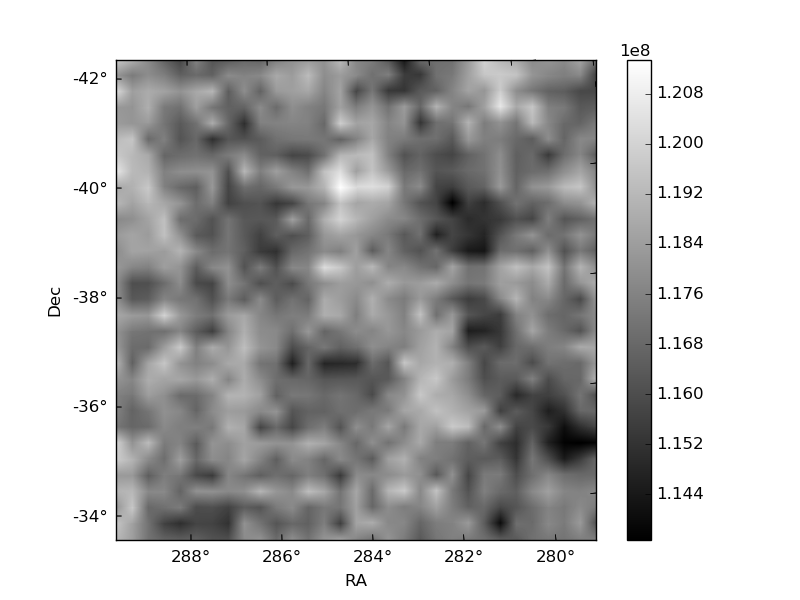
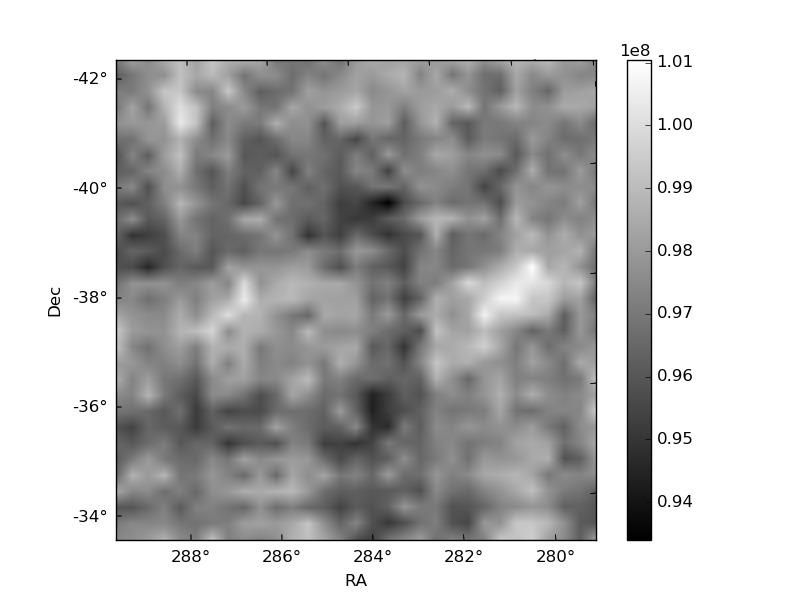
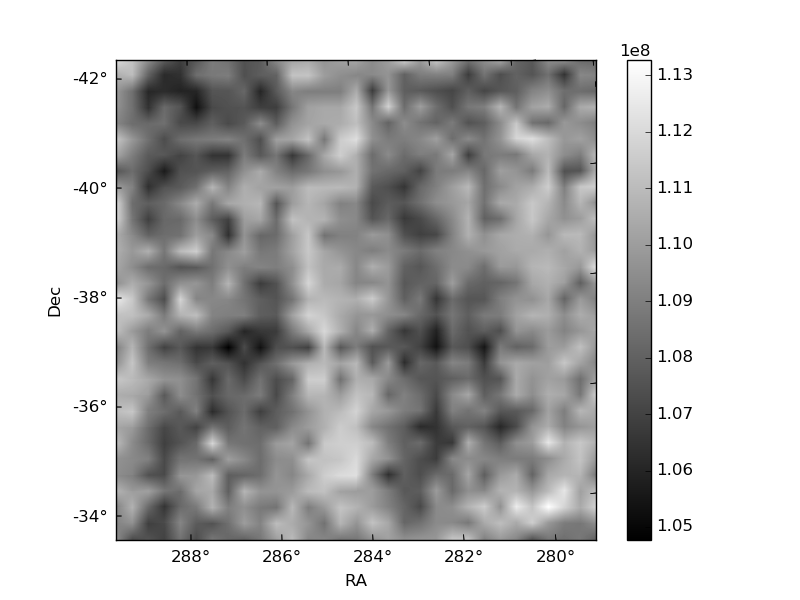
Histogram calculated using DETX and DETY for each event in the final _common_clean file
| Quadrant A | 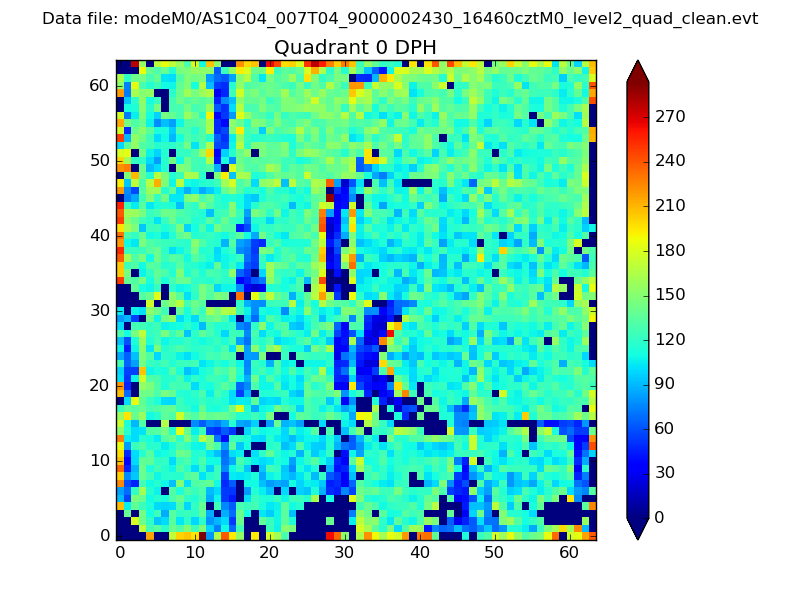 |
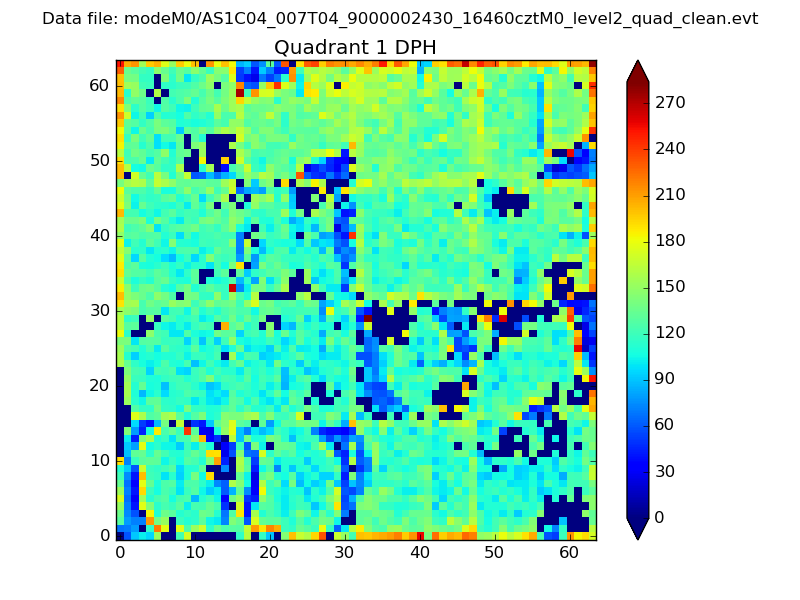 |
Quadrant B |
|---|---|---|---|
| Quadrant D | 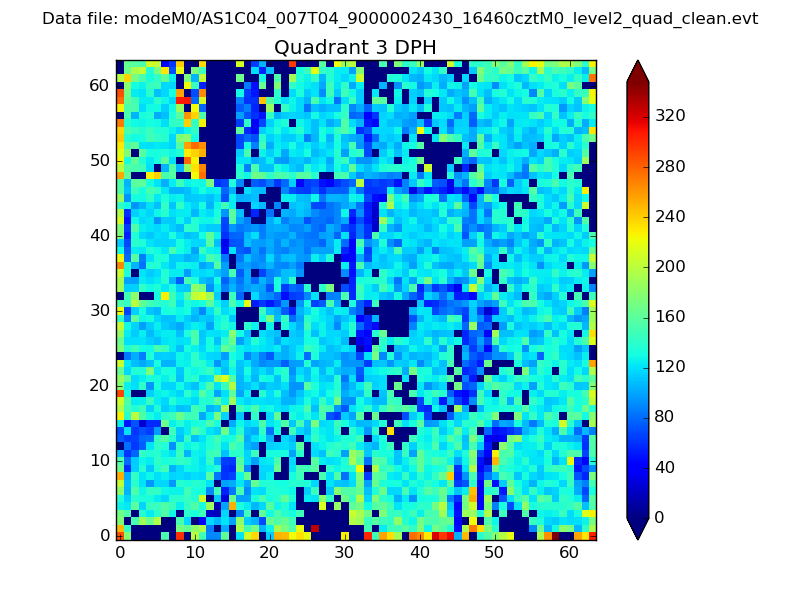 |
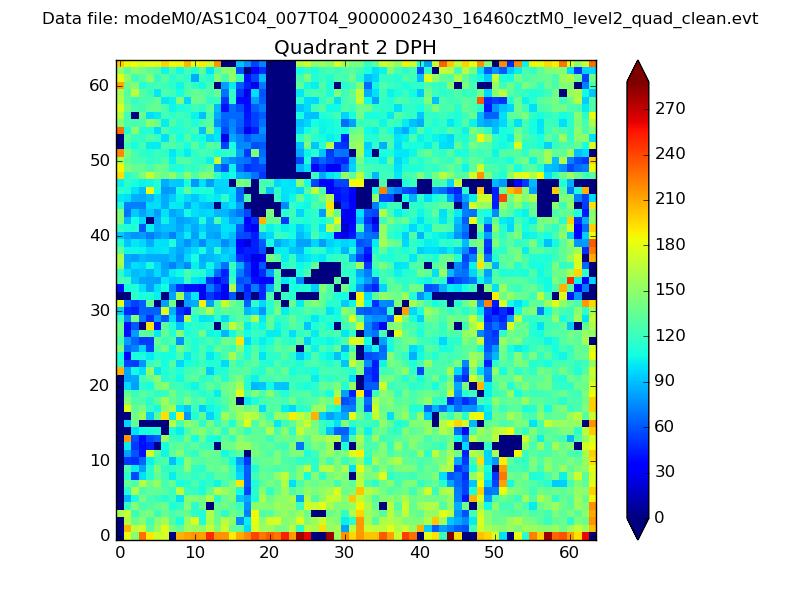 |
Quadrant C |
| Plot type | Count rate plots | Images |
|---|---|---|
| Comparison with Poisson distribution Blue bars denote a histogram of data divided into 1 sec bins. Red curve is a Poisson curve with rate = median count rate of data. |
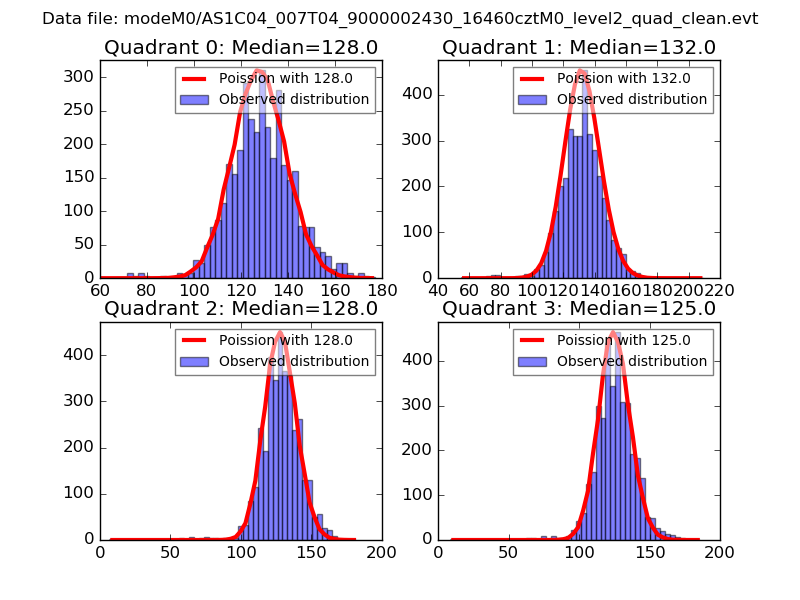 |
 |
| Quadrant-wise count rates Data is divided into 100 sec bins |
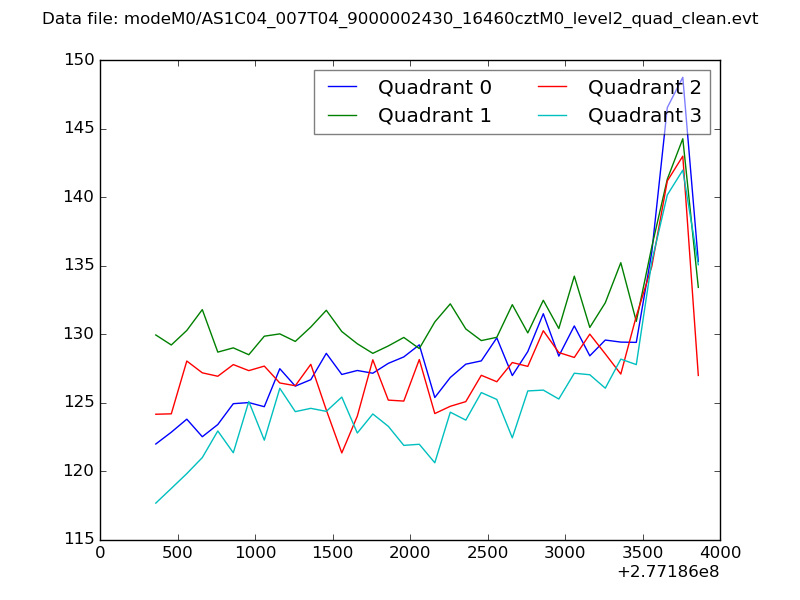 |
|
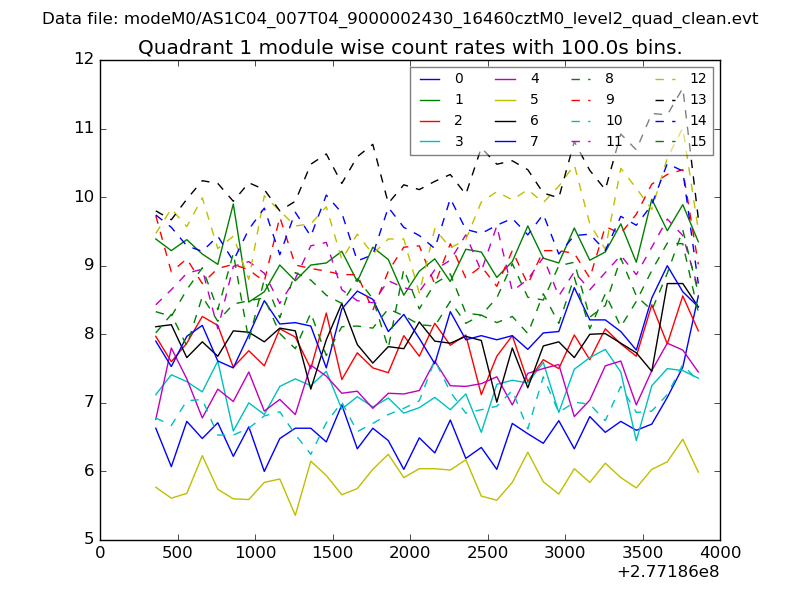
| Module-wise count rates for Quadrant A Data is divided into 100 sec bins |
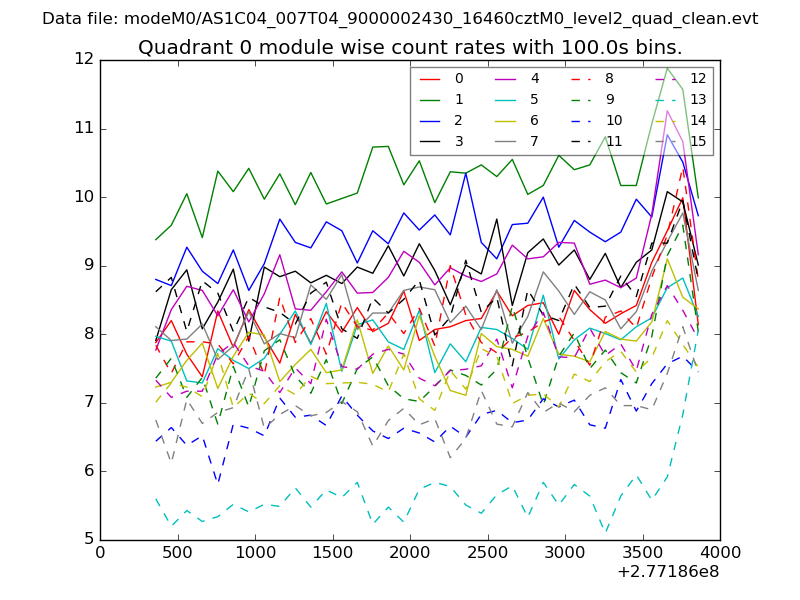 |
 |
| Module-wise count rates for Quadrant B Data is divided into 100 sec bins |
 |
 |
| Module-wise count rates for Quadrant C Data is divided into 100 sec bins |
 |
 |
| Module-wise count rates for Quadrant D Data is divided into 100 sec bins |
 |
 |
| Parameter | Plot |
|---|---|
| CZT HV Monitor | 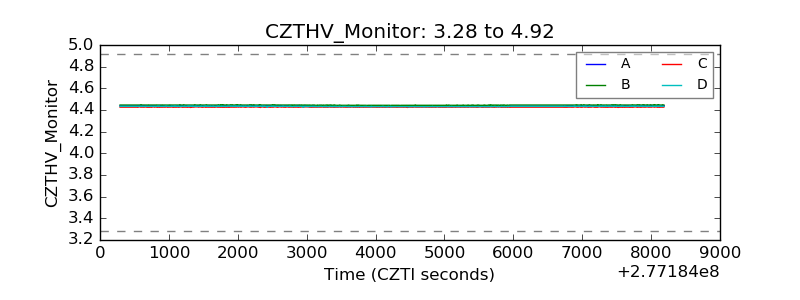 |
| D_VDD |  |
| Temperature 1 | 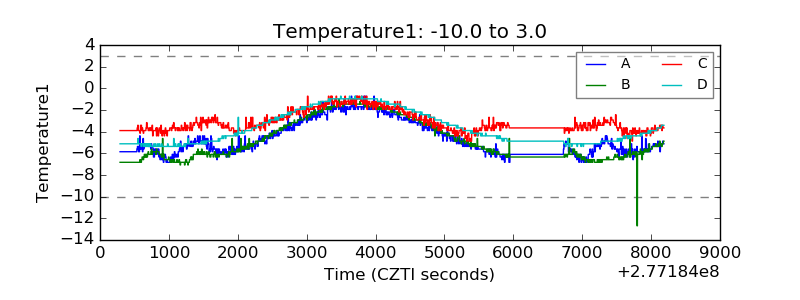 |
| Veto HV Monitor | 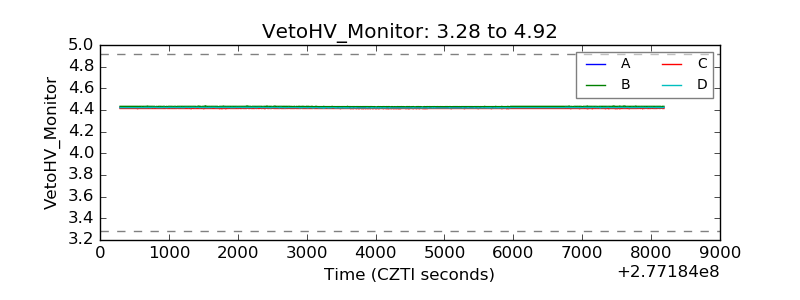 |
| Veto LLD |  |
| Alpha Counter | 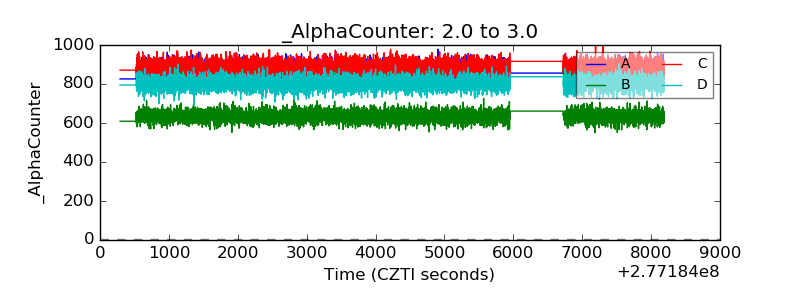 |
| _CPM_Rate | 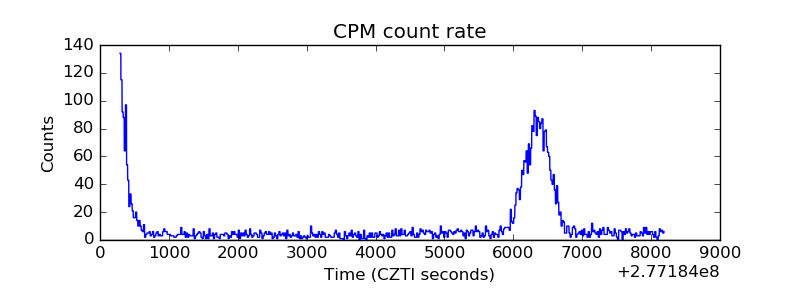 |
| CZT Counter | 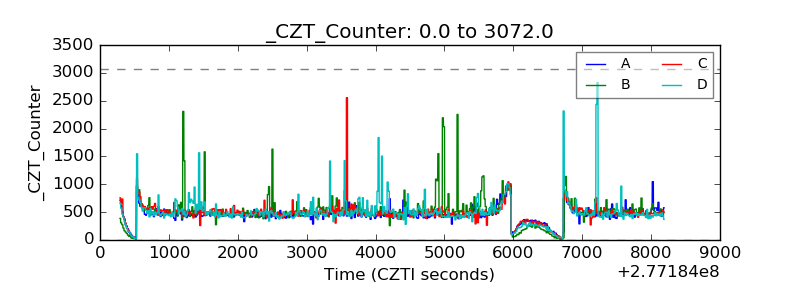 |
| +2.5 Volts monitor |  |
| +5 Volts monitor | 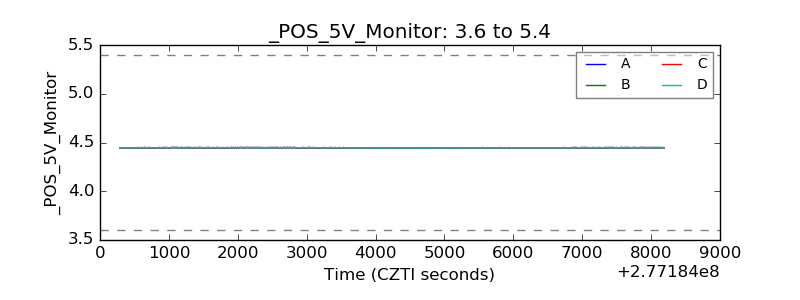 |
| _ROLL_ROT | 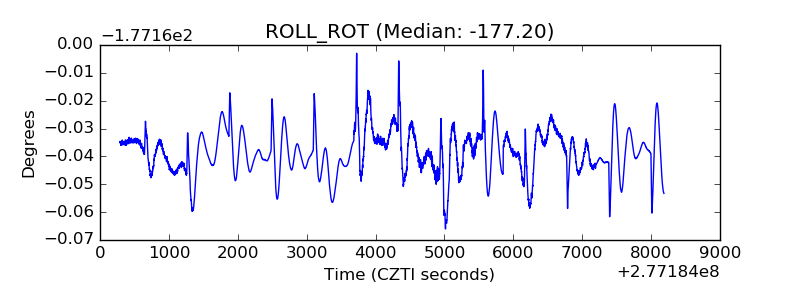 |
| _Roll_DEC | 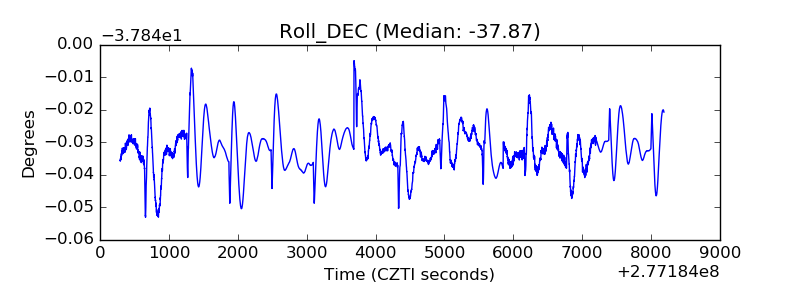 |
| _Roll_RA | 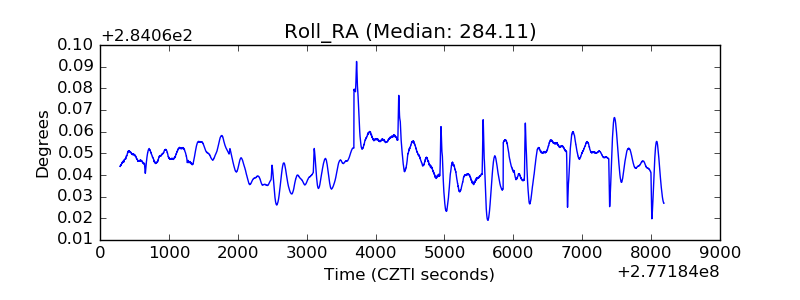 |
| Veto Counter |  |