| Param | Original file | Final file |
|---|---|---|
| Filename | modeM0/AS1C04_007T04_9000002430_16461cztM0_level2.evt | modeM0/AS1C04_007T04_9000002430_16461cztM0_level2_quad_clean.evt |
| Size (bytes) | 549,106,560 | 86,143,680 |
| Size | 523.7 MB | 82.2 MB |
| Events in quadrant A | 4,035,759 | 521,623 |
| Events in quadrant B | 4,136,717 | 534,736 |
| Events in quadrant C | 3,969,906 | 521,544 |
| Events in quadrant D | 3,977,240 | 507,790 |
| Mode M9 | |||
|---|---|---|---|
| Quadrant | BADHDUFLAG | Total packets | Discarded packets |
| A | 0 | 12 | 0 |
| B | 0 | 12 | 0 |
| C | 0 | 12 | 0 |
| D | 0 | 12 | 0 |
| Mode M0 | |||
|---|---|---|---|
| Quadrant | BADHDUFLAG | Total packets | Discarded packets |
| A | 0 | 16867 | 3 |
| B | 0 | 16893 | 2 |
| C | 0 | 16300 | 2 |
| D | 0 | 16938 | 2 |
| Mode SS | |||
|---|---|---|---|
| Quadrant | BADHDUFLAG | Total packets | Discarded packets |
| A | 0 | 156 | 0 |
| B | 0 | 156 | 0 |
| C | 0 | 156 | 0 |
| D | 0 | 156 | 0 |
| Quadrant | Total seconds | Saturated seconds | Saturation percentage |
|---|---|---|---|
| A | 7515 | 243 | 3.233533% |
| B | 7515 | 283 | 3.765802% |
| C | 7515 | 337 | 4.484365% |
| D | 7515 | 268 | 3.566201% |
Noise dominated data is calculated using 1-second bins in cleaned event files. If a bin has >2000 counts, and if more than 50% of those come from <1% of pixels, then it is considered to be noise-dominated and hence unusable.
| Quadrant | # 1 sec bins | Bins with >0 counts | Bins with >2000 counts | High rate bins dominated by noise | Noise dominated (total time) | Noise dominated (detector-on time) | Marked lightcurve |
|---|---|---|---|---|---|---|---|
| A | 8636 | 7516 | 24 | 24 | 0.28% | 0.32% | 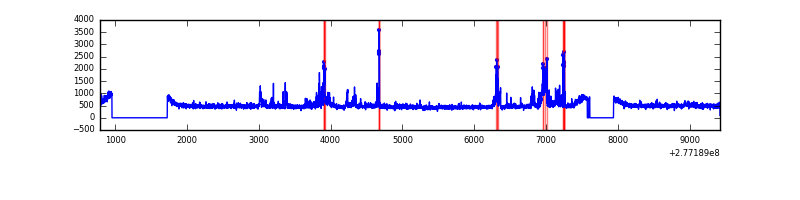 |
| B | 8636 | 7516 | 16 | 16 | 0.19% | 0.21% | 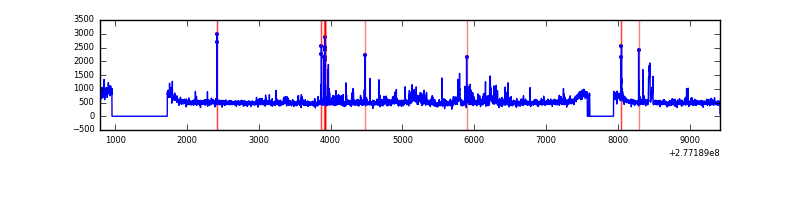 |
| C | 8636 | 7516 | 41 | 41 | 0.47% | 0.55% | 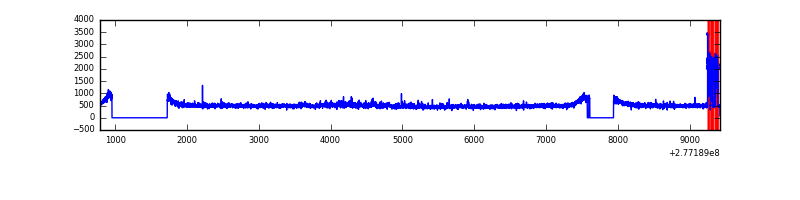 |
| D | 8636 | 7516 | 93 | 93 | 1.08% | 1.24% | 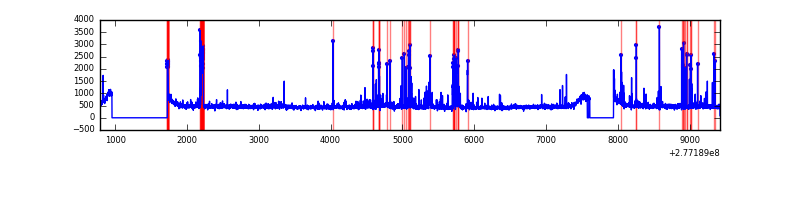 |
Top three noisy pixels from each quadrant. If the there are fewer than three noisy pixels in the level2.evt file, extra rows are filled as -1
| Pixel properties | Quadrant properties | ||||||
|---|---|---|---|---|---|---|---|
| Quadrant | DetID | PixID | Counts | Sigma | Mean | Median | Sigma |
| A | 15 | 174 | 450198 | 2369.03 | 931 | 908 | 189.7 |
| A | 3 | 1 | 9160 | 43.51 | 931 | 908 | 189.7 |
| A | 0 | 226 | 8034 | 37.57 | 931 | 908 | 189.7 |
| B | 0 | 198 | 135416 | 744.2 | 935 | 911 | 180.7 |
| B | 15 | 35 | 109310 | 599.76 | 935 | 911 | 180.7 |
| B | 4 | 173 | 92849 | 508.68 | 935 | 911 | 180.7 |
| C | 7 | 247 | 175456 | 827.75 | 898 | 905 | 210.9 |
| C | 3 | 233 | 151988 | 716.46 | 898 | 905 | 210.9 |
| C | 14 | 238 | 135272 | 637.19 | 898 | 905 | 210.9 |
| D | 5 | 222 | 193893 | 863.07 | 904 | 875 | 223.6 |
| D | 2 | 33 | 144684 | 643.03 | 904 | 875 | 223.6 |
| D | 1 | 52 | 117103 | 519.71 | 904 | 875 | 223.6 |
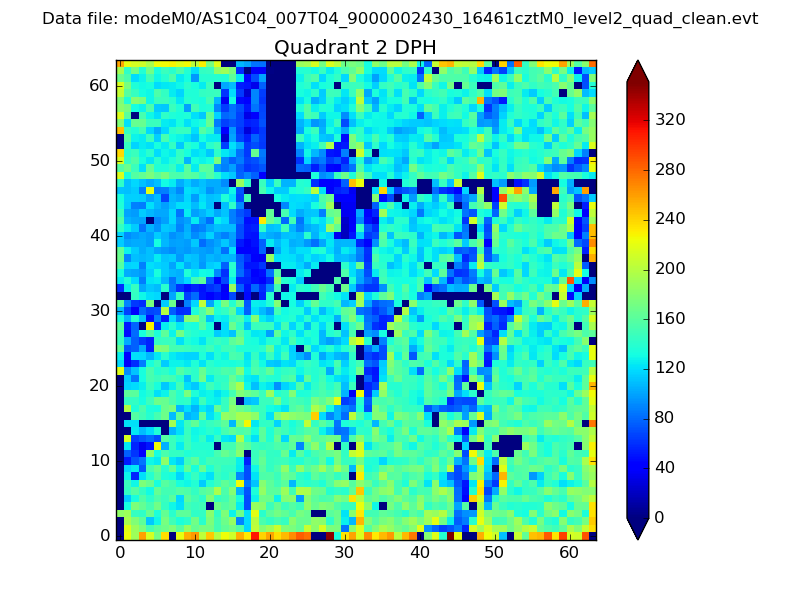
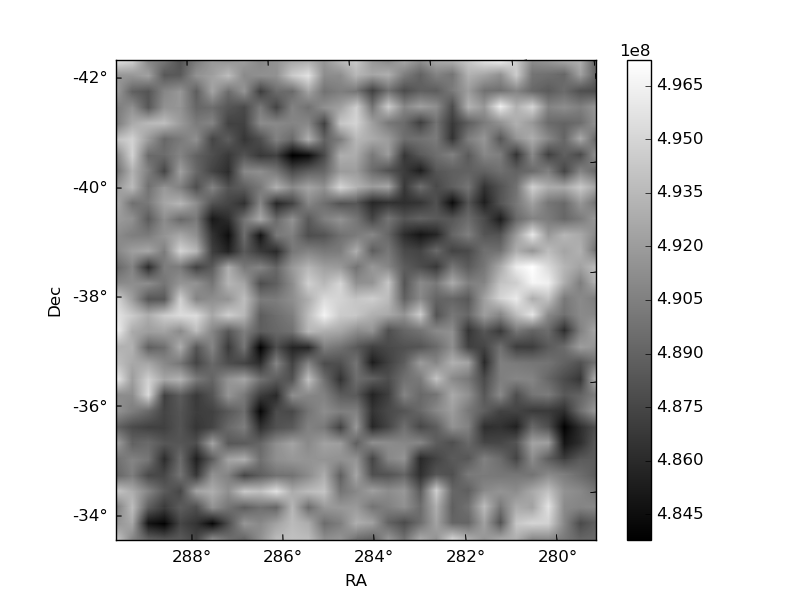
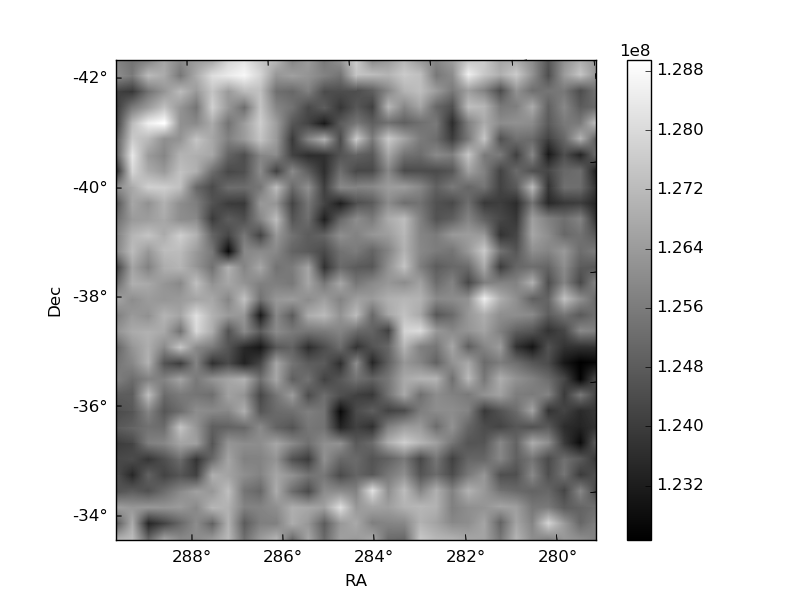
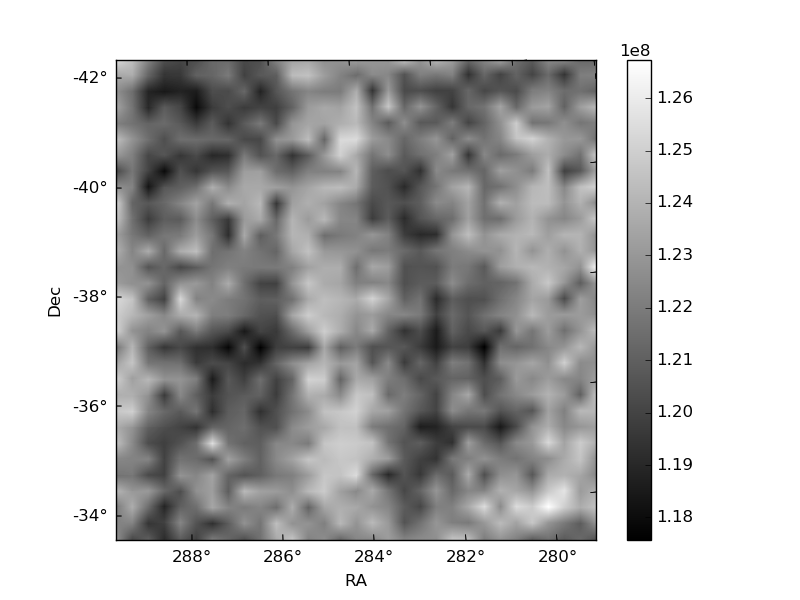
Histogram calculated using DETX and DETY for each event in the final _common_clean file
| Quadrant A | 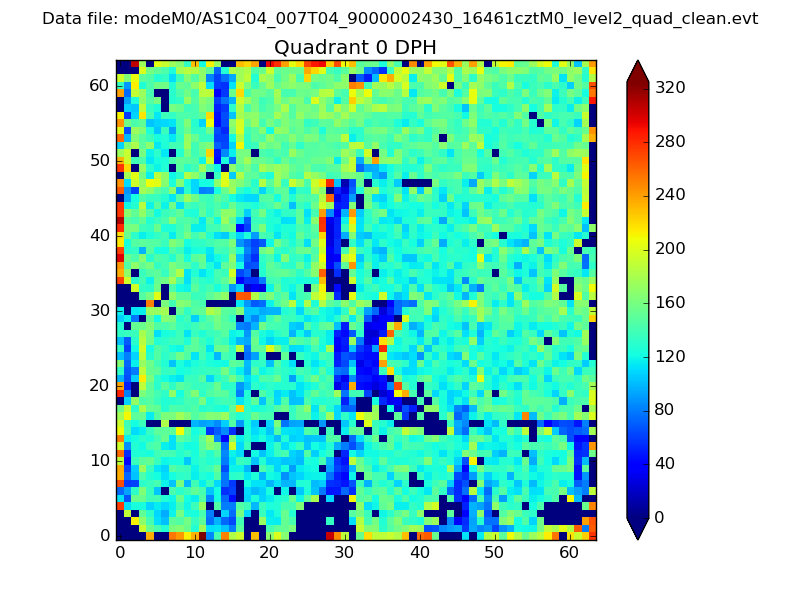 |
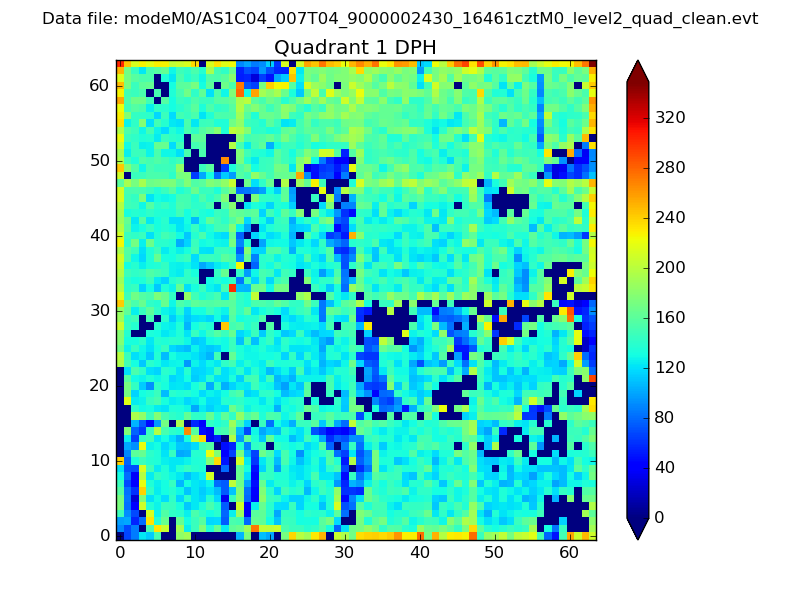 |
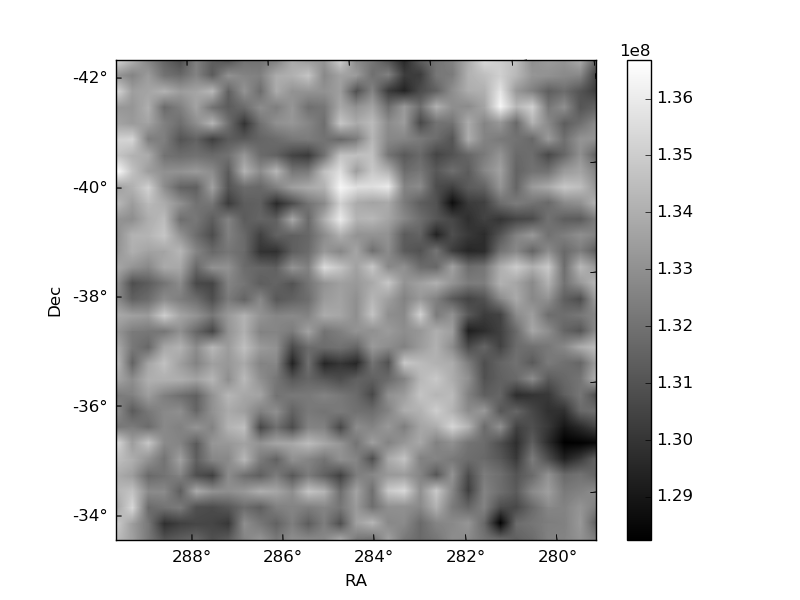
Quadrant B |
|---|---|---|---|
| Quadrant D | 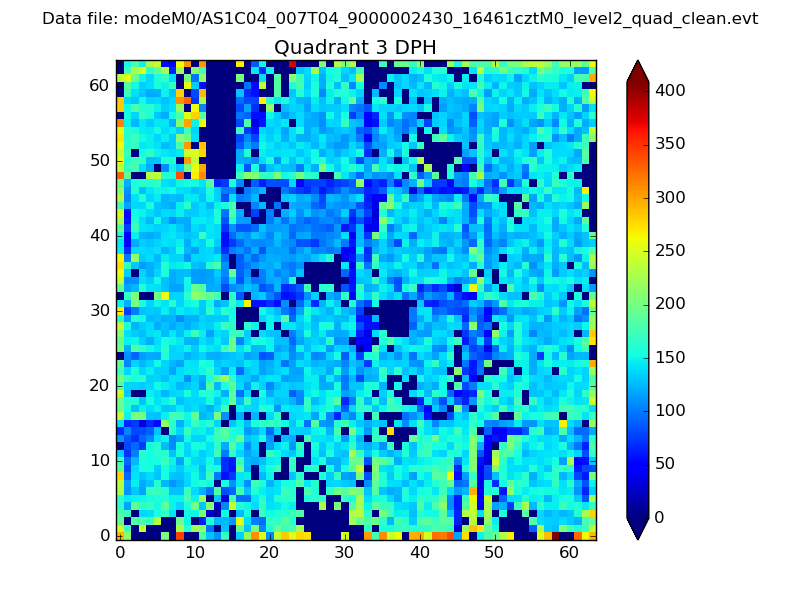 |
 |
Quadrant C |
| Plot type | Count rate plots | Images |
|---|---|---|
| Comparison with Poisson distribution Blue bars denote a histogram of data divided into 1 sec bins. Red curve is a Poisson curve with rate = median count rate of data. |
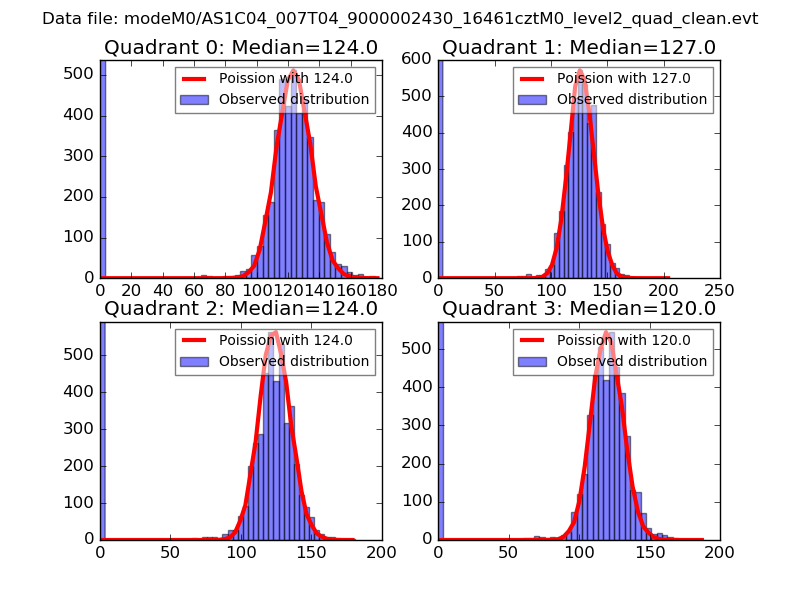 |
 |
| Quadrant-wise count rates Data is divided into 100 sec bins |
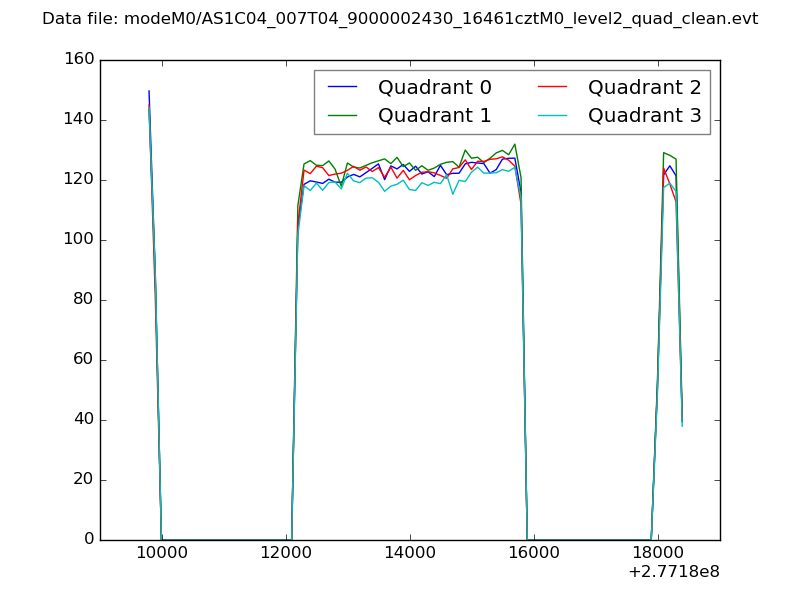 |
|
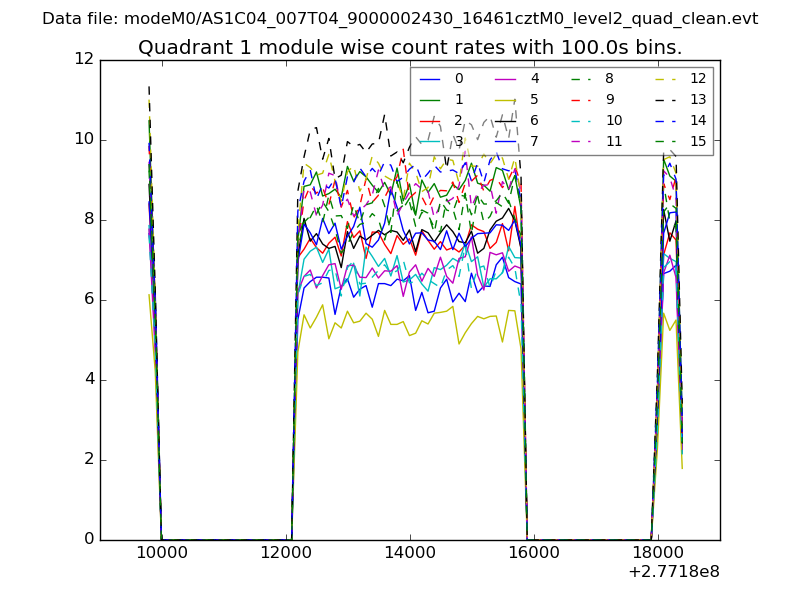
| Module-wise count rates for Quadrant A Data is divided into 100 sec bins |
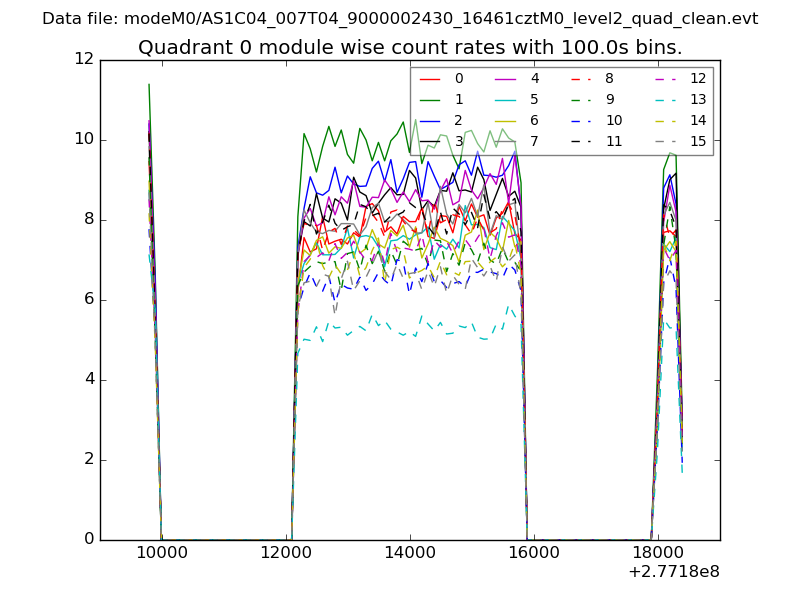 |
 |
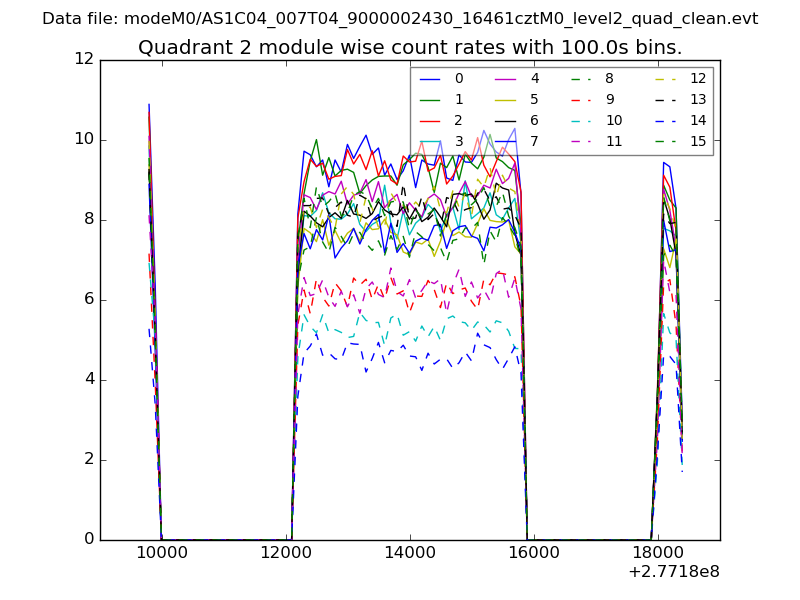
| Module-wise count rates for Quadrant B Data is divided into 100 sec bins |
 |
 |
| Module-wise count rates for Quadrant C Data is divided into 100 sec bins |
 |
 |
| Module-wise count rates for Quadrant D Data is divided into 100 sec bins |
 |
 |
| Parameter | Plot |
|---|---|
| CZT HV Monitor | 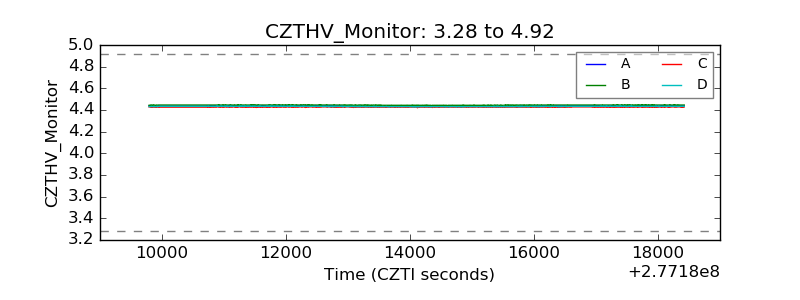 |
| D_VDD | 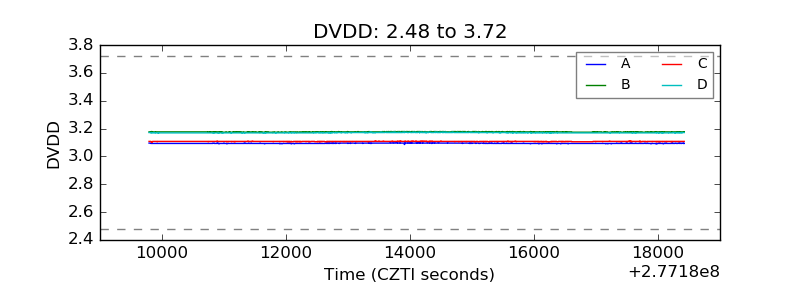 |
| Temperature 1 | 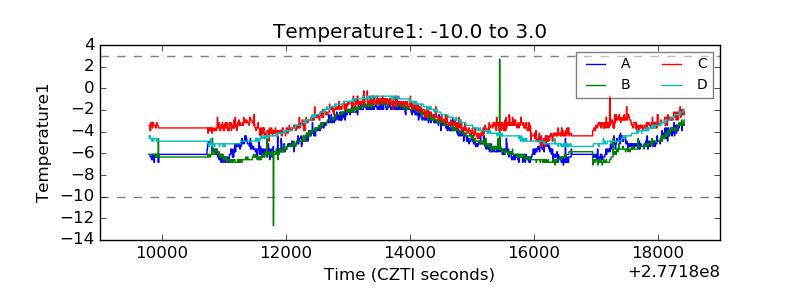 |
| Veto HV Monitor | 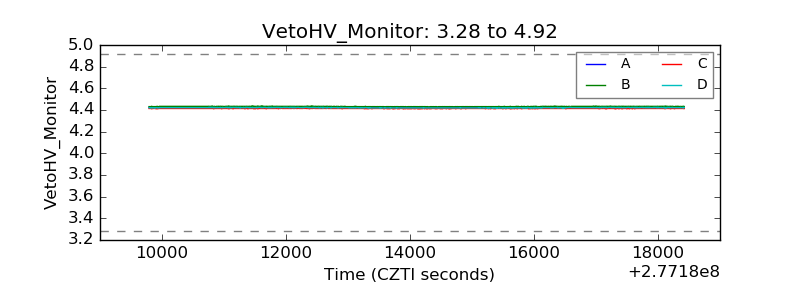 |
| Veto LLD | 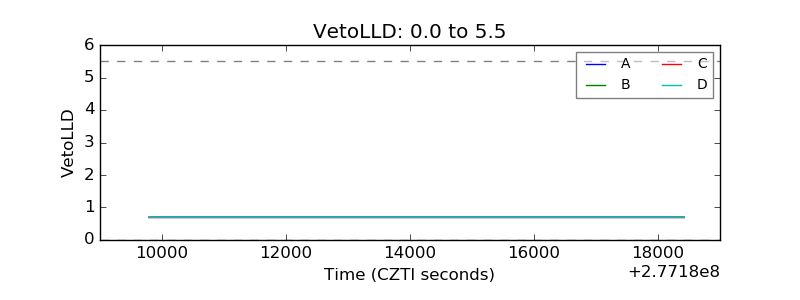 |
| Alpha Counter | 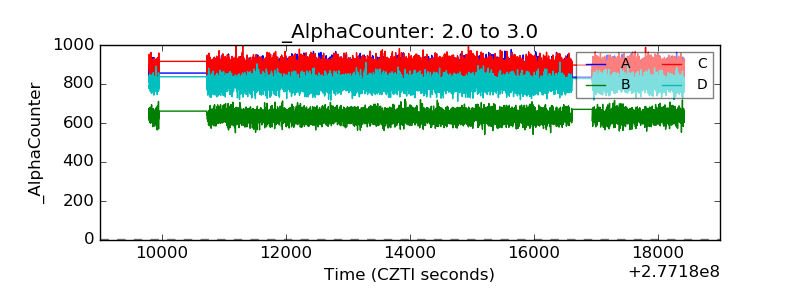 |
| _CPM_Rate | 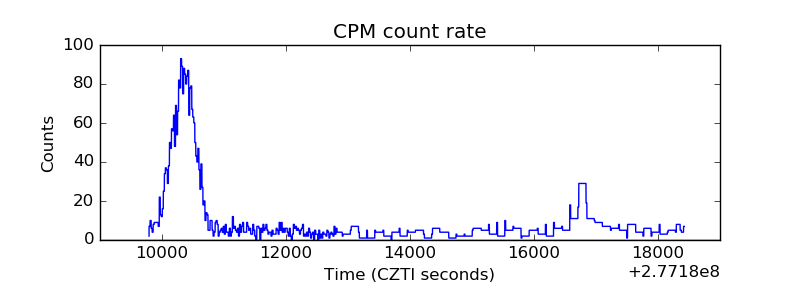 |
| CZT Counter | 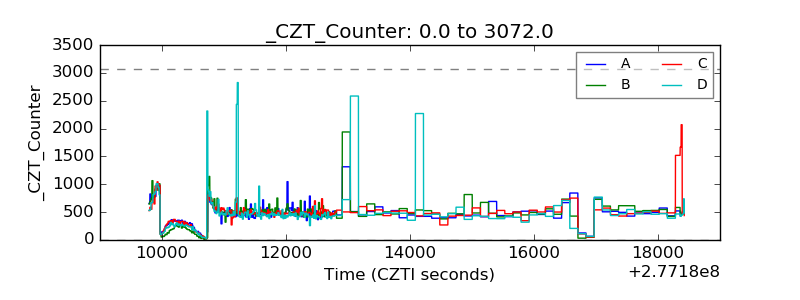 |
| +2.5 Volts monitor | 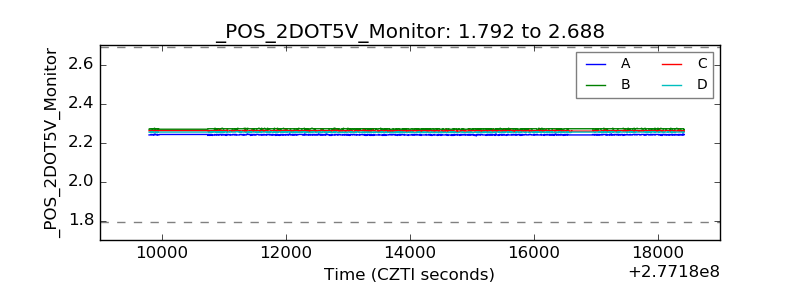 |
| +5 Volts monitor |  |
| _ROLL_ROT | 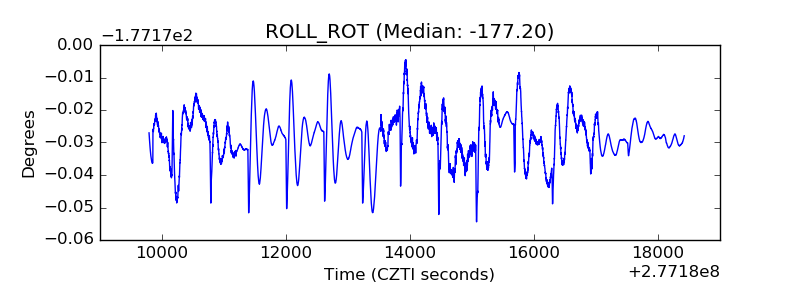 |
| _Roll_DEC |  |
| _Roll_RA | 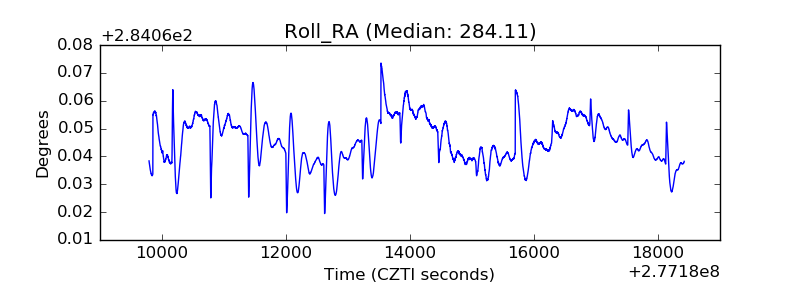 |
| Veto Counter |  |