| Param | Original file | Final file |
|---|---|---|
| Filename | modeM0/AS1C04_007T04_9000002430_16462cztM0_level2.evt | modeM0/AS1C04_007T04_9000002430_16462cztM0_level2_quad_clean.evt |
| Size (bytes) | 324,400,320 | 60,376,320 |
| Size | 309.4 MB | 57.6 MB |
| Events in quadrant A | 2,331,725 | 382,441 |
| Events in quadrant B | 2,724,095 | 387,714 |
| Events in quadrant C | 2,186,574 | 385,251 |
| Events in quadrant D | 2,289,020 | 370,109 |
| Mode M0 | |||
|---|---|---|---|
| Quadrant | BADHDUFLAG | Total packets | Discarded packets |
| A | 0 | 9800 | 1 |
| B | 0 | 10769 | 1 |
| C | 0 | 9332 | 1 |
| D | 0 | 9862 | 1 |
| Mode SS | |||
|---|---|---|---|
| Quadrant | BADHDUFLAG | Total packets | Discarded packets |
| A | 0 | 86 | 0 |
| B | 0 | 86 | 0 |
| C | 0 | 86 | 0 |
| D | 0 | 86 | 0 |
| Quadrant | Total seconds | Saturated seconds | Saturation percentage |
|---|---|---|---|
| A | 4297 | 93 | 2.164301% |
| B | 4297 | 154 | 3.583896% |
| C | 4297 | 123 | 2.862462% |
| D | 4297 | 131 | 3.048639% |
Noise dominated data is calculated using 1-second bins in cleaned event files. If a bin has >2000 counts, and if more than 50% of those come from <1% of pixels, then it is considered to be noise-dominated and hence unusable.
| Quadrant | # 1 sec bins | Bins with >0 counts | Bins with >2000 counts | High rate bins dominated by noise | Noise dominated (total time) | Noise dominated (detector-on time) | Marked lightcurve |
|---|---|---|---|---|---|---|---|
| A | 4298 | 4298 | 65 | 65 | 1.51% | 1.51% | 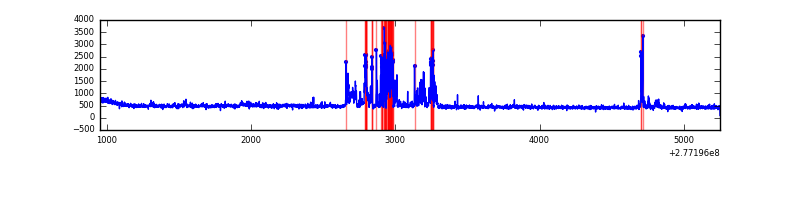 |
| B | 4298 | 4298 | 93 | 93 | 2.16% | 2.16% | 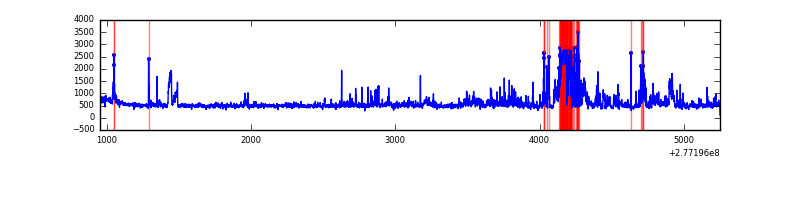 |
| C | 4298 | 4298 | 47 | 47 | 1.09% | 1.09% | 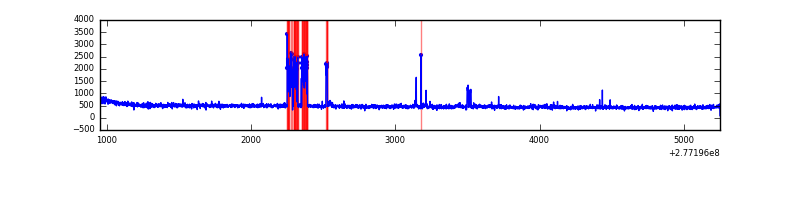 |
| D | 4298 | 4298 | 94 | 94 | 2.19% | 2.19% | 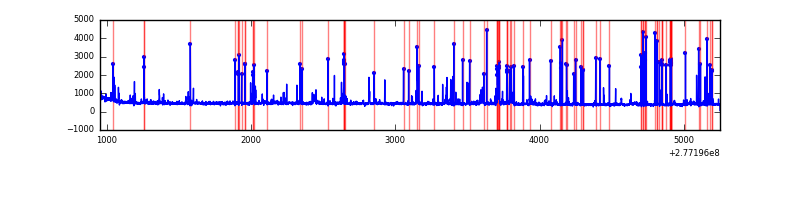 |
Top three noisy pixels from each quadrant. If the there are fewer than three noisy pixels in the level2.evt file, extra rows are filled as -1
| Pixel properties | Quadrant properties | ||||||
|---|---|---|---|---|---|---|---|
| Quadrant | DetID | PixID | Counts | Sigma | Mean | Median | Sigma |
| A | 15 | 174 | 401941 | 3883.17 | 501 | 488 | 103.4 |
| A | 0 | 226 | 4385 | 37.69 | 501 | 488 | 103.4 |
| A | 12 | 194 | 3821 | 32.24 | 501 | 488 | 103.4 |
| B | 7 | 220 | 294132 | 3041.74 | 499 | 487 | 96.5 |
| B | 15 | 35 | 185134 | 1912.67 | 499 | 487 | 96.5 |
| B | 0 | 198 | 85949 | 885.26 | 499 | 487 | 96.5 |
| C | 7 | 247 | 193906 | 1708.03 | 481 | 483 | 113.2 |
| C | 14 | 238 | 74768 | 655.97 | 481 | 483 | 113.2 |
| C | 3 | 233 | 32679 | 284.3 | 481 | 483 | 113.2 |
| D | 1 | 52 | 371157 | 3094.57 | 483 | 469 | 119.8 |
| D | 2 | 33 | 29718 | 244.17 | 483 | 469 | 119.8 |
| D | 12 | 218 | 24697 | 202.26 | 483 | 469 | 119.8 |
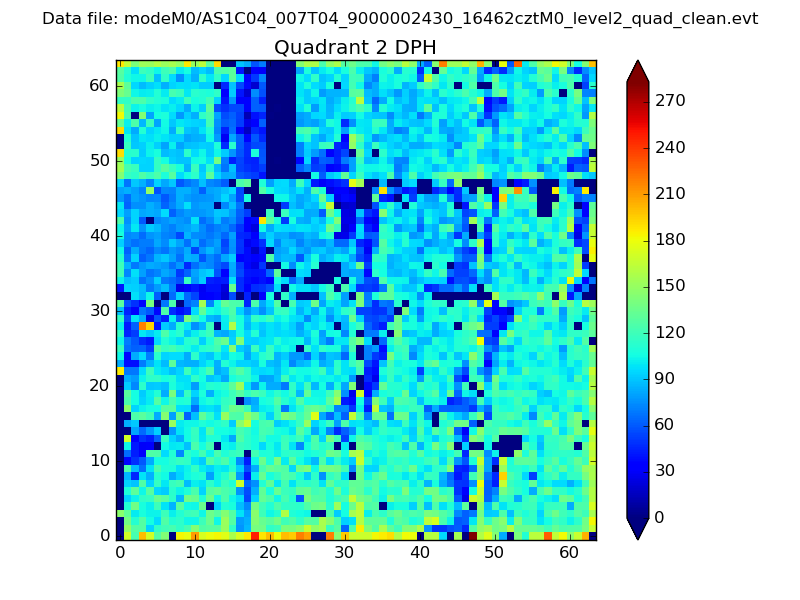
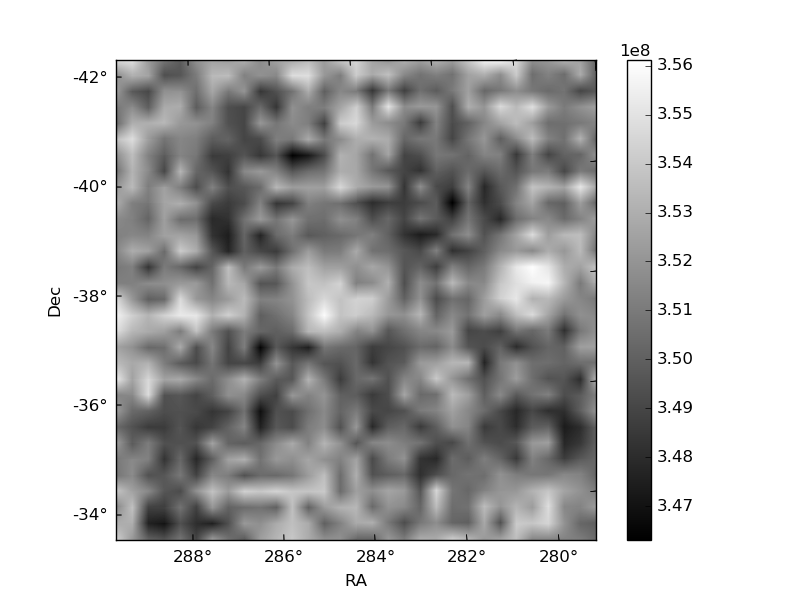
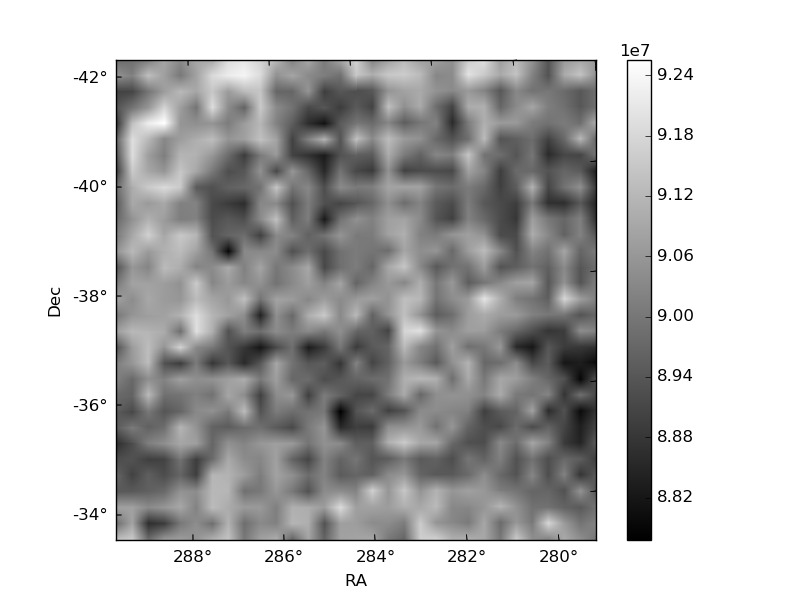
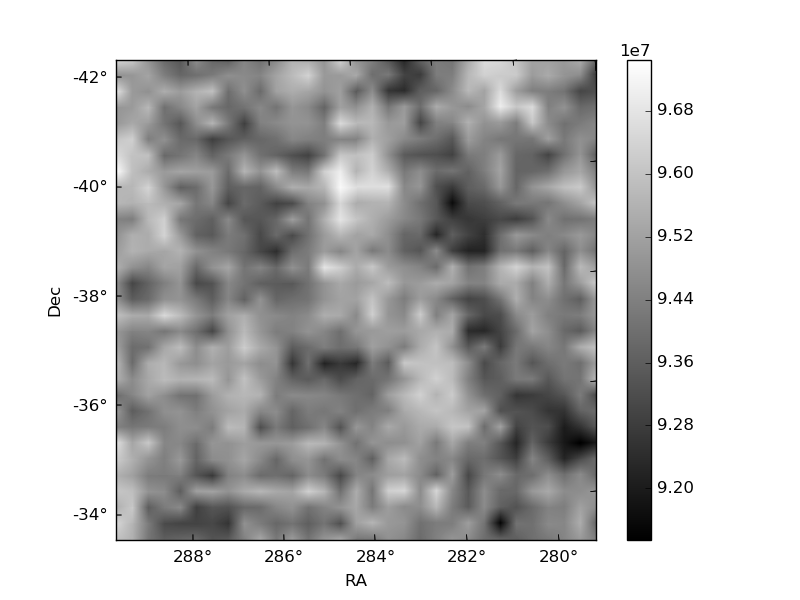
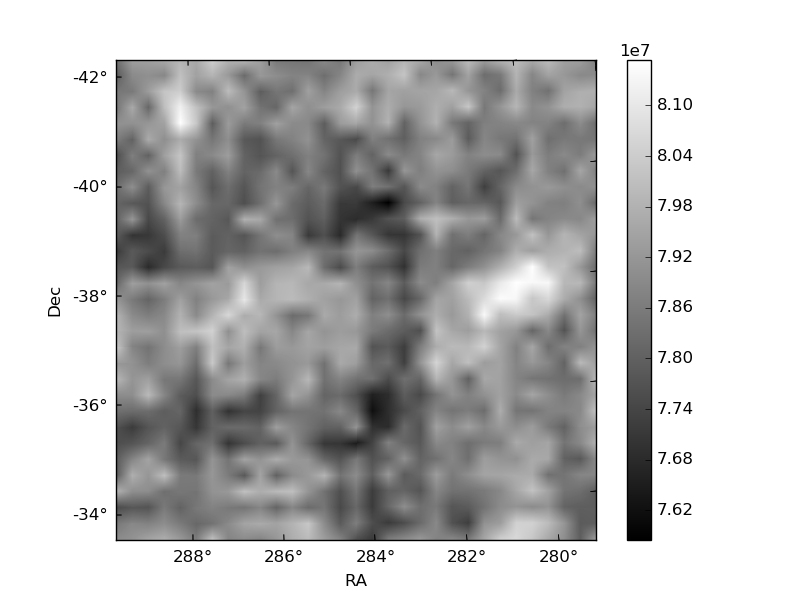
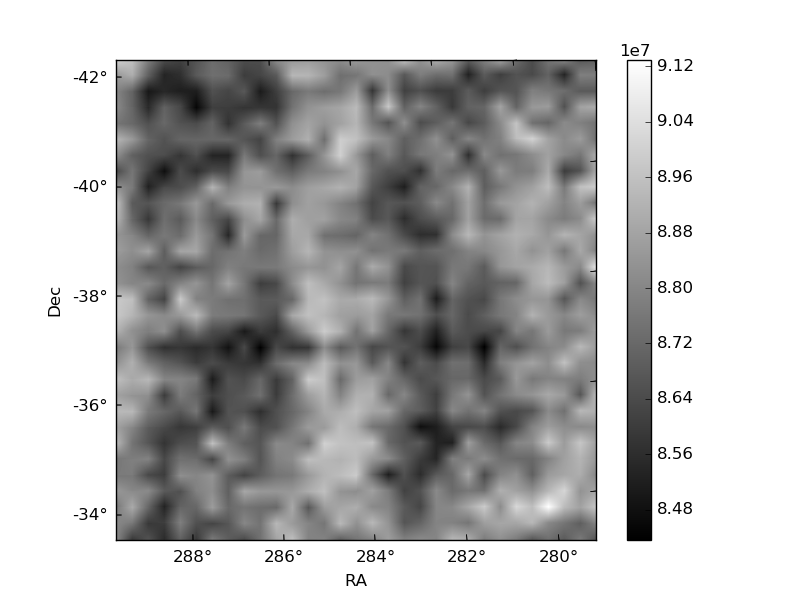
Histogram calculated using DETX and DETY for each event in the final _common_clean file
| Quadrant A | 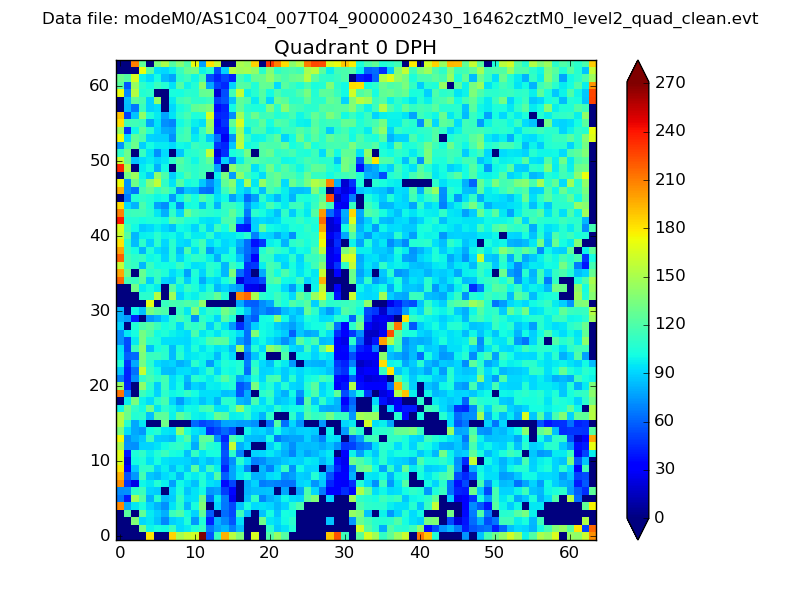 |
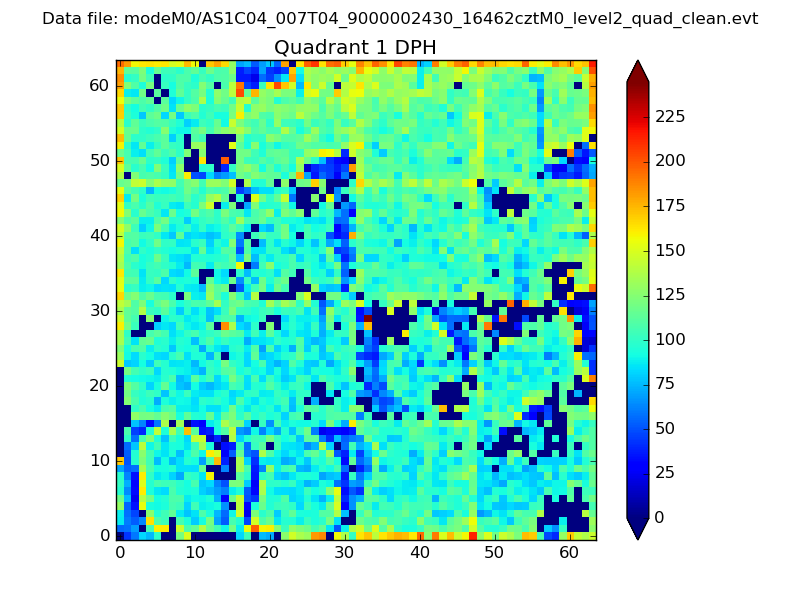 |
Quadrant B |
|---|---|---|---|
| Quadrant D | 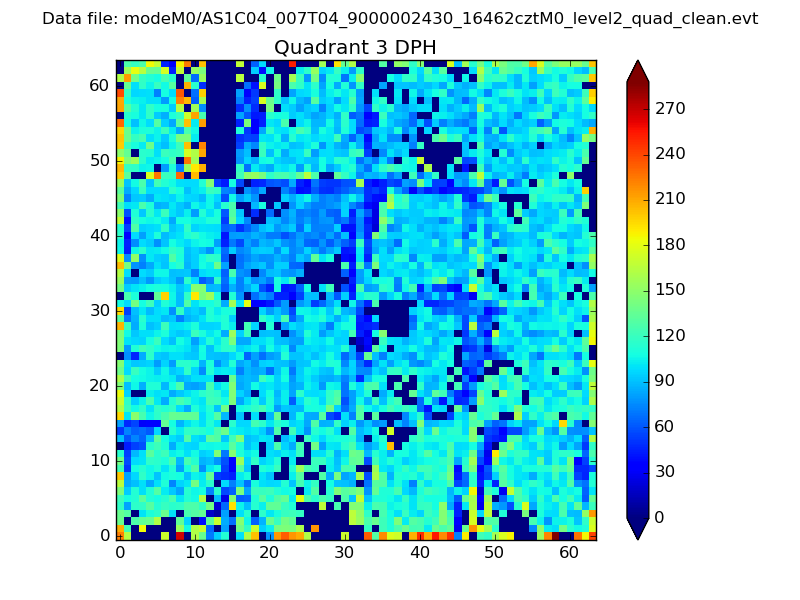 |
 |
Quadrant C |
| Plot type | Count rate plots | Images |
|---|---|---|
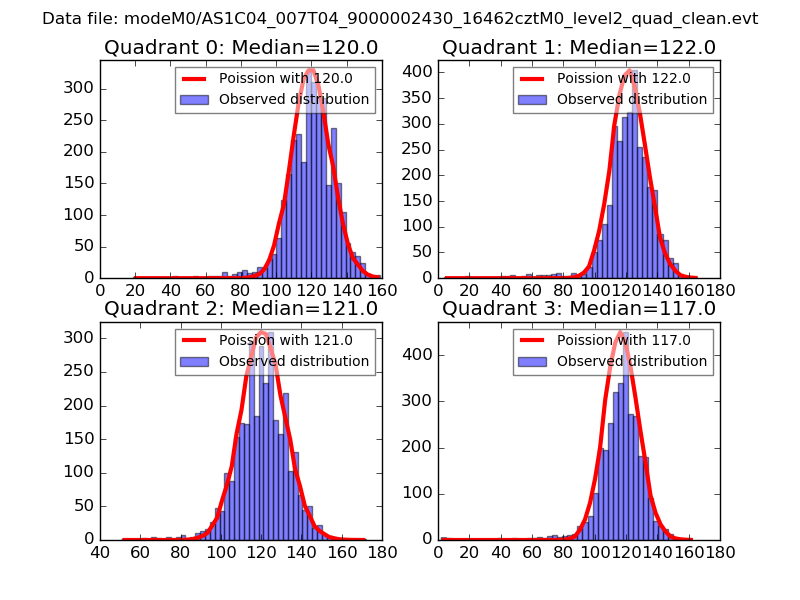
| Comparison with Poisson distribution Blue bars denote a histogram of data divided into 1 sec bins. Red curve is a Poisson curve with rate = median count rate of data. |
 |
 |
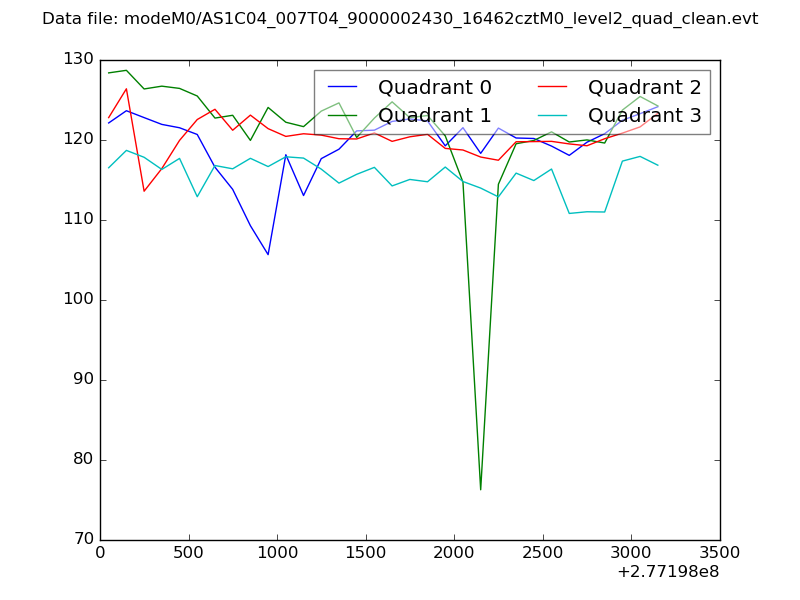
| Quadrant-wise count rates Data is divided into 100 sec bins |
 |
|
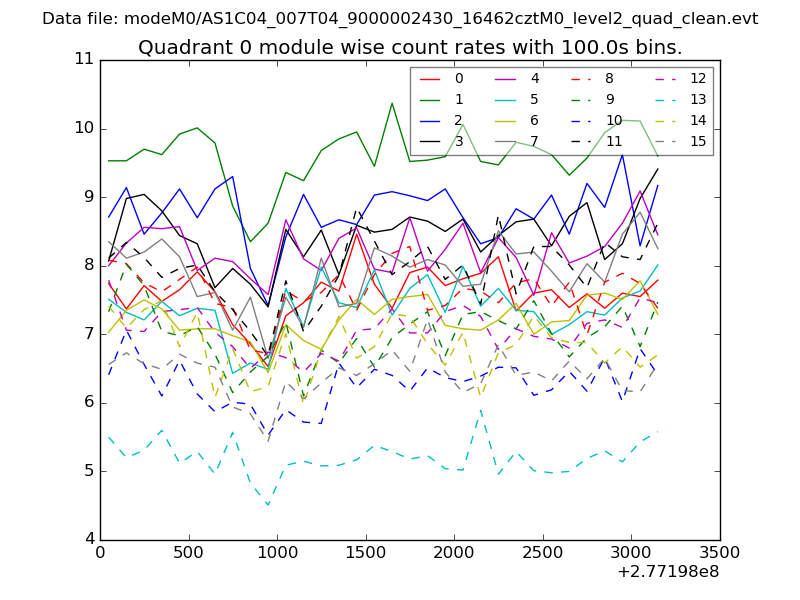
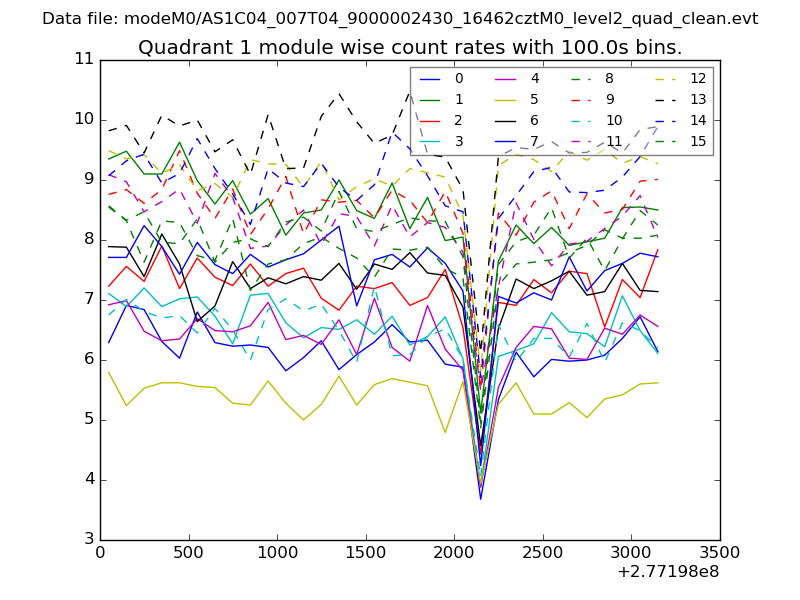
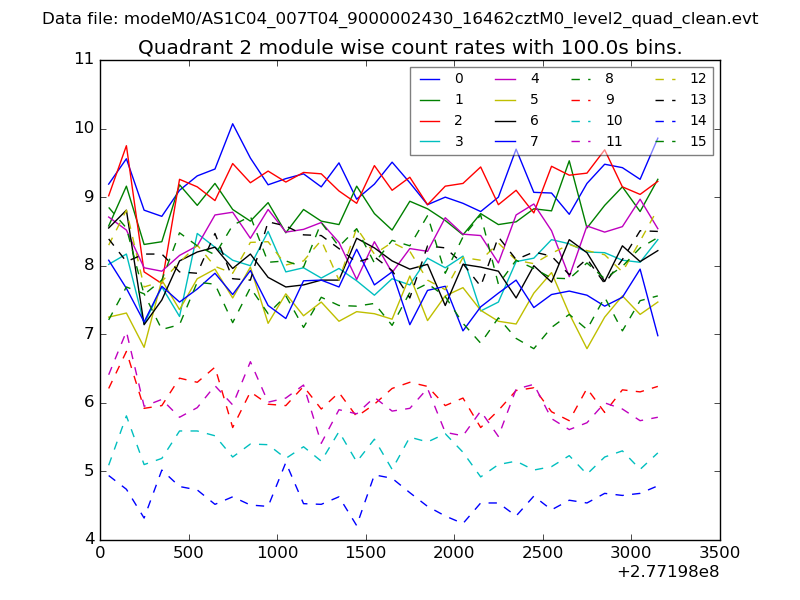
| Module-wise count rates for Quadrant A Data is divided into 100 sec bins |
 |
 |
| Module-wise count rates for Quadrant B Data is divided into 100 sec bins |
 |
 |
| Module-wise count rates for Quadrant C Data is divided into 100 sec bins |
 |
 |
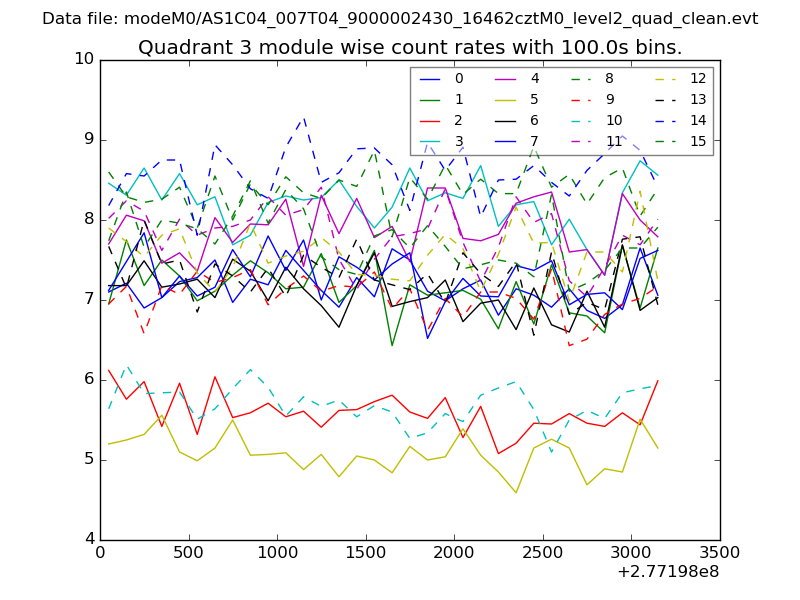
| Module-wise count rates for Quadrant D Data is divided into 100 sec bins |
 |
 |
| Parameter | Plot |
|---|---|
| CZT HV Monitor | 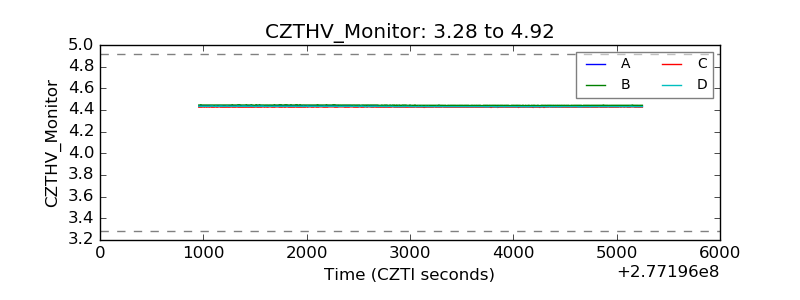 |
| D_VDD | 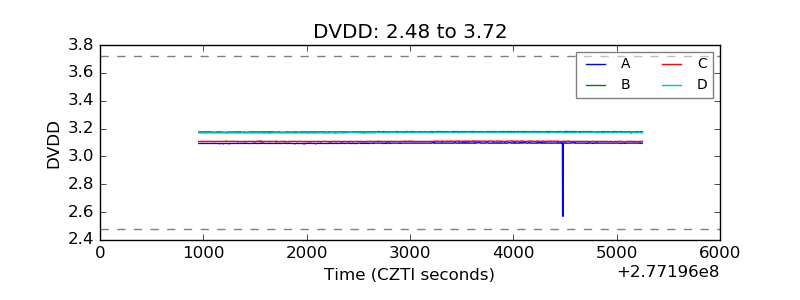 |
| Temperature 1 | 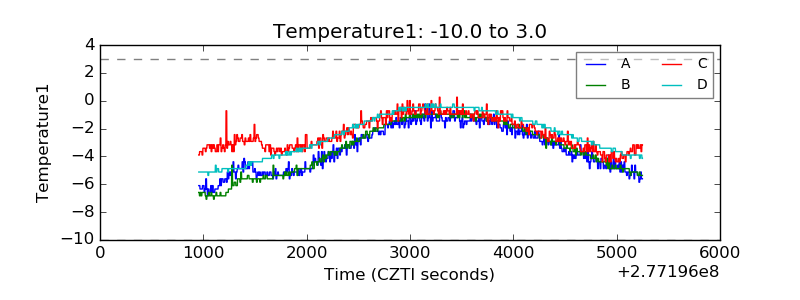 |
| Veto HV Monitor | 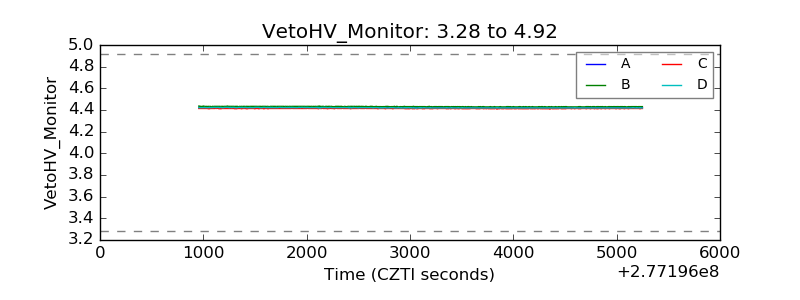 |
| Veto LLD | 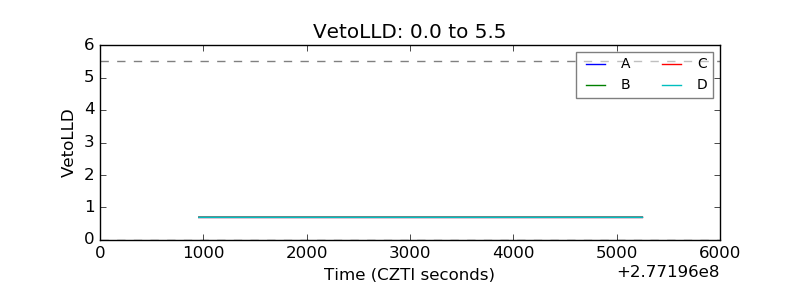 |
| Alpha Counter | 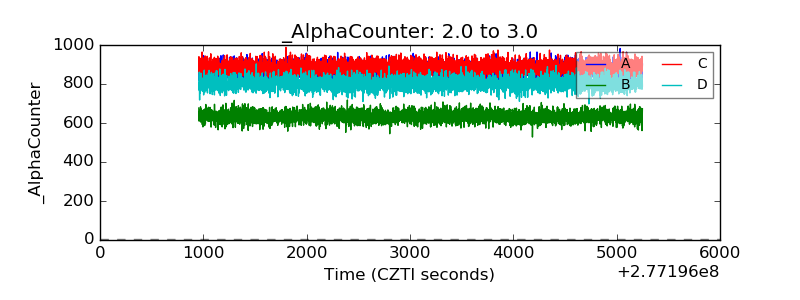 |
| _CPM_Rate | 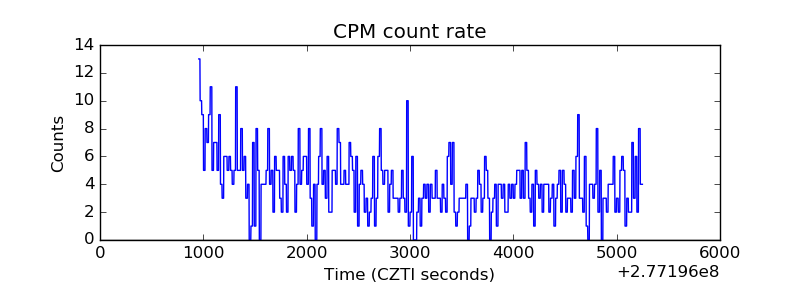 |
| CZT Counter | 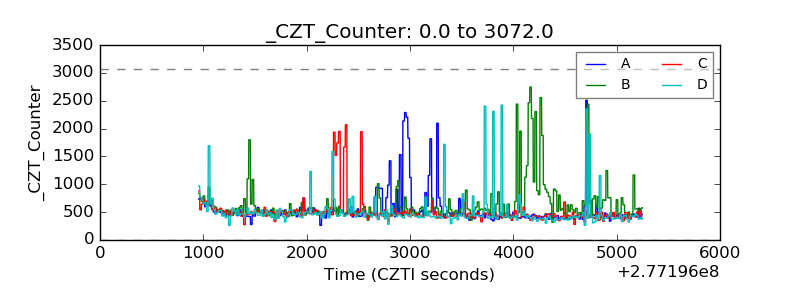 |
| +2.5 Volts monitor |  |
| +5 Volts monitor |  |
| _ROLL_ROT | 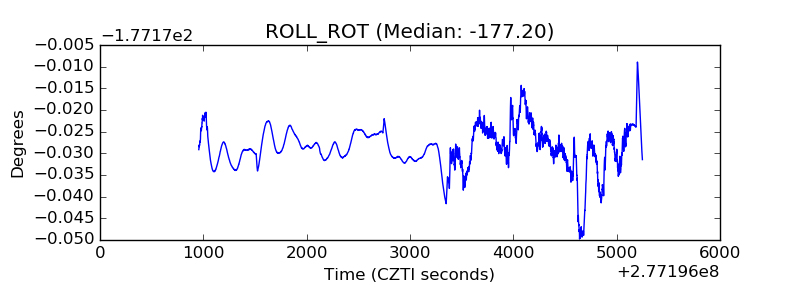 |
| _Roll_DEC | 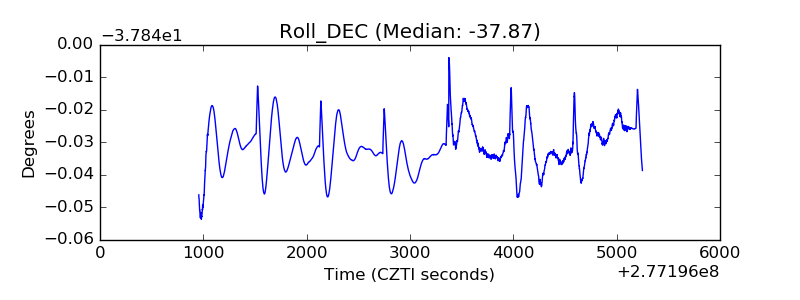 |
| _Roll_RA | 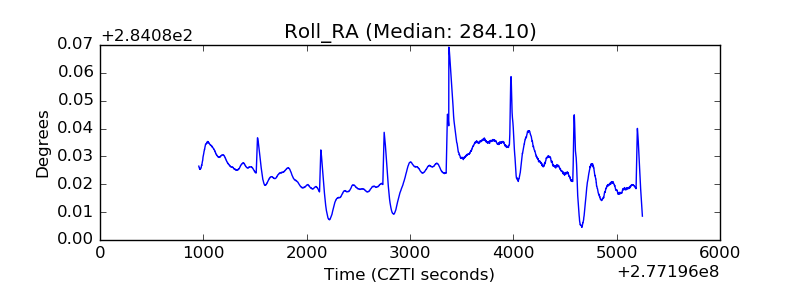 |
| Veto Counter | 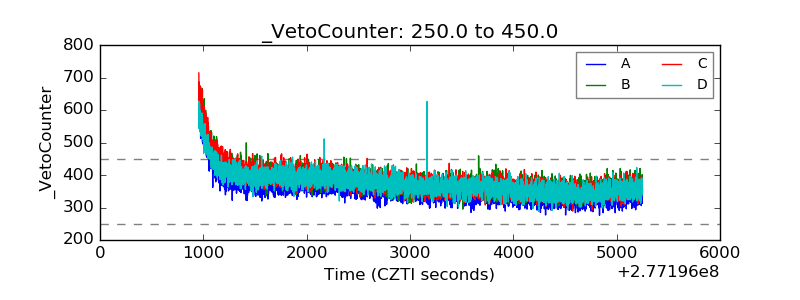 |